. 2024 Dec;42(12):1888-1898.
doi: 10.1038/s41587-023-02107-w. Epub 2024 Jan 25.

Computationally designed sensors detect endogenous Ras activity and signaling effectors at subcellular resolution

Affiliations

Computationally designed sensors detect endogenous Ras activity and signaling effectors at subcellular resolution

Jason Z Zhang et al. Nat Biotechnol. 2024 Dec.

Abstract

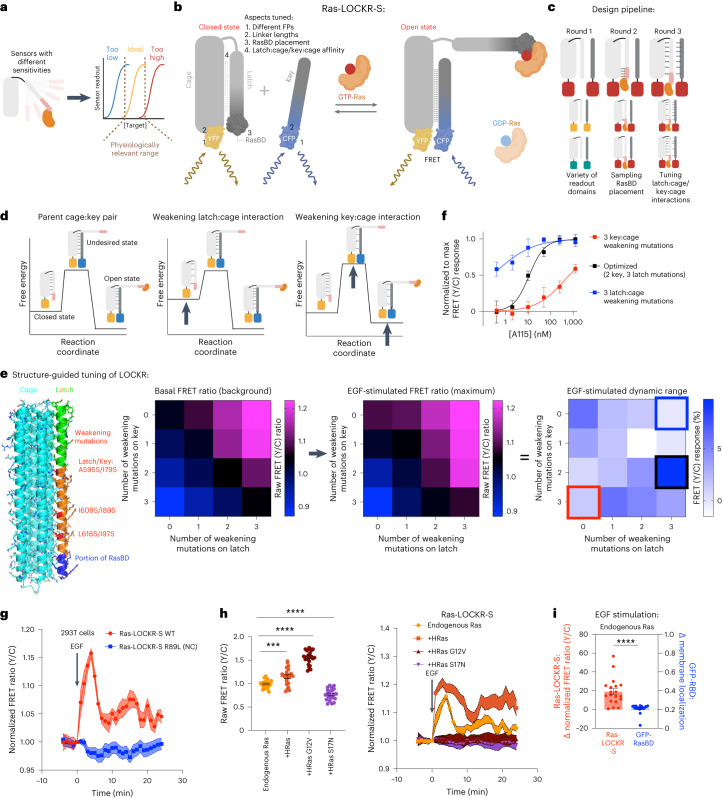
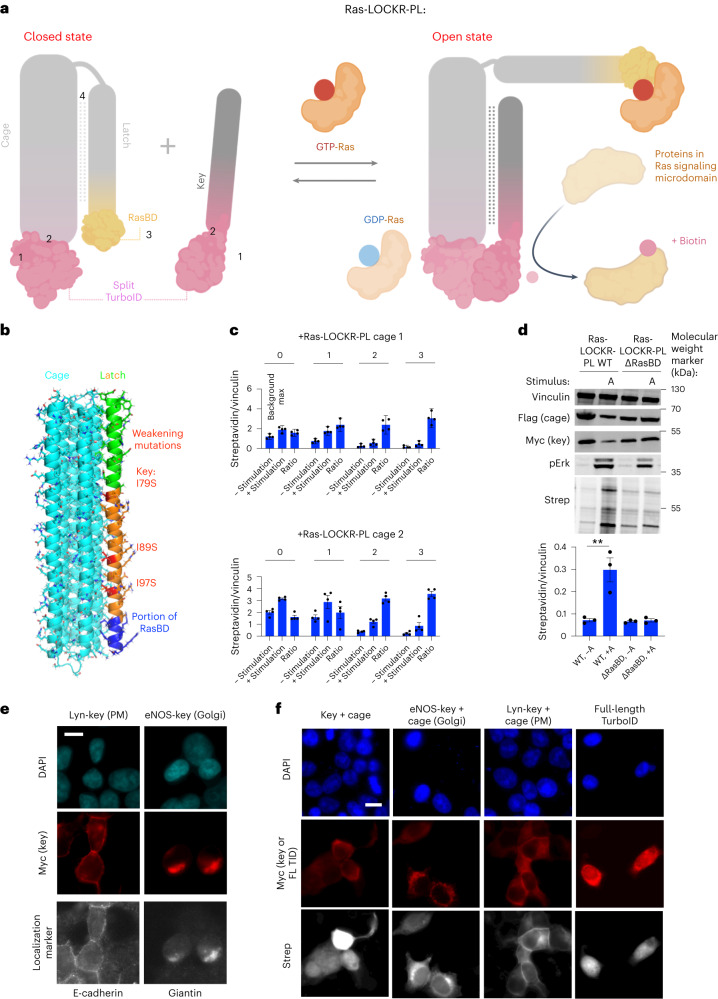
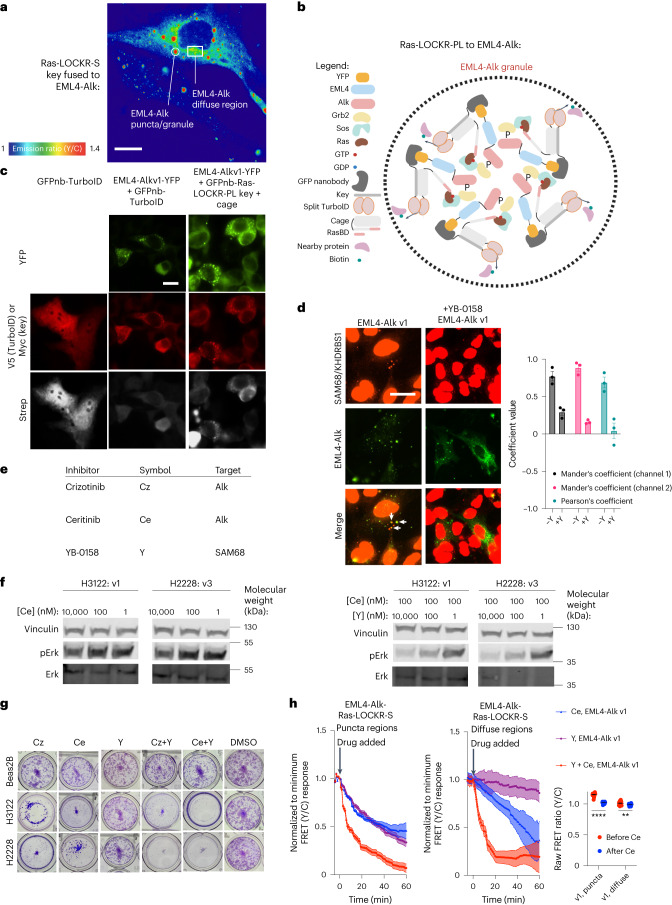
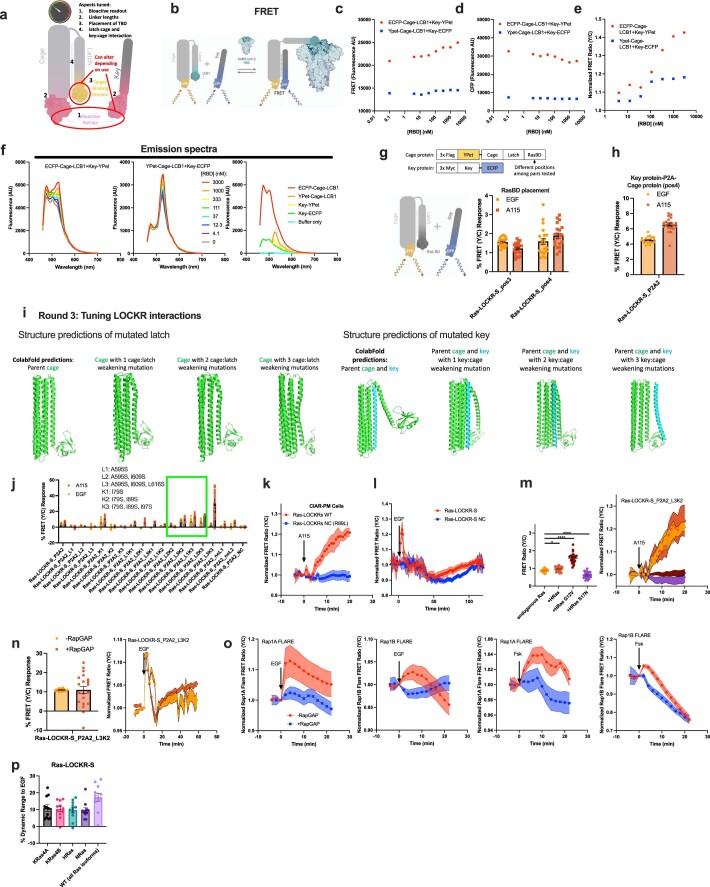
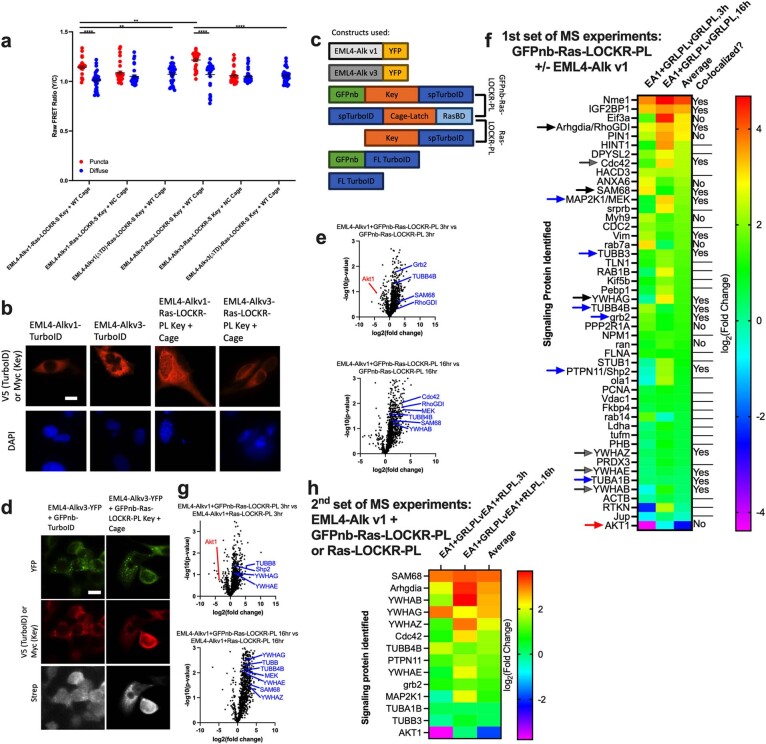
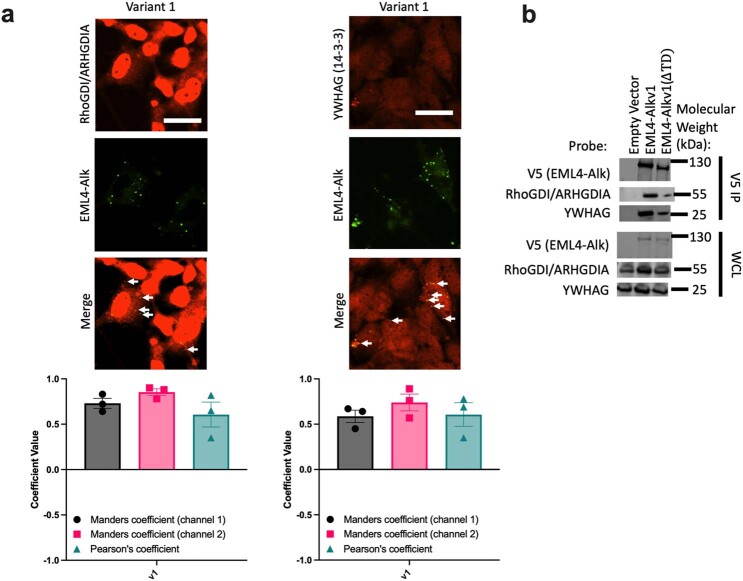
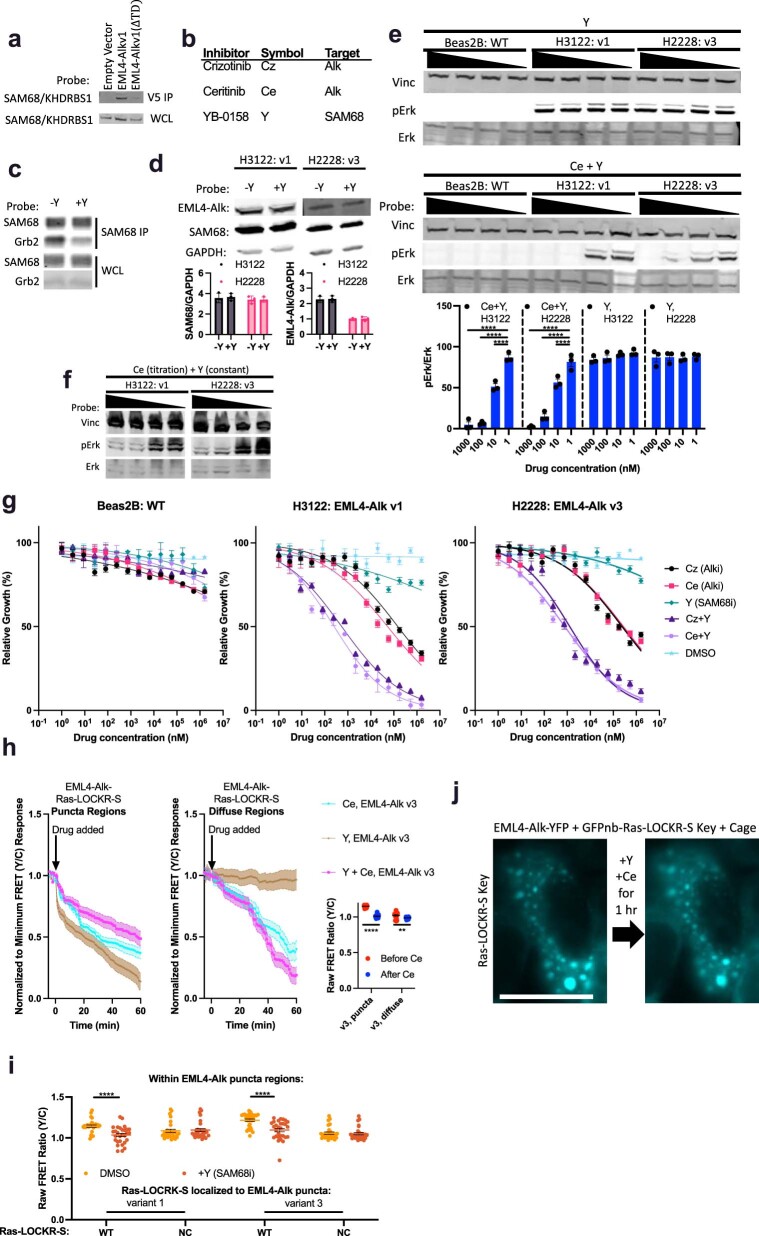
The utility of genetically encoded biosensors for sensing the activity of signaling proteins has been hampered by a lack of strategies for matching sensor sensitivity to the physiological concentration range of the target. Here we used computational protein design to generate intracellular sensors of Ras activity (LOCKR-based Sensor for Ras activity (Ras-LOCKR-S)) and proximity labelers of the Ras signaling environment (LOCKR-based, Ras activity-dependent Proximity Labeler (Ras-LOCKR-PL)). These tools allow the detection of endogenous Ras activity and labeling of the surrounding environment at subcellular resolution. Using these sensors in human cancer cell lines, we identified Ras-interacting proteins in oncogenic EML4-Alk granules and found that Src-Associated in Mitosis 68-kDa (SAM68) protein specifically enhances Ras activity in the granules. The ability to subcellularly localize endogenous Ras activity should deepen our understanding of Ras function in health and disease and may suggest potential therapeutic strategies.


Conflict of interest statement

Competing interests: J.Z.Z., D.J.M. and D.B. are co-inventors on a provisional patent application (application number 63/380,884, submitted by the University of Washington) covering the biosensors described in this paper. The other authors declare no competing interests.

Figures

Fig. 1
Fig. 1. A LOCKR-based sensor (Ras-LOCKR-S) measures endogenous Ras activity.
a, Schematic depicting the difficulty in matching sensor sensitivity to the biologically relevant concentration range. b, Ras-LOCKR-S optimization. c, Design pipeline. d, Avenues for tuning Ras-LOCKR-S switching energetics. e, Experimental tuning of Ras-LOCKR-S. Left, predicted structure of Ras-LOCKR-S with mutations highlighted. Right, heat maps of Ras-LOCKR-S with latch:cage or key:cage weakening mutations. FRET ratios (yellow/cyan) before (background) and after (maximum) 100 ng ml−1 EGF stimulation (n = 14 cells per condition) in 293T cells transiently expressing Ras-LOCKR-S. Dynamic range equals maximum FRET ratio (EGF) minus basal FRET ratio. The colored boxes in EGF-stimulated dynamic range heat map correspond to the constructs tested in f. f, Normalized to maximum FRET responses (calculated by setting the lowest and highest FRET ratios in each dataset to 0 and 1, respectively) in CIAR-PM-293 cells transiently expressing Ras-LOCKR-S mutants and treated with varying doses of A115 (n = 12–15 cells per A115 concentration). g, Normalized FRET ratio changes in 293T cells transiently expressing WT or NC Ras-LOCKR-S and stimulated with 100 ng ml−1 EGF (n = 10 cells per condition). h, Starting raw FRET ratios (left) and average normalized FRET ratio changes (right) in Ras-LOCKR-S-expressing 293T cells co-expressing WT HRas, HRas G12V, HRas S17N or no exogenous Ras (left: n = 10 cells per condition; right: n = 23 cells per condition). i, Comparison of Ras-LOCKR-S to GFP-RasBD in response to 100 ng ml−1 EGF in 293T cells (n = 19 cells). Solid lines indicate representative average timecourse, with error bars representing s.e.m. ****P = 3.5 × 10−5. Bar graphs represent mean ± s.e.m. ****P < 0.0001 and ***P < 0.001, ordinary one-way ANOVA. All LOCKR-S candidates and associated experimental results are listed in Supplementary Table 1. WT, wild-type, NC, negative control.
Fig. 2
Fig. 2. Ras-LOCKR-S can report subcellular endogenous Ras activity in multiple cell types.
a, Schematic of subcellularly targeted Ras-LOCKR-S, EGF receptor (EGFR) and CIAR at the PM (CIAR-PM). Localization sequences: PM: N-terminus of Lyn; Golgi: N-terminus of eNOS. b, Top, representative images of 293T cells transfected with localized Ras-LOCKR-S (Key with localization sequence, Cage untargeted) and stained for localization markers. Bottom, line trace comparison of CFP signal from Ras-LOCKR-S Key and localization marker. Scale bar, 5 μm. c,d, CIAR-PM-293 cells expressing Ras-LOCKR-S WT or NC localized to PM (c) or Golgi (d) were stimulated with either 100 ng ml−1 EGF or 250 nM A115. Left, representative epifluorescence images using ×60 objective (CFP channel from Key, FRET channel and pseudocolored raw FRET ratio) from three biologically independent experiments. Right, normalized FRET ratio changes (n = 16 cells per condition for WT PM and NC Golgi experiments, n = 20 cells per condition for NC PM experiments and n = 15 cells per condition for WT Golgi experiments). Scale bars, 10 μm. e, Average normalized FRET ratio responses of Jurkat T cells expressing Ras-LOCKR-S localized to Golgi or PM stimulated with either 5 μg ml−1 of α-CD3ε + α-CD28 (left) or 5 μg ml−1 of α-CD3ε + intracellular adhesion molecule 1 (ICAM-1; right) coated on the plate (n = at least 10 cells per condition). Solid lines in c,d indicate a representative average timecourse from three biologically independent experiments, with error bars representing s.e.m. Solid lines in e indicate average timecourses of FRET ratio changes from all cells combined from three experiments, with error bars representing s.e.m. WT, wild-type, NC, negative control.
Fig. 3
Fig. 3. De novo designed Ras-dependent LOCKR-based proximity labeler (Ras-LOCKR-PL) identifies Ras targets in signaling microdomains.
a, Schematic of optimized Ras-LOCKR-PL consisting of split TurboID tethered to Cage and Key; GTP-Ras binds to RasBD, promoting reconstitution of functional TurboID and biotinylation of neighboring proteins. As in Fig. 1b, numbers correspond to regions that were optimzied during the development of Ras-LOCKR-PL. b, Predicted structure of Ras-LOCKR-PL with mutations highlighted. c, Bar graph of biotinylation levels of CIAR-PM-293 cells, which were transfected with Ras-LOCKR-PL candidates, and 500 μM biotin was added for 16 h without (−stimulation) or with (+stimulation) 250 nM A115 (n = 4 experiments per condition). Ratio is +stimulation divided by −stimulation. The numbers shown over the bar graphs represent the number of key:cage weakening mutations. d, Representative western blots of CIAR-PM-293 cells transfected with Ras-LOCKR-PL WT or a mutant without RasBD (ΔRasBD), and treated with 500 μM biotin with or without 250 nM A115 (labeled ‘A’) for 16 h (n = 3 experimental repeats). e,f, Representative epifluorescence images from three biologically independent experiments. CIAR-PM-293 cells were transfected with subcellularly localized Ras-LOCKR-PL or full-length TurboID expressed, were treated with 500 μM and 250nM A115 for f and underwent immunostaining with antibodies for established localization markers (e) or fluorescent dye-conjugated streptavidin (f). Bar graphs represent mean ± s.e.m. **P < 0.01, unpaired two-tailed Student’s t-test. Scale bars, 10 μm. All LOCKR-PL candidates and associated experimental results are listed in Supplementary Table 2.
Fig. 4
Fig. 4. Identifying upstream drivers of oncogenic Ras activity inside EML4-Alk granules.
a, Representative pseudocolored FRET ratio image of a Beas2B cell transfected with Ras-LOCKR-S localized to EML4-Alk (Key fused to EML4-Alk, Cage untargeted). b, Schematic of strategy for localizing Ras-LOCKR-PL to EML4-Alk granules. c, Representative epifluorescence images from three biologically independent experiments of Beas2B cells transfected with YFP-fused EML4-Alk variant 1 (v1) and GFP nanobody (GFPnb)-fused V5-tagged TurboID or GFPnb-fused Key of Ras-LOCKR-PL. Cells were treated with 500 μM biotin for 3 h and then probed for biotin labeling. d, Left, representative epifluorescence images from three biologically independent experiments of Beas2B cells expressing YFP-tagged EML4-Alk v1, and treated with 1 μM YB-0158 or DMSO for 1 h and immunostained for SAM68. Arrows indicate co-localization of EML4-Alk with SAM68 puncta. Right, co-localization analysis (n = 3 biologically independent experiments per condition). e, Table of inhibitors used in this figure. f, Representative pErk immunoblots from three biologically independent experiments of H3122 (EML4-Alk v1 positive) or H2228 (EML4-Alk v3 positive) cancer patient cells treated with indicated concentrations of inhibitors. g, Representative images of crystal violet staining of Beas2B, H3122 and H2228 cells incubated for 1 week with inhibitors to Alk (Cz: 1 μM Crizotinib, Ce: 1 μM Ceritinib), SAM68 (Y: 1 μM YB-0158) or DMSO. h, Left, normalized to minimum FRET ratio timecourses of Beas2B cells transfected with Ras-LOCKR-S localized to EML4-Alk v1 and incubated with 10 μM of the inhibitors shown (n = 21 cells per condition). Puncta and diffuse regions were analyzed separately (**P = 0.0022 and ****P = 1.6 × 10−18). Normalized to minimum FRET ratios are calculated by normalizing the dataset to the condition with the largest decrease in FRET ratios (Ce + Y in both cases), where 0 represents the lowest FRET ratio out of the entire dataset. Right, raw FRET ratios of puncta and diffuse EML4-Alk regions after Alk inhibition for 1 h. Bar graphs represent mean ± s.e.m. ****P < 0.0001 and **P < 0.01, one-way ANOVA. Scale bars, 10 μm.
Extended Data Fig. 1
Extended Data Fig. 1. Design and characterization of Ras-LOCKR-S to track compartmentalized endogenous Ras activity dynamically and specifically.
a, Schematic describing the different aspects of Ras-LOCKR-S that were tuned. b–e, FRET-based LOCKR sensors modifying lucCageRBD, which senses RBD of SARS-CoV-2 spike protein via binding to the de novo protein binder LCB1, (b) with CFP and YFP as FRET donor and acceptor, respectively. Two placements of the FPs were tested in vitro for yellow/cyan FRET fluorescence (c), CFP fluorescence (d), and normalized yellow/cyan FRET ratio changes (normalized to no RBD) (e) with a range of RBD concentrations ([Cage]=[Key]=1 mM). f, FRET spectra (excitation wavelength: ECFP+YPet, ECFP only and buffer only=450 nm, YPet only=510 nm) of the two Key-Cage pairs against a range of RBD concentrations ([Cage]=[Key]=1 mM) (left and middle) and the Key or Cage proteins alone (right). g, (top) Domain structures shown. (bottom) Various FRET-based Ras-LOCKR-S candidates with different RasBD grafting positions on latch using Rosetta-based GraftSwitchMover (see Methods) were tested in 293T cells (100 ng/mL EGF stimulation) and CIAR-PM-293 (250 nM A115 stimulation) cells with percent FRET ratio changes reported (n = 20 cells per condition). Only YFP-tagged Cage and CFP-tagged Key were tested as YFP-tagged Key did not show fluorescence. h, RasBD placements identified in Round 1 were used in unimolecular (only Cage, no Key) without linker, with linker, and bimolecular (with P2A sequence) formats. One of the bimolecular designs showed consistent responses to EGF and A115 (n = 20 cells per condition). i, AlphaFold structure predictions of Ras-LOCKR-S Cage only (left) or Key:Cage complex (right) with the indicated mutations. j, Point mutations to weaken latch:cage or key:cage interactions (the N-terminal half of latch and key are similar) were identified via structure predictions and implemented in the bimolecular Ras-LOCKR-S candidate identified in h. The Ras-LOCKR-S candidates that displayed consistent FRET ratio changes to EGF and A115 are boxed in green and were further validated in subsequent experiments (n = 20 cells per condition). k, Ras-LOCKR-S negative control (NC, RasBDR89L) showed negligible FRET ratio changes (n = 10 cells per condition). l, Long-term imaging of Ras-LOCKR-S WT and NC in 293T cells stimulated with 100 ng/mL EGF (n = 15 cells per condition). m, CIAR-PM-293 cells expressing Ras-LOCKR-S_P2A2_L3K2 and co-expressing either WT HRas, constitutively active HRas (HRasG12V), or dominant negative HRas (HRasS17N) were stimulated with 250 nM A115. FRET ratio changes (right, n = 11 cells per condition) and starting FRET ratios (left, n = 25 cells per condition) are reported. n, Ras-LOCKR-S_P2A2_L3K2 was tested for selectivity for Ras in 293T cells expressing RapGAP and stimulated with EGF (left, n = 20 cells per condition) (right, n = 13 cells per condition). Statistics: +HRas *p = 0.01, +HRas G12V ****p = 3.9 × 10⁻¹², +HRas S17N ****p = 3.4 × 10⁻⁸. o, Testing of RapGAP in 293T cells using Rap1A and Rap1B FLARE activity reporters. FRET ratio changes of 293T cells expressing either Rap1A FLARE or Rap1B FLARE with and without RapGAP co-expressionin response to stimulation with either EGF (left) or 50 μM Forskolin (Fsk) (n = 25 cells per condition for EGF experiments, 27 cells per condition for Fsk experiments). p, FRET ratio dynamic range of Ras-LOCKR-S expressed in WT MEF cells or MEF cells expressing one major isoform of Ras stimulated with 100 ng/mL EGF (n = 11 cells per condition). See Supplementary Table 1 for domain structures and sequences. For all graphs, solid lines indicate representative average timecourses of FRET ratio changes with error bars representing standard error mean (s.e.m.). Bar graphs represent mean ± s.e.m. ****p < 0.0001, ordinary one-way ANOVA.
Extended Data Fig. 2
Extended Data Fig. 2. Characterization of localized Ras-LOCKR-S and CIAR in 293 T and Jurkat cells.
a, CIAR localized to PM (KRas4a CAAX) or Golgi (Giantin3131–3259) is stably expressed in 293-TRex cells, which were immunostained for CIAR via Bcl-xL (CIAR-PM) or Flag tag (CIAR-Golgi) and their respective localization markers with representative epifluorescence images shown from 3 biologically independent experiments. b, FRET ratio changes after A115 addition to cells stably expressing Golgi-localized CIAR (CIAR-Golgi) and transfected with subcellularly localized Ras-LOCKR-S (n = 9 cells per condition). c, Average localized Ras-LOCKR-S (Cage, YFP) fluorescence (n = 25 cells per condition). d, Scatterplot of sensor fluorescence (Cage, YFP) compared to % dynamic range to EGF. e, Comparison of the signal-to-noise ratios for EKAR4, untargeted Ras-LOCKR-S, PM-Ras-LOCKR-S, and Golgi-Ras-LOCKR-S in 293T cells stimulated with 100 ng/mL EGF (n = 28 cells per condition). f, Representative epifluorescence images from 3 biologically independent experiments of Jurkat T cells and 293T cells immunostained for Ras and giantin (Golgi marker). Solid lines indicate representative average timecourses of FRET ratio changes with error bars representing standard error mean (s.e.m.). Bar graphs represent mean ± s.e.m. Scale bars = 10 μm.
Extended Data Fig. 3
Extended Data Fig. 3. Development of Ras-LOCKR-PL.
a, b, Split ContactID-based LOCKR proximity labelers were tested using similar architecture to lucCageRBD. Schematic in a and data shown in b. Different grafting positions of the smaller bit of ContactID on the latch using Rosetta-based GraftSwitchMover (see Methods) and different linker lengths between larger bit of ContactID and Key were tested in 293T cells transfected with Flag-tagged Cage, Myc-tagged Key, full length ContactID (FL CID), and HA-tagged RBD (receptor binding domain of SARS-CoV-2 spike protein) with 5x nuclear exclusion sequence. After 16 h of 500 μM biotin incubation, these cells were subsequently western blotted for the transfected proteins and biotinylation via streptavidin (n = 4 biologically independent experiments per condition). c, d, 293T cells were transfected with Split TurboID (split site TurboID73/74)-based LOCKR Cages, Keys, or Keys with Cages, which were coexpressed with or without RBD, and biotinylation levels were probed following lysis. Biotinylation levels of cells expressing full length TurboID (FL TID) are also shown. Different placements of the split TurboID and linker lengths between split TurboID and Cage/Key were tested with the Ras-LOCKR-PL candidate that led to the highest increase in biotinylation upon RBD expression boxed in green and optimized further (n = 4 biologically independent experiments per condition). Statistics: **p = 0.0058. Schematic in c and data shown in d. e–j, Testing of Ras-LOCKR-PL candidates was done via western blotting of CIAR-PM-299 cells incubated with 250 nM A115 (labeled A) or 100 ng/mL EGF (labeled E) and 500 μM biotin for either 16 hour (g-i), 1 h (j, left), or 3 h (j, right) (n = 4 biologically independent experiments per condition). RasBD was grafted onto the latch using GraftSwitchMover (f, shows structure predictions) and tested for increases in biotinylation after Ras activation by A115 (FL = full length TurboID) (n = 4 biologically independent experiments per condition). The highest dynamic range Ras-LOCKR-PL candidates are boxed in green (g) and were further optimized by either weakening latch:cage interaction by mutating latch (h) or weakening key:cage interaction by mutating the Key (2 different Cages tested for left and right) (i) (n = 4 biologically independent experiments per condition). Statistics for g from left to right: *p = 0.032, *p = 0.025. C-terminal Key truncations were also tested to weaken key:cage interaction (i) (n = 4 biologically independent experiments per condition). Statistics for i from left to right: *p = 0.042, *p = 0.015, *p = 0.032, *p = 0.044, *p = 0.017, *p = 0.023, *p = 0.027. The highest dynamic range Ras-LOCKR-PL candidates boxed in green (i) were tested in CIAR-PM-293 cells treated for shorter times with A115 or EGF (j) (n = 4 biologically independent experiments per condition). Statistics for j from left to right: *p = 0.021, *p = 0.036, *p = 0.048, *p = 0.018. See Supplementary Table 2 for domain structures and sequences. Bar graphs represent mean ± s.e.m. All statistics are derived from a two-way student t-test.
Extended Data Fig. 4
Extended Data Fig. 4. Characterization of Ras-LOCKR-PL.
a–c, Representative western blots of CIAR-PM-293 cells treated with 500 μM biotin with or without 250 nM A115 (labeled ‘A’) for 16 h. (a) Negative controls (Myc-tagged Key or Flag-tagged Cage only), positive control (TurboID-CRaf), and Ras-LOCKR-PL tested designs (Key+Cage) were expressed, and treated with DMSO or with A115. Cell lysates were subjected to a streptavidin pulldown (PD) and the amount of Ras eluted from the streptavidin PD over the amount of Ras from whole cell lysate (WCL) was quantified (n = 5 biologically independent experiments per condition). (b) Optimized Ras-LOCKR-PL co-expressed with various HA-tagged Ras mutants/effectors or Rap effector (CalDAG-GEFI) (n = 3 biologically independent experiments per condition). (c) Localized Ras-LOCKR-PLs were tested for A115-induced biotinylation in CIAR-PM-293 cells (representative of 3 biologically independent experiments). d, Representative epifluorescence images from 3 biologically independent experiments of EKAR4 localized to PM (N-terminus of Lyn) or Golgi (N-terminus of eNOS) transfected into 293T cells, which were immunostained for their respective localization markers. e, 293T cells transfected with localized EKAR4 and either with or without Ras-LOCKR-PL also localized to same region. Normalized FRET ratio changes over time of these cells stimulated with 100 ng/mL EGF (n = 12 cells per condition). Solid lines indicate representative average timecourse with error bars representing standard error mean (s.e.m.). Bar graphs represent mean ± s.e.m. **p < 0.01, *p < 0.05, unpaired two-tailed Student’s t-test. Scale bar = 10 μm.
Extended Data Fig. 5
Extended Data Fig. 5. Ras-LOCKR tools identify the Ras activity and environment inside EML4-Alk granules.
a, Raw FRET ratios of Beas2B cells transfected with Ras-LOCKR-S or NC sensor tethered to EML4-Alk variant 1 (v1)/variant 3 (v3) full length or with trimerization domain deleted (∆TD) (n = 29 cells per condition). Statistics: p-values from left to right: 5.6 × 10⁻¹³, 0.0045, 0.0082, 6.7 × 10⁻¹², 1.3 × 10⁻¹⁴. b, Representative epifluorescence images from 3 biologically independent experiments of Beas2B cells transfected with V5-tagged TurboID or Myc-tagged Ras-LOCKR-PL tethered to EML4-Alk v1/v3 and immunostained for respective tags. c, Domain structures of constructs used. d, Representative epifluorescence images from 3 biologically independent experiments of Beas2B (WT lung) transfected with EML4-Alk variant 3 (v3), full length V5-tagged TurboID tethered to GFP nanobody (GFPnb), or Myc-tagged Ras-LOCKR-PL tethered to GFPnb and immunostained for respective tags and biotinylation via fluorescent dye-conjugated streptavidin. e, Volcano plot of mass spectrometry results of Beas2B cells expressing either GFPnb-Ras-LOCKR-PL and EML4-Alk-v1 or GFPnb-Ras-LOCKR-PL alone, and incubated for indicated durations with 500 μM biotin. Plotted differences compare enrichment from GFPnb-Ras-LOCKR-PL and EML4-Alk-v1 coexpressing cells against cells expressing GFPnb-Ras-LOCKR-PL alone. P-values derived from two-way student t-test. f, From MS data, hits were filtered based on selective labeling within EML4-Alk v1-expressing cells (more than 2-fold change (log2(fold change) > 1)), passing a statistical cutoff (p-value cutoff of 0.5 (-log10p-value ~ 1.3)) for either the 3 h or 16 h datasets, are signaling proteins as identified in gene ontology analysis, and abundant proteins (proteins related to the proteasome and ribosome) were excluded. Several hits from this dataset were validated by immunostaining in Beas2B cells expressing YFP-tagged EML4-Alk v1. The co-localized column (right-most) indicates whether that hit was co-localized with EML4-Alk v1 granules (yes), not co-localized (no), or not tested (----). For the 14-3-3 proteins (YWHAB/E/G/Z), the co-localization validation is from a 14-3-3 antibody which has an epitope that targets all these 14-3-3 variants. Heat maps (colored by log2fold change) display the signaling-related proteins detected in EML4-Alk v1-expressing Beas2B cells. Blue arrows are proteins expected to be enriched in EML4-Alk v1 granules, red arrows are proteins expected to be excluded from EML4-Alk v1 granules, black arrows are new hits that were verified later on to be sequestered in EML4-Alk granules, and gray arrows are known interactors (based on STRING databases) of the validated proteins. g, Volcano plot of mass spectrometry results of EML4-Alk v1-expressing Beas2B cells co-expressing either GFPnb-Ras-LOCKR-PL (right) or Ras-LOCKR-PL (left) and treated for indicated durations with 500 μM biotin. P-values derived from two-way student t-test. h, Hits identified in first set of MS experiments (e-f) were identified in the second set of MS experiments (g), and the log2(fold change) from the second set of MS experiments are listed and colored in the heatmap shown. MS data is documented in Supplementary Table 3 (P-values derived from two-way student t-test). Bar graphs represent mean ± s.e.m. ****p < 0.0001, **p < 0.01, ordinary two-way ANOVA. Scale bars = 10 μm.
Extended Data Fig. 6
Extended Data Fig. 6. Identification of components sequestered in EML4-Alk granules.
a, (top) Representative epifluorescence images of Beas2B cells expressing GFP-tagged EML4-Alk v1 and immunostained for hits identified in the mass spectrometry analysis. Arrows indicate co-localization of EML4-Alk v1 with probed protein. (bottom) Colocalization analysis (n = 3 biologically independent experiments per condition). b, Representative immunoblot of Beas2B cells transfected with V5-tagged EML4-Alk v1 full length or with trimerization domain deleted (∆TD), subjected to V5 immunoprecipitation, and probed for hits identified in the MS analysis. Bar graphs represent mean ± s.e.m.
Extended Data Fig. 7
Extended Data Fig. 7. SAM68 regulates Ras signaling inside EML4-Alk granules.
a, Representative immunoblot from 3 biologically independent experiments of Beas2B cells transfected with V5-tagged EML4-Alk v1 full length or with trimerization domain deleted (∆TD), subjected to V5 immunoprecipitation, and probed for SAM68. The EML4-Alk pulldowns and whole cell lysate levels are the same as Extended Data Fig. 6b. b, List of inhibitors used, their abbreviations, and their target. c, Representative immunoblot from 3 biologically independent experiments of Beas2B cells treated with 1 μM YB-0158 for 1 h, underwent Sam68 immunoprecipitation for some of the sample, and probed for Sam68 and Grb2. Top: Sam68 immunoprecipitation. Bottom: whole cell lysate. d, H3122 or H2228 cells were treated with 1 μM YB-0158 for 24 h and probed for Alk (EML4-Alk) and SAM68. Top: Representative immunoblot. Bottom: densitometry analysis (n = 3 experiments). e, (top) Representative immunoblot of Beas2B, H3122, and H2228 cells treated for 1 h with varying concentration of Ceritinib (1nM-1μM) and YB-0158 (1nM-1μM). (bottom) Relative phosphorylated Erk over total Erk quantified (n = 3 experiments per condition). Statistics for e from left to right: ****p = 7.3 × 10⁻⁵, ***p = 0.00072, **p = 0.0043, **p = 0.0047, two-way student t-test. f, Representative immunoblot from 3 biologically independent experiments of H3122 and H2228 cells treated for 1 h with either constant concentration of YB-0158 (200 nM) and a range of concentrations of Ceritinib (1nM-1μM) (left) or a constant concentration of Ceritinib (200 nM) and a range of concentrations of YB-0158 (1nM-1μM) (right). g, Cell counts of Beas2B, H3122, H2228 cell lines incubated for 1 week with varying concentrations of inhibitors to Alk and/or SAM68 (n = 3 experiments per condition), or DMSO. h, (left) Normalized to minimum FRET ratio time-courses of Beas2B cells transfected with Ras-LOCKR-S localized to EML4-Alk v3 and incubated with 1 μM of inhibitors (n = 10 cells per condition). Puncta and diffuse regions were analyzed separately. Normalized to minimum FRET ratios are calculated by normalizing the data set to the condition with the largest decrease in FRET ratios (Ce + Y in both cases) where 0 represents the lowest FRET ratio out of the entire data set. (right) Raw FRET ratios of puncta and diffuse EML4-Alk regions after Alk inhibition for 1 h (n = 21 cells per condition). Statistics: puncta: ****p = 1.5 × 10⁻²², diffuse: **p = 0.0025. i, Average raw FRET ratios in the punctate regions of Beas2B cells expressing Ras-LOCKR-S WT or NC sensor fused to EML4-Alk v1. Cells were treated with either DMSO or 1 μM YB-0158 for 1 h (n = 29 cells per condition). Statistics: v1: ****p = 1.7 × 10⁻³², v3: ****p = 6.8 × 10⁻¹³. j, Representative epifluorescence images from 3 biologically independent experiments of Beas2B cells expressing YFP-tagged EML4-Alk v1, GFPnb-Ras-LOCKR-S Key, and Cage. CFP channel is shown indicating localization of Ras-LOCKR-S Key. These cells were incubated with 1 μM YB-0158 and 1 μM Ceritinib for 1 h. Solid lines in g indicate IC50 fit with points representing average normalized cell count. Solid lines in h indicate representative average time with error bars representing standard error mean (s.e.m.). Bar graphs represent mean ± s.e.m. ****p < 0.0001, **p < 0.01 ordinary two-way ANOVA comparing to cells treated with DMSO. Scale bars = 10 μm.

References

    1. Cox, A. D. & Der, C. J. Ras history. Small GTPases1, 2–27 (2010). - PMC - PubMed
    1. Augsten, M. et al. Live‐cell imaging of endogenous Ras‐GTP illustrates predominant Ras activation at the plasma membrane. EMBO Rep.7, 46–51 (2006). - PMC - PubMed
    1. Bivona, T. G. et al. PKC regulates a farnesyl-electrostatic switch on K-Ras that promotes its association with Bcl-XL on mitochondria and induces apoptosis. Mol. Cell21, 481–493 (2006). - PubMed
    1. Chiu, V. K. et al. Ras signalling on the endoplasmic reticulum and the Golgi. Nat. Cell Biol.4, 343–350 (2002). - PubMed
    1. Tulpule, A. et al. Kinase-mediated RAS signaling via membraneless cytoplasmic protein granules. Cell184, 2649–2664 (2021). - PMC - PubMed

MeSH terms

Substances

LinkOut - more resources