. 2024 Jan 25;19(1):12.
doi: 10.1186/s13024-024-00701-3.

Mitochondrial CISD1/Cisd accumulation blocks mitophagy and genetic or pharmacological inhibition rescues neurodegenerative phenotypes in Pink1/parkin models

Affiliations

Mitochondrial CISD1/Cisd accumulation blocks mitophagy and genetic or pharmacological inhibition rescues neurodegenerative phenotypes in Pink1/parkin models

Aitor Martinez et al. Mol Neurodegener. .

Abstract

Background: Mitochondrial dysfunction and toxic protein aggregates have been shown to be key features in the pathogenesis of neurodegenerative diseases, such as Parkinson's disease (PD). Functional analysis of genes linked to PD have revealed that the E3 ligase Parkin and the mitochondrial kinase PINK1 are important factors for mitochondrial quality control. PINK1 phosphorylates and activates Parkin, which in turn ubiquitinates mitochondrial proteins priming them and the mitochondrion itself for degradation. However, it is unclear whether dysregulated mitochondrial degradation or the toxic build-up of certain Parkin ubiquitin substrates is the driving pathophysiological mechanism leading to PD. The iron-sulphur cluster containing proteins CISD1 and CISD2 have been identified as major targets of Parkin in various proteomic studies.

Methods: We employed in vivo Drosophila and human cell culture models to study the role of CISD proteins in cell and tissue viability as well as aged-related neurodegeneration, specifically analysing aspects of mitophagy and autophagy using orthogonal assays.

Results: We show that the Drosophila homolog Cisd accumulates in Pink1 and parkin mutant flies, as well as during ageing. We observed that build-up of Cisd is particularly toxic in neurons, resulting in mitochondrial defects and Ser65-phospho-Ubiquitin accumulation. Age-related increase of Cisd blocks mitophagy and impairs autophagy flux. Importantly, reduction of Cisd levels upregulates mitophagy in vitro and in vivo, and ameliorates pathological phenotypes in locomotion, lifespan and neurodegeneration in Pink1/parkin mutant flies. In addition, we show that pharmacological inhibition of CISD1/2 by rosiglitazone and NL-1 induces mitophagy in human cells and ameliorates the defective phenotypes of Pink1/parkin mutants.

Conclusion: Altogether, our studies indicate that Cisd accumulation during ageing and in Pink1/parkin mutants is a key driver of pathology by blocking mitophagy, and genetically and pharmacologically inhibiting CISD proteins may offer a potential target for therapeutic intervention.

Keywords: Ageing; Autophagy; CISD1; CISD2; Cisd; Mitochondria; Mitophagy; Neurodegeneration; PINK1; Parkin; Parkinson’s disease.


Conflict of interest statement

The authors declare that they have no competing interests.

Figures

Fig. 1
Fig. 1
Cisd accumulation disrupts mitochondria affecting locomotion and lifespan. A Representative immunoblot of whole fly lysates of the indicated genotypes from 2- and 30-day-old flies probed for Cisd (CISD2, Proteintech, 13318-1-AP) and Tubulin as loading control. B, C Quantification of Cisd monomer or dimer levels in 2- and 30-day-old flies analysed in A. D Confocal microscopy of flight muscle from 2-day-old wild-type control (WT ctrl) or Cisd overexpressing (OE) flies driven by da-GAL4, immunostained for ATP5A mitochondrial marker. E Climbing assay of 2- and 20-day-old WT and ubiquitous Cisd OE flies via the da-GAL4 driver. F Lifespan of WT and ubiquitous Cisd OE flies. N > 130 animals. G Confocal microscopy of neuronal soma from control (WT ctrl) or Cisd overexpressing (OE) larvae co-expressing the mito-GFP mitochondrial marker via the nSyb-GAL4 driver. H Climbing assay of 2- and 20-day-old WT and neuronal Cisd OE flies via the nSyb-GAL4 driver. I Lifespan of WT and neuronal Cisd OE flies. N > 90 animals. Statistical analyses: B RM one-way ANOVA with Geisser-Greenhouse correction; C paired t-test; E, H Mann-Whitney non-parametric test. *P < 0.05; **P < 0.01; ****P < 0.0001. Scale bars = 10 μm
Fig. 2
Fig. 2
Drosophila Cisd is functionally more similar to CISD1. A Immunoblots of protein lysates from RPE1 cells ± YFP-Parkin overexpression (OE) treated with antimycin A (4 µM) and oligomycin (10 µM) for the indicated time to induce mitophagy, probed for mitophagy marker pUb, and degradation of TOM20 and CISD1/2 (CISD1, Proteintech, 16006-1-AP; and CISD2, Proteintech, 13318-1-AP), alongside respective loading control total Ub and Tubulin. Blot is representative of 3 replicate experiments. B Confocal micrographs of U2OS cells transfected with human CISD1-FLAG or CISD2-FLAG, counter-stained with antibodies against TOM20 (mitochondria) or Calnexin (ER). C Confocal micrographs of Drosophila larval neurons expressing transgenic mito-GFP and WT control, human CISD1-HA or CISD2-HA driven by nSyb-GAL4. D Immunoblots of protein lysates of 2- and 20-day-old whole flies expressing the indicated transgenes via da-GAL4 versus WT control, probed for pUb and CISD1/2 with (CISD2, Proteintech, 13318-1-AP). Scale bars = 10 μm
Fig. 3
Fig. 3
Cisd overexpression blocks mitophagy flux. A Immunoblot analysis of whole fly lysates from 2-day-old flies of the indicated genotypes, analysed for pUb, and Tubulin or total protein levels as loading controls. Blot is representative of 3 replicate experiments. Cisd overexpression was driven by da-GAL4. B Confocal microscopy analysis of adult Drosophila flight muscle from 2-day-old flies of WT control, parkin mutant and Cisd overexpression driven by da-GAL4 immunostained for mitochondria (ATP5A) and pUb. CF Confocal analysis of mitophagy reporter mito-QC (OMM-localised tandem RFP-GFP) of WT or Cisd overexpression driven by nSyb-GAL4, in larval (C, D) or adult (E, F) neurons with ‘red-only’ mitolysosomes shown. D, F Number of mitolysosomes quantified shown in C and E. Data points indicate individual animals analysed. Statistical analysis: unpaired t-test; **P < 0.01; ****P < 0.0001. Scale bars = 10 μm
Fig. 4
Fig. 4
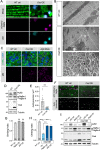
Cisd overexpression causes autophagosome accumulation and prevents autophagy. A Confocal micrographs of WT control versus Cisd overexpressing adult flight muscle via Mef2-GAL4, immunostained for p62 alongside imaging mCherry-Atg8a autophagosome reporter. B Electron micrographs of flight muscle as in A, showing multiple autophagic vesicles (inset) in proximity to disrupted mitochondria (arrowheads). C Larval neurons of WT control versus Cisd overexpressing or Atg5 knockdown (via nSyb-GAL4 driver) animals immunostained for p62 alongside ATP5a (mitochondria) and DAPI. D Immunoblot analysis of protein lysates from whole flies overexpressing Cisd (via da-GAL4) or WT controls. Blots were probed with antibodies against p62, Atg8a (LC3), Cisd (CISD2, Proteintech, 13318-1-AP) and Tubulin. Quantification of replicate blots is shown in Fig. S2A, B. E Quantification of the number of autolysosomes shown in F. Data points indicate individual animals analysed. Statistical analysis: unpaired t-test; ***P < 0.001. F Confocal microscopy analysis of adult flight muscle WT control versus Cisd overexpressing animals co-expressing the autophagy flux reporter GFP-mCherry-Atg8a driven by Mef2-GAL4. G, H Locomotor climbing assay of 2-day-old adult flies expressing the indicated transgenes (via da-GAL4). I Immunoblot analysis of equivalent samples analysed in G and H, probed for autophagy markers (p62 and Atg8a), Cisd and Tubulin. Quantification of replicate blots is shown in Fig. S2C. Statistical analyses: Kruskal-Wallis non-parametric test with Dunn’s post-hoc correction. ***P < 0.001; ****P < 0.0001. Scale bars = 10 μm for light microscopy, or indicated on image for EM
Fig. 5
Fig. 5
Loss of Cisd promotes mitophagy flux. A, B Confocal microscopy analysis of mitophagy reporter mito-QC in flight muscle from WT control and Cisd knockdown flies driven by Mef2-GAL4 of the indicated ages. B Quantification of the number of mitolysosomes shown in A. Data points indicated individual animals analysed. Statistical analysis: unpaired t-test; *P < 0.05; **P < 0.01. C Immunoblot analysis of ARPE-19 cells expressing mito-QC, shown in D, with non-targeting siRNAs (Ctrl) or targeting CISD1, CISD2 or both. Confocal microscopy analysis of mitophagy using mito-QC in cells shown in C. E Quantification of the number of mitolysosomes shown in D. Data points indicate replicate experiments. Statistical analysis: one-way ANOVA with Dunnett’s post-hoc correction; *P < 0.05; **P < 0.01. Scale bars = 10 μm
Fig. 6
Fig. 6
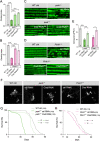
Cisd knockdown ameliorates Pink1/parkin mutant phenotypes. A, B Climbing analysis of WT control versus (A) parkin or (B) Pink1 mutants with control or Cisd RNAi. GD and KK indicate independent RNAi lines driven by da-GAL4. See also Fig. S 3B. N is shown inside bars. C, D Confocal microscopy of flight muscle from (young) wild-type control (WT ctrl) or (C) parkin or (D) Pink1 mutants expressing control or Cisd RNAi stained for the mitochondrial marker ATP5a. E Quantification of dopaminergic (DA) neurons shown in F. F 30-day-old WT or parkin or Pink1 mutants expressing control or Cisd RNAi, immunostained for tyrosine hydroxylase. G, H Lifespan analysis of WT versus (G) parkin or (H) Pink1 mutants with control or Cisd RNAi. Statistical analyses: (A, B) Kruskal-Wallis non-parametric test with Dunn’s post-hoc correction, (E) one-way ANOVA with Sidak’s post-hoc correction; (G, H) Log rank (Mantel-Cox) test. *P < 0.05; **P < 0.01; ***P < 0.001; ****P < 0.0001. Scale bars = 10 μm
Fig. 7
Fig. 7
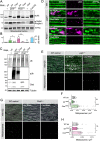
Loss of Cisd rescues Pink1 and parkin mutant degenerative phenotypes. A Immunoblot of mitochondrial protein lysates from Cisd knockdown driven by da-GAL4 in WT versus Pink1 and parkin mutant backgrounds, alongside respective controls, probed for p62 and Atg8a (LC3) levels with ATP5a loading control. B Relative p62 levels quantified from blots in A, normalised to WT control. Statistical comparisons are against WT control unless indicated. C Immunoblots of whole fly lysates of genotypes as in A, probed for pUb, Ub, Cisd (CISD2, Proteintech, 13318-1-AP) and Tubulin as loading control. D Confocal micrographs of adult flight muscle from Cisd knockdown driven by da-GAL4 in WT versus Pink1 and parkin mutant backgrounds, alongside respective controls, immunostained for APT5a and p62. E Confocal microscopy analysis of mitophagy reporter mito-QC in flight muscle from Cisd knockdown driven by Mef2-GAL4 in 2-day-old WT and parkin mutant backgrounds, alongside WT control. F Quantification of the number of mitolysosomes shown in E. G Confocal microscopy analysis of mitophagy reporter mito-QC in flight muscle from Cisd knockdown driven by Mef2-GAL4 in 2-day-old WT and Pink1 mutant backgrounds, alongside WT control. H Quantification of the number of mitolysosomes shown in G. Data points indicate individual animals analysed. Statistical analysis: one-way ANOVA with Sidak’s post-hoc correction; *P < 0.05, **P < 0.01; ****P < 0.0001. Scale bars = 10 μm
Fig. 8
Fig. 8
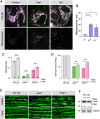
CISD inhibitors induce mitophagy and rescue rescues Pink1 and parkin mutant phenotypes. A Confocal microscopy analysis of WT ARPE-19 cells expressing mito-QC to visualise mitolysosomes (shown separately) treated with 100 µM rosiglitazone (Rosi), NL1 or vehicle. B Quantification of the number of mitolysosomes per cell of conditions shown in A. Data points indicate replicate experiments. Statistical analysis: RM one-way ANOVA with Geisser-Greenhouse correction; *P < 0.05; ****P < 0.0001. C Analysis of Climbing, (D) thoracic indentations and drooped-wing phenotype, and (E) mitochondrial morphology in flight muscle of Pink1 and parkin mutants alongside WT control flies, treated with 1 mM rosiglitazone (Rosi) or vehicle. Statistical analysis: Chi-squared test. ***P < 0.001; ****P < 0.0001. Scale bars = 10 μm. F Immunoblot analysis of protein lysates from whole flies upon treatment with 1 mM rosiglitazone (Rosi) or vehicle. Samples were homogenised under reducing conditions and blots were probed for Cisd (CISD2, Proteintech, 13318-1-AP) and Tubulin

References

    1. Poewe W, Seppi K, Tanner CM, Halliday GM, Brundin P, Volkmann J, et al. Parkinson disease. Nat Rev Dis Primer. 2017;3:1–21. - PubMed
    1. Kitada T, Asakawa S, Hattori N, Matsumine H, Yamamura Y, Minoshima S, et al. Mutations in the parkin gene cause autosomal recessive juvenile parkinsonism. Nature. 1998;392:605–608. doi: 10.1038/33416. - DOI - PubMed
    1. Valente EM, Abou-Sleiman PM, Caputo V, Muqit MMK, Harvey K, Gispert S, et al. Hereditary early-Onset Parkinson’s Disease caused by mutations in PINK1. Science. 2004;304:1158–1160. doi: 10.1126/science.1096284. - DOI - PubMed
    1. Narendra D, Tanaka A, Suen D-F, Youle RJ. Parkin is recruited selectively to impaired mitochondria and promotes their autophagy. J Cell Biol. 2008;183:795–803. doi: 10.1083/jcb.200809125. - DOI - PMC - PubMed
    1. Narendra DP, Jin SM, Tanaka A, Suen D-F, Gautier CA, Shen J, et al. PINK1 is selectively stabilized on impaired Mitochondria to activate Parkin. PLOS Biol. 2010;8:e1000298. doi: 10.1371/journal.pbio.1000298. - DOI - PMC - PubMed

LinkOut - more resources