. 2024;6(1):25-39.
doi: 10.1038/s42256-023-00763-w. Epub 2023 Nov 30.

Reconstructing growth and dynamic trajectories from single-cell transcriptomics data

Affiliations

Reconstructing growth and dynamic trajectories from single-cell transcriptomics data

Yutong Sha et al. Nat Mach Intell. 2024.

Abstract

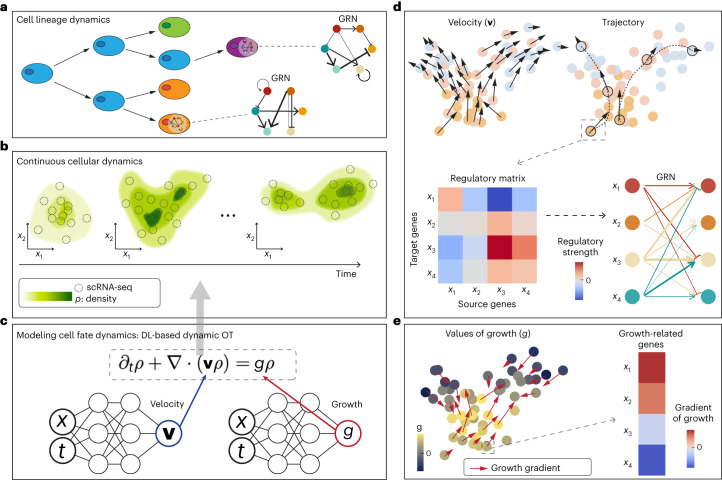
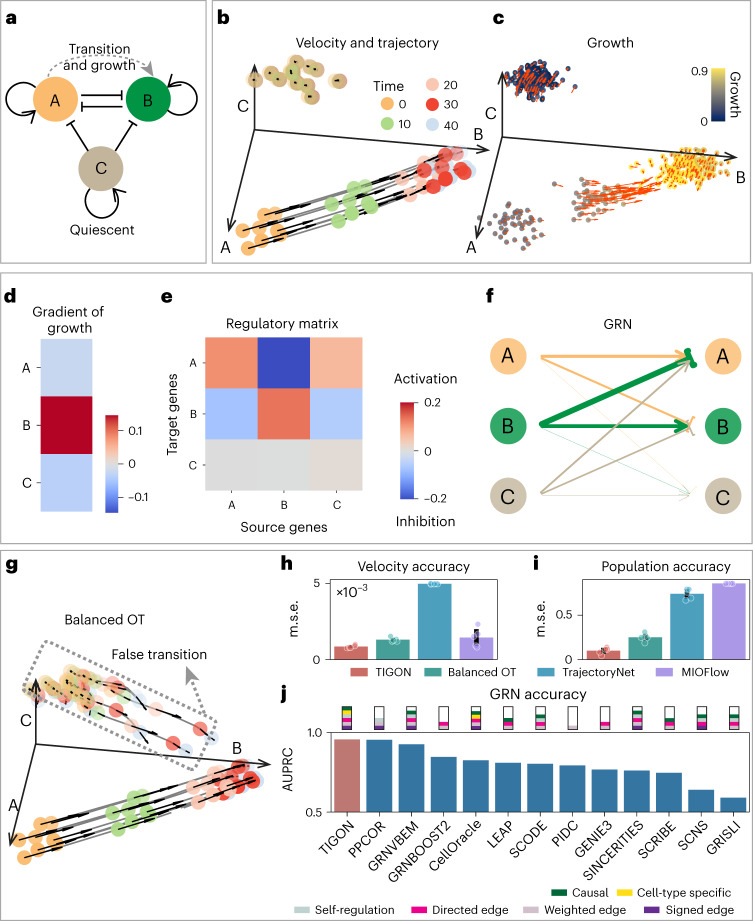
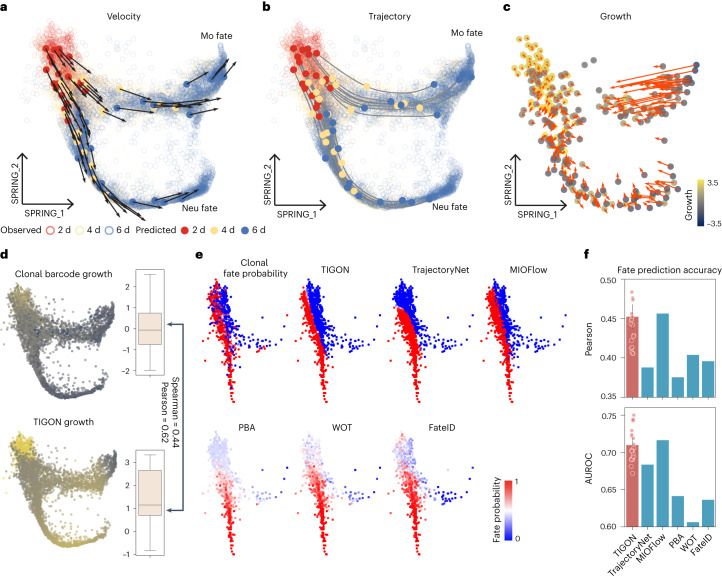
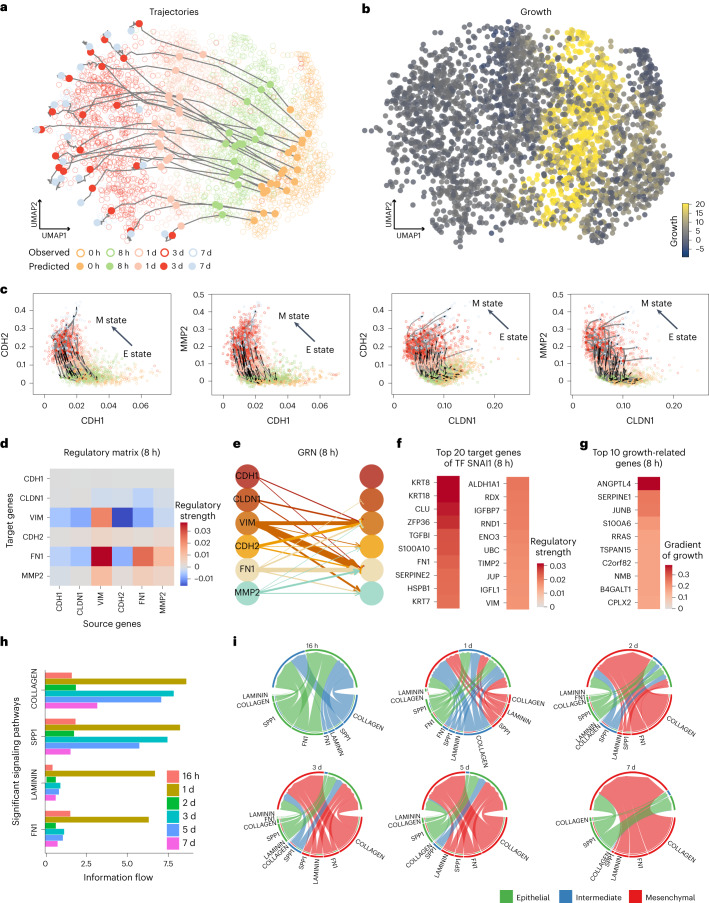
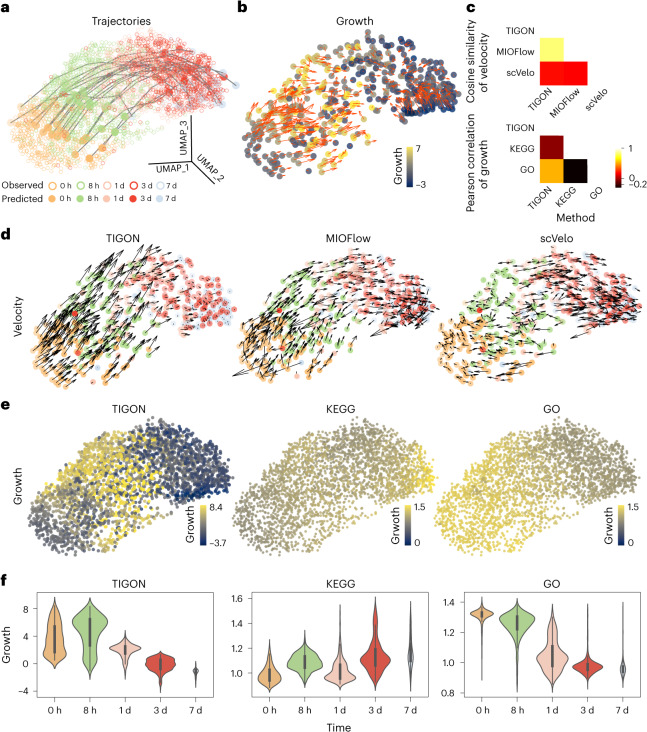
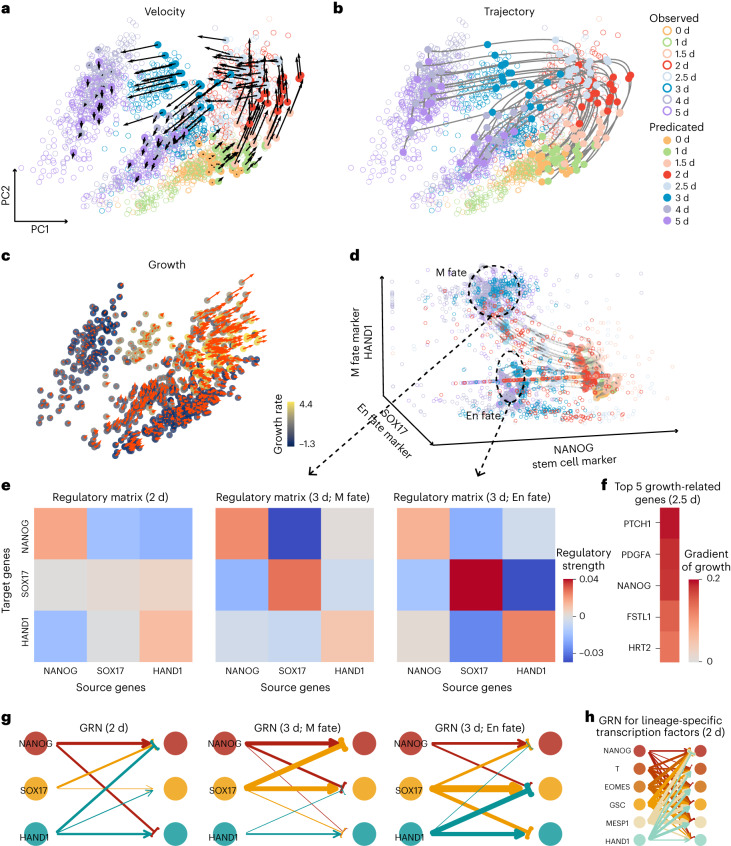
Time-series single-cell RNA sequencing (scRNA-seq) datasets provide unprecedented opportunities to learn dynamic processes of cellular systems. Due to the destructive nature of sequencing, it remains challenging to link the scRNA-seq snapshots sampled at different time points. Here we present TIGON, a dynamic, unbalanced optimal transport algorithm that reconstructs dynamic trajectories and population growth simultaneously as well as the underlying gene regulatory network from multiple snapshots. To tackle the high-dimensional optimal transport problem, we introduce a deep learning method using a dimensionless formulation based on the Wasserstein-Fisher-Rao (WFR) distance. TIGON is evaluated on simulated data and compared with existing methods for its robustness and accuracy in predicting cell state transition and cell population growth. Using three scRNA-seq datasets, we show the importance of growth in the temporal inference, TIGON's capability in reconstructing gene expression at unmeasured time points and its applications to temporal gene regulatory networks and cell-cell communication inference.

Keywords: Data integration; Machine learning.


Conflict of interest statement

Competing interestsThe authors declare no competing interests.

Figures

Fig. 1
Fig. 1. Illustrative diagram of TIGON.
a, Illustrative graph of cell lineage dynamics which involves cell growth, transition and GRNs. b, The continuous cellular dynamics are described by a time-dependent density ρ(x,t). The input of time-series scRNA-seq snapshots generates density ρ at discrete time points. c, The density ρ is governed by a partial differential equation involving velocity v and growth g that are modelled by two neural networks. DL, deep learning. d,e, Outputs and downstream analysis of TIGON. d, Top left, velocity, where each dot represents a cell coloured by collection time and length of arrow denotes the magnitude of the velocity. Top right, trajectory of each cell. Bottom left, gene regulatory matrix of a selected cell or cell type. Bottom right, GRN, where the pointed arrows (blunt arrows) denote positive (negative) regulation from the source gene to the target gene and the width denotes regulatory strength. e, Left, inferred values of growth g are represented by colour. The red arrow denotes the gradient of g with its length corresponding to the magnitude. Right, the gradient of g determines the contributions of genes to the growth changes. Growth-related genes are selected based on those with the largest gradient.
Fig. 2
Fig. 2. TIGON’s performance on three-gene simulated data.
a, Illustrative diagram of the GRN of the three-gene model. b,c, Cellular dynamics for cells sampled at time = 0. b, Velocity and trajectory of cells. For each cell, its velocity is represented by black arrows, and its dynamic trajectory is represented by the grey curve. Here 20 randomly sampled cells from initial density at time = 0 are shown. c, Values of growth and gradient of growth. For each cell, the colour denotes its values of growth, and the red arrow shows its gradient of growth. At each time point, 100 sampled cells are shown. df, Gene analysis for transition cells at time = 5. d, Gradient of growth. e, Regulatory matrix. f, GRN displayed in a form of weighted directed graph. Pointed arrows (blunt arrows) denote the activation (inhibition) from the source gene at the starting point to the target gene at the end point. Width of lines denotes the regulatory strength. g, Velocity and trajectory inference from balanced OT by moving the growth term in TIGON. Identical 20 cells at time = 0 are selected as in b. h,i, Comparisons between TIGON and OT-based trajectory inference methods measured by accuracy in velocity predictions (h), and accuracy in predicting ratio of cell population (i) between transition cells and quiescent cells. The accuracy is measured by the m.s.e. The error bars show one standard deviation above and below the mean for each method from n = 5 independent repeats. Scatter plots show the accuracy from each repeat. j, Comparison of GRN inference methods. GRNs are calculated for transition cells at time = 0, 10, 20, …, 40. Barplots show the average GRN edge classification accuracy over these time points quantified by the area under precision-recall curve (AUPRC). Functionalities of each method are summarized in a rectangular box on the top of the bar.
Fig. 3
Fig. 3. TIGON’s performance on the lineage tracing dataset.
ac, The data is visualized in force-directed layouts (SPRING plots). Cellular dynamics inference for velocity (a), trajectory (b) and growth and gradient of growth (c). a,b, Solid dots are cells predicted by TIGON where 20 cells were initially sampled from the density at day 2 and their snapshots at three time points are shown in different colours. The circles denote all observed cells from the scRNA-seq data. c, A total of 100 cells randomly sampled from densities at each time point for days 2, 4 and 6 are shown. d, Comparison between values of growth at day 2 and day 4 inferred by clonal barcode and TIGON in SPRING plots. Boxplots show distributions of growth for 5,210 cells in a five-number summary, where the centre line shows the median, the upper and lower limits of the box which show the IQR, spanning from the 25th to the 75th percentiles, and upper and lower whiskers show the maximum and the minimum. e, Fate probability for Neu fate estimations for day 2 cells using different methods that are listed from left to right in two rows: clonal fate probability from lineage barcode, TIGON, TrajectoryNet, MIOFlow, population balance analysis (PBA), Waddington-OT (WOT) and FateID. The clonal fate probability is taken as the ground truth for comparison. f, Barplots show accuracy in predicting clonal fate probability using (top) Pearson correlation and (bottom) the AUROC. The error bar for TIGON shows one standard deviation above and below the mean from n = 21 independent repeats. Scatter plots show the accuracy from each repeat.
Fig. 4
Fig. 4. TIGON’s performance on the EMT scRNA-seq dataset.
Results were obtained from a ten-dimensional latent space from AE. a,b, Visualization of TIGON’s outputs on UMAP space. a, Trajectories of 20 cells that are initially sampled from the density at 0 h, where solid dots show their snapshots at five time points. Circles show the observed cells from the scRNA-seq data. b, Values of growth for all observed cells. c, Trajectories and velocity for cells at gene expression space. Identical cells in a are shown in c. d,e, Regulatory matrix (d) and GRN (e) for six EMT marker genes for cells at 8 h. f, Regulatory matrix for top 20 target genes of an EMT TF SNAI1 for cells at 8 h. g, Gradient of growth for top ten growth-related genes for cells at 8 h. h, Barplots of information flow for the four signalling pathways with highest information flow inferred by CellChat. i, Chord diagrams from CellChat for cell–cell communications between epithelial, intermediate and mesenchymal cells at different time points. The inner thinner bar colours represent the targets that receive signal from the corresponding outer bar. The inner bar size is proportional to the signal strength received by the targets.
Fig. 5
Fig. 5. Comparisons of TIGON with trajectory inference or growth inference methods on the EMT scRNA-seq dataset.
Results were obtained from three-dimensional UMAP space. a,b, Visualization of TIGON’s outputs. a, Trajectories of 20 cells that are initially sampled from the density at 0 h, where solid dots show their snapshots at five time points. Circles show the observed cells from the scRNA-seq data. b, Values of growth. At each time point, 100 cells are randomly sampled from the density. c, Comparisons of (top) inferred velocity and (bottom) growth. d, Velocity for all observed cells from the scRNA-seq data inferred by (left) TIGON, (middle) MIOFlow and (right) scVelo. e, Values of growth for all observed cells inferred by (left) TIGON, (middle) KEGG and (right) GO. f, Violin plots for inferred values of growth at different time points: (left) TIGON, (middle) KEGG and (right) GO. The width of the violin plot corresponds to the density of the data, showing a visual representation of the distribution at different growth values. Inside each violin, the white dot shows the median. The thick central bar of the box plot represents the IQR, spanning from the 25th to the 75th percentiles. The thin grey whiskers extend from the IQR to the maximum and minimum values within 1.5 times the IQR. Sample sizes for each time point from day 0 to day 7 are 577, 885, 788, 754 and 129, respectively.
Fig. 6
Fig. 6. TIGON’s performance on the single-cell qPCR iPSC dataset with bifurcation.
ac, Visualization of TIGON’s outputs on first two PCs where TIGON was applied to the first four PCs. a,b, Velocity (a) and trajectories (b) of 20 cells initially sampled from the density at day 0, where solid dots show their snapshots at eight time points. Circles show observed cells from the data. c, Values of growth and gradient of growth. At each time point, 100 cells are randomly sampled from the density. d, Trajectories of cells on gene expression space of three bifurcation marker genes. e, Regulatory metrices for the three marker genes for cells at (left) day 2, (middle) day 3 with M fate and (right) day 3 with En fate. f, Gradient of growth for top five growth-related genes for cells at day 2.5. g, GRNs for the three marker genes for cells at (left) day 2, (middle) day 3 with M fate and (right) day 3 with En fate. h, GRN for lineage-specific transcription factors for cells at day 2.

Similar articles

Cited by

References

    1. Klein AM, et al. Droplet barcoding for single-cell transcriptomics applied to embryonic stem cells. Cell. 2015;161:1187–1201. doi: 10.1016/j.cell.2015.04.044. - DOI - PMC - PubMed
    1. Baron CS, van Oudenaarden A. Unravelling cellular relationships during development and regeneration using genetic lineage tracing. Nat. Rev. Mol. Cell Biol. 2019;20:753–765. doi: 10.1038/s41580-019-0186-3. - DOI - PubMed
    1. Wagner DE, Klein AM. Lineage tracing meets single-cell omics: opportunities and challenges. Nat. Rev. Genet. 2020;21:410–427. doi: 10.1038/s41576-020-0223-2. - DOI - PMC - PubMed
    1. Erhard F, et al. scSLAM-seq reveals core features of transcription dynamics in single cells. Nature. 2019;571:419–423. doi: 10.1038/s41586-019-1369-y. - DOI - PubMed
    1. Battich N, et al. Sequencing metabolically labeled transcripts in single cells reveals mRNA turnover strategies. Science. 2020;367:1151–1156. doi: 10.1126/science.aax3072. - DOI - PubMed