. 2024 Jan 11:14:1322548.
doi: 10.3389/fmicb.2023.1322548. eCollection 2023.

Seasonal and spatial variations of Synechococcus in abundance, pigment types, and genetic diversity in a temperate semi-enclosed bay

Affiliations

Seasonal and spatial variations of Synechococcus in abundance, pigment types, and genetic diversity in a temperate semi-enclosed bay

Suheng Li et al. Front Microbiol. .

Abstract

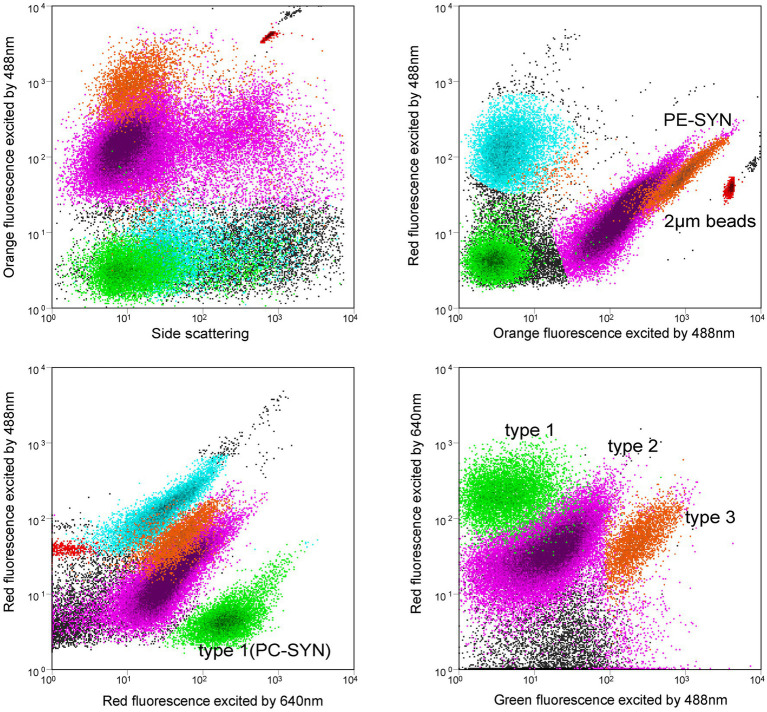
Synechococcus is abundant and globally widespread in various marine environments. Seasonal and spatial variations in Synechococcus abundance, pigment types, and genetic diversity were investigated based on flow cytometric analysis and high-throughput sequencing of cpcBA operon (encoding phycocyanin) and rpoC1 gene (encoding RNA polymerase) in a temperate semi-enclosed bay. Synechococcus abundance exhibited seasonal variations with the highest value in summer and the lowest value in winter, which was consistent with temperature variation. Three pigment types of Synechococcus type 1, type 2, and type 3 were distinguished based on cpcBA operon, which displayed obvious variations spatially between the inner and the outer bay. Freshwater discharge and water turbidity played important roles in regulating Synechococcus pigment types. Synechococcus assemblages were phylogenetically diverse (12 different lineages) based on rpoC1 gene and dominated by three core lineages S5.1-I, S5.1-IX, and S5.2-CB5 in different seasons. Our study demonstrated that Synechococcus abundance, pigment types, and genetic diversity displayed variations seasonally and spatially by different techniques, which were mainly driven by temperature, salinity, nutrients, and turbidity. The combination of more technical means provides more information for studying Synechococcus distribution. In this study, three pigment types of Synechococcus were discriminated simultaneously by dual lasers flow cytometer for the first time.

Keywords: Synechococcus; co-dominate; cpcBA operon; genetic diversity; pigment types; rpoC1 gene; temperate semi-enclosed bay.


Conflict of interest statement

The authors declare that the research was conducted in the absence of any commercial or financial relationships that could be construed as a potential conflict of interest.

Figures

Figure 1
Figure 1
Sampling stations in Jiaozhou Bay. Stations A5 and C1 are inner bay and station D7 is outer bay.
Figure 2
Figure 2
Flow cytometric signatures of type 1, type 2, and type 3 Synechococcus using a flow cytometer with 488 nm and 640 nm dual lasers. Orange fluorescence represents phycoerythrin (PE); Red fluorescence excited by 488 nm laser indicates chlorophyll a, and red fluorescence excited by 640 nm comes from phycocyanin (PC). Note that PUB-containing cells (type 3) have relatively higher green fluorescence than the non-PUB-containing cells (type 2).
Figure 3
Figure 3
Spatial and seasonal variations of environment parameters (A): temperature, (B): salinity, (C): Chl a, (D): suspended particulate matter, (E): NO3, (F): NO2, (G): NH4+, (H): PO43− in Jiaozhou Bay. The data of suspended particulate matter was missing in October.
Figure 4
Figure 4
Synechococcus abundance measured by flow cytometric analysis.
Figure 5
Figure 5
Results of UPGMA cluster analysis. Synechococcus pigment composition based on the relative abundance of each Synechococcus pigment type. The samples formed two groups, inner and outer.
Figure 6
Figure 6
Maximum likelihood phylogenetic tree of the 50 most abundant rpoC1 OTUs across all samples. The heatmap on the right-hand side shows the relative abundance of OTUs in each library (Log transformed). Only nodes with bootstrap values higher than 50% are shown.
Figure 7
Figure 7
Results of UPGMA cluster analysis. Synechococcus assemblages composition based on the relative abundance of each Synechococcus lineage. The samples formed four groups, Group 1, Group 2, Group 3, and Group 4 (A). The trends in the relative abundance of dominant lineages S5.1-I, S5.1-IX, and S5.2-CB and typical environmental factors-T, S, Chl a, NO2, NH4+ in the above four groups. The data in each group is the average of the total sample data in the corresponding group. T, temperature; S, salinity (B).
Figure 8
Figure 8
RDA analysis. (A) The relationship between the distribution of Synechococcus pigment types (cpcBA) and environmental factors in Jiaozhou Bay. (B) The relationship between the distribution of Synechococcus lineages (rpoC1) and environmental factors in Jiaozhou Bay.

References

    1. Agawin N. S. R., Duarte C. M., Agusti S. (1998). Growth and abundance of Synechococcus sp. in a Mediterranean Bay: seasonality and relationship with temperature. Mar. Ecol.-Prog. Ser. 170, 45–53. doi: 10.3354/meps170045 - DOI
    1. Amato K. R., Yeoman C. J., Kent A., Righini N., Carbonero F. (2013). Habitat degradation impacts black howler monkey (Alouatta pigra) gastrointestinal microbiomes. ISME J. 7, 1344–1353. doi: 10.1038/ismej.2013.16, PMID: - DOI - PMC - PubMed
    1. Cai H., Wang K., Huang S., Jiao N., Chen F. (2010). Distinct patterns of Picocyanobacterial communities in winter and summer in the Chesapeake Bay. Appl. Environ. Microbiol. 76, 2955–2960. doi: 10.1128/AEM.02868-09, PMID: - DOI - PMC - PubMed
    1. Chen F., Wang K., Kan J., Bachoon D., Lu J. (2004). Phylogenetic diversity of Synechococcus in the Chesapeake Bay revealed by Ribulose-1,5-bisphosphate carboxylase-oxygenase (RuBisCO) large subunit gene (rbcL) sequences. Aquat. Microb. Ecol. 36, 153–164. doi: 10.3354/ame036153 - DOI
    1. Chen F., Wang K., Kan J. J., Suzuki M. T. (2006). Diverse and unique picocyanobacteria in Chesapeake Bay, revealed by 16S-23S rRNA internal transcribed spacer sequences. Appl. Environ. Microbiol. 72, 2239–2243. doi: 10.1128/AEM.72.3.2239-2243.2006, PMID: - DOI - PMC - PubMed

LinkOut - more resources