Comment
. 2024 Jan 11:14:1289774.
doi: 10.3389/fimmu.2023.1289774. eCollection 2023.

DEK deficiency suppresses mitophagy to protect against house dust mite-induced asthma

Affiliations
Comment

DEK deficiency suppresses mitophagy to protect against house dust mite-induced asthma

Qiaoyun Bai et al. Front Immunol. .

Abstract

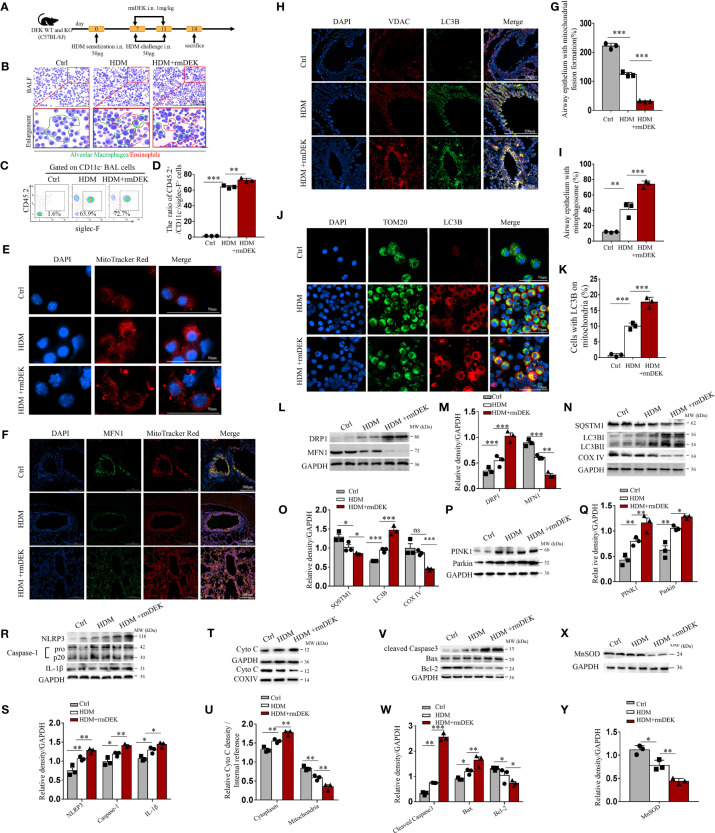
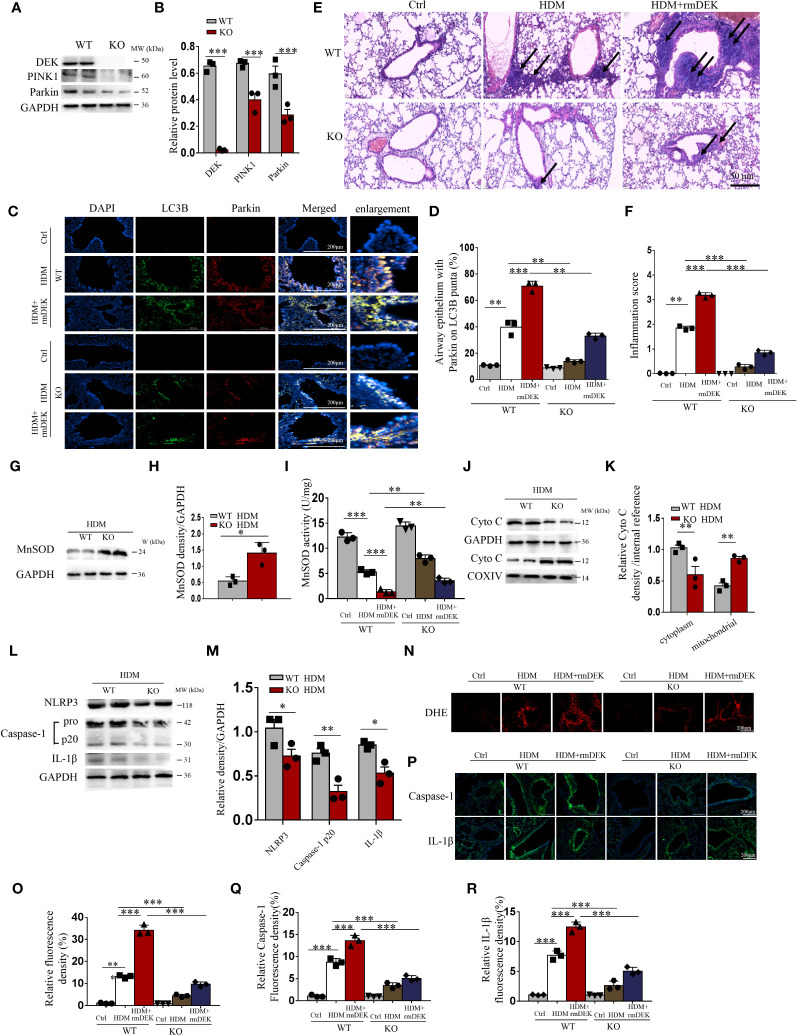
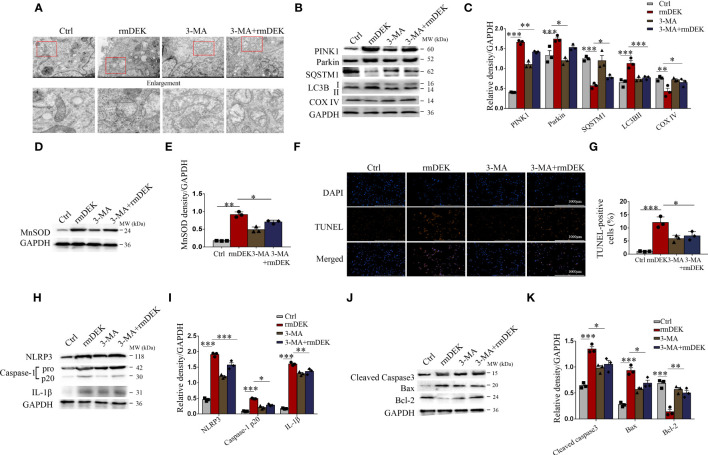
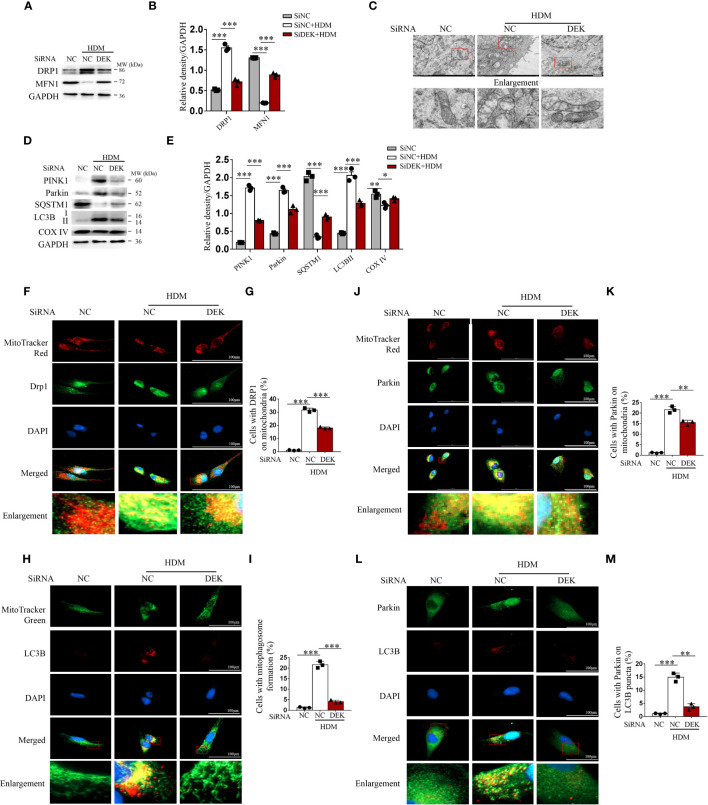
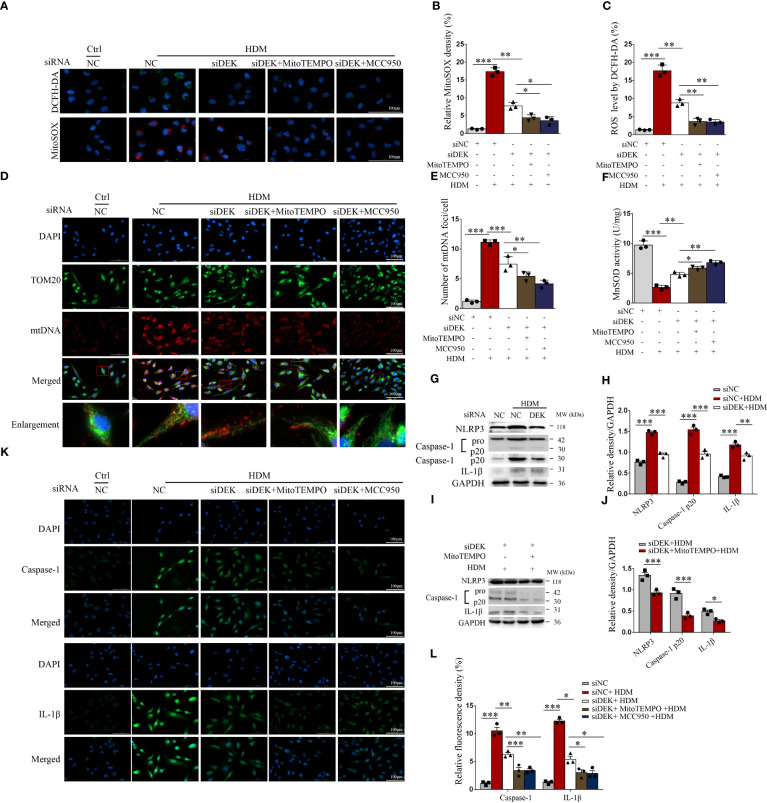
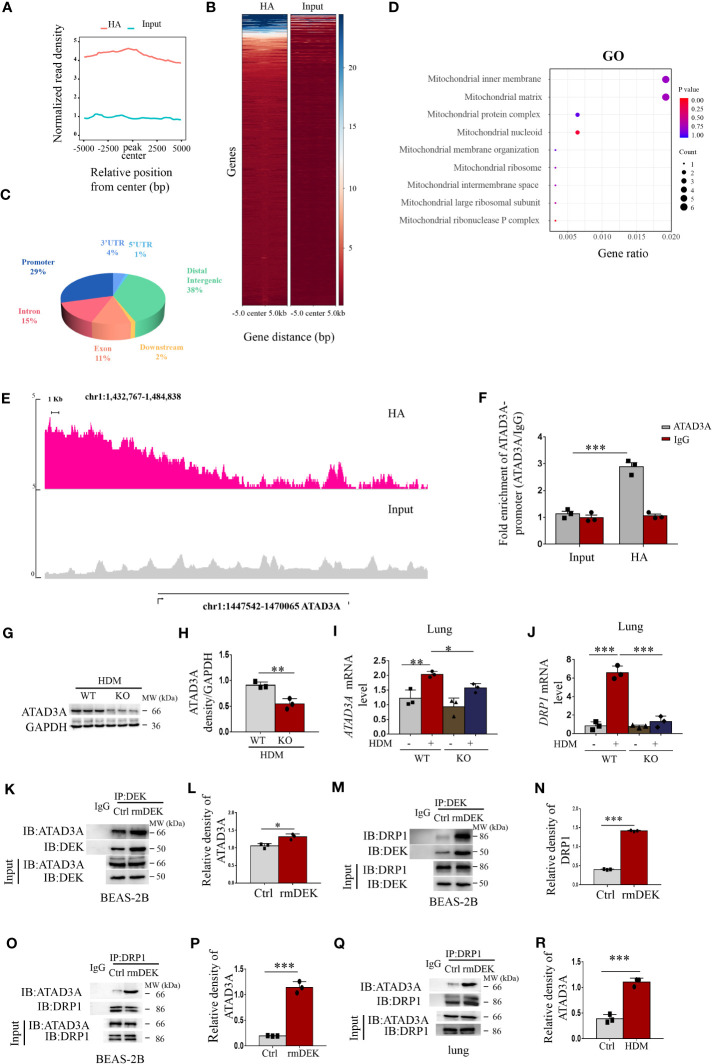
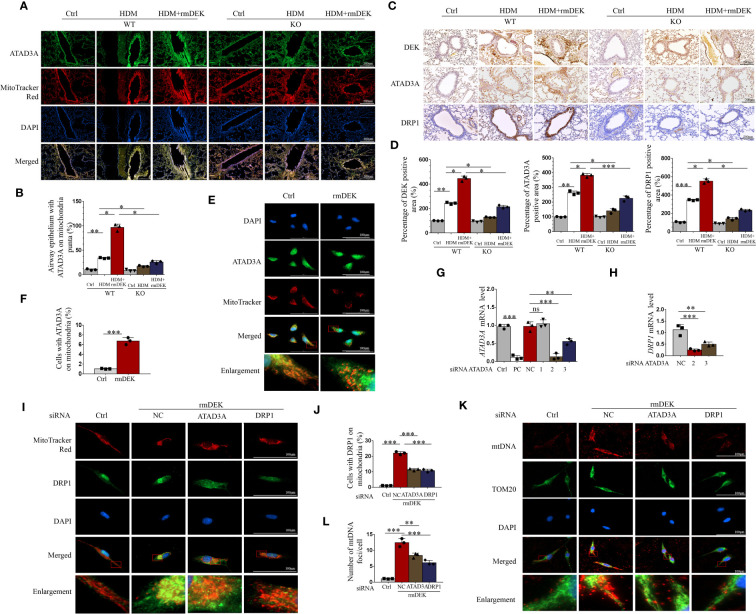
DEK protein is highly expressed in asthma. However, the mechanism of DEK on mitophagy in asthma has not been fully understood. This study aims to investigate the role and mechanism of DEK in asthmatic airway inflammation and in regulating PINK1-Parkin-mediated mitophagy, NLRP3 inflammasome activation, and apoptosis. PINK1-Parkin mitophagy, NLRP3 inflammasome, and apoptosis were examined after gene silencing or treatment with specific inhibitors (MitoTEMPO, MCC950, and Ac-DEVD-CHO) in house dust mite (HDM) or recombinant DEK (rmDEK)-induced WT and DEK-/- asthmatic mice and BEAS-2B cells. The regulatory role of DEK on ATAD3A was detected using ChIP-sequence and co-immunoprecipitation. rmDEK promoted eosinophil recruitment, and co-localization of TOM20 and LC3B, MFN1 and mitochondria, LC3B and VDAC, and ROS generation, reduced protein level of MnSOD in HDM induced-asthmatic mice. Moreover, rmDEK also increased DRP1 expression, PINK1-Parkin-mediated mitophagy, NLRP3 inflammasome activation, and apoptosis. These effects were partially reversed in DEK-/- mice. In BEAS-2B cells, siDEK diminished the Parkin, LC3B, and DRP1 translocation to mitochondria, mtROS, TOM20, and mtDNA. ChIP-sequence analysis showed that DEK was enriched on the ATAD3A promoter and could positively regulate ATAD3A expression. Additionally, ATAD3A was highly expressed in HDM-induced asthma models and interacted with DRP1, and siATAD3A could down-regulate DRP1 and mtDNA-mediated mitochondrial oxidative damage. Conclusively, DEK deficiency alleviates airway inflammation in asthma by down-regulating PINK1-Parkin mitophagy, NLRP3 inflammasome activation, and apoptosis. The mechanism may be through the DEK/ATAD3A/DRP1 signaling axis. Our findings may provide new potential therapeutic targets for asthma treatment.

Keywords: DEK; NLRP3 inflammasome; PINK1-Parkin; asthma; mitophagy.


Conflict of interest statement

The authors declare that the research was conducted in the absence of any commercial or financial relationships that could be construed as a potential conflict of interest.

Figures

Figure 1
Figure 1
DEK protein induced mitophagy, NLRP3 inflammasome, and apoptosis. (A) Schematic diagram of asthma model establishment and rmDEK administration. (B) Diff-Quick staining of BAL cells. The red circle indicates eosinophils and the green circle indicates macrophages. Scale bar = 200 μm. (C, D) Flow cytometry analysis of CD45.2+CD11c-siglec-F+ cells (eosinophils) and their percentages in BAL cells. (E) MitoTracker Red staining of BAL cells to observe mitochondrial morphology. Scale bar = 50 μm. (F, G) Representative images and quantification of immunofluorescence of MFN1 and MitoTracker Red. (H, I) LC3B and VDAC in airway epithelial cells. Scale bar: 200 μm. (J, K) LC3B and TOM20 in BAL cells. Scale bar = 50 μm. Western blot analysis and quantification of (L–Q) COX IV, SQSTM1, LC3B I/II, MFN1 , DRP1,PINK1 and Parkin. (R, S) caspase-1, IL-1β, and NLRP3; (T, U) cytoplasmic and mitochondrial Cytochrome c; (V, W) Cleaved caspase-3, Bax, and, Bcl-2; and, (X, Y) MnSOD in mouse lung tissues. Data were presented as mean ± SEM. n=3. ns; no statistical difference, *p<0.05, **p<0.01, ***p<0.001.
Figure 2
Figure 2
DEK−/− downregulated PINK1-Parkin-mediated mitophagy. (A, B) Western blot analysis and quantification of PINK1, DEK, and Parkin in lung tissue from DEK wild type (WT) and DEK knockout mice. (C, D) Representative images and quantification of immunofluorescence labeling of LC3B and Parkin. Scale bar = 200 μm. (E) HE staining of lung tissues. The arrows indicate the infiltration of inflammatory cells. Scale bar = 50 μm. (F) Inflammatory score (G–I) Quantification of MnSOD in lung tissue by Western blot and ELISA. Western blot analysis of cytoplasmic and mitochondrial Cytochrome c (J, K) as well as NLRP3, caspase-1, and IL-1β of mouse lungs (L, M). (N, O) Fluorescence measurement of ROS around the airway using DCFH-DA. Scale bar = 200 μm. (P–R) Immunofluorescence staining images and quantification of airway caspase-1 and IL-1β. Scale bar = 200 μm. Data were presented as mean ± SEM. n=3. *p<0.05, **p<0.01, ***p<0.001.
Figure 3
Figure 3
Activation effects of DEK on mitophagy, NLRP3 inflammasome, and apoptosis in BEAS-2B cells. BEAS-2B cells were pretreated with 3-MA (5 mM) for 4 h and then incubated with rmDEK (1 μg/ml) for 24 h. (A) Mitochondrial morphology was observed by transmission electron microscopy. Scale bar = 2 μm. (B–E) Western blot analysis and quantification of COX IV, SQSTM1, LC3B I/II, PINK1, Parkin, and MnSOD. (F, G) Representative images and quantification of TUNEL staining in BEAS-2B cells. Scale bar = 1000 μm. (H–K) Western blot analysis and quantification of caspase-1, NLRP3, IL-1β, Cleaved caspase-3, Bax, and Bcl-2. Data were presented as mean ± SEM. n=3. *p<0.05, **p<0.01, ***p<0.001.
Figure 4
Figure 4
Silencing DEK decreased HDM-induced mitophagy in BEAS-2B cells. The siDEK and negative control siNC were transfected into BEAS-2B cells for 24 h and then treated with HDM (200 μg/mL) for 24 h. (A, B) Western blot analysis and quantification of DRP1 and MFN1. (C) Mitochondrial morphology was observed by transmission electron microscopy. Scale bar = 2 μm. (D, E) Western blot analysis and quantification of PINK1, Parkin, SQSTM1, LC3B I/II, and COX IV. Representative images and quantification of immunofluorescence labeling of DRP1 and MitoTracker Red (F, G); LC3B I/II and MitoTracker Green (H, I); Parkin and MitoTracker Red (J, K); and, LC3BI/II and Parkin (L, M). Data were presented as mean ± SEM. n=3. *p<0.05, **p<0.01, ***p<0.001.
Figure 5
Figure 5
Silencing DEK reduced mitochondrial ROS production and suppressed NLRP3 inflammasome. BEAS-2B cells were transfected with siDEK and negative control siNC for 24 h. Then, the cells were pretreated with MitoTEMPO (10 μM) or MCC950 (10 μM) for 4 h followed by incubating with DMEM containing HDM (200 μg/mL) for 24 h. (A–C) Immunofluorescence showed fluorescence intensity of DCFH-DA and mitochondrial ROS (MitoSOX). (D, E) Double-labeling of TOM20 and mtDNA. Scale bar = 100 μm. (F) MnSOD activity (U/mg) was assessed using ELISA. Western blot analysis and quantification of NLRP3, caspase-1, and IL-1β in cells incubated with HDM following siNC and siDEK (G, H); and NLRP3, caspase-1, and IL-1β in cells stimulating HDM pretreated with or without MitoTEMPO after siDEK (I, J). (K, L) Immunofluorescence staining and quantification of caspase-1 and IL-1β in BEAS-2B cells. Scale bar = 100 μm. Data were presented as mean ± SEM. n=3. *p<0.05, **p<0.01, ***p<0.001.
Figure 6
Figure 6
DEK regulated DRP1 via ATAD3A. ChIP-Seq was performed on the control (Input) and DEK overexpressing BEAS-2B cells (HA). (A) Peak density histograms following ChIP-Seq. (B) Heat map of peak density. (C) Statistics of the distribution of the peak region, such as 3′ UTR, 5′ UTR, Distal Intergenic, Downstream, Exon, Intron, Promoter, etc. (D) Gene Ontology enrichment analysis after screening using the keyword of mitochondria. (E) Peak density of ATAD3A. (F) ChIP-quantitative real-time PCR analysis of ATAD3A mRNA levels. (G, H) Western blot analysis and quantification of ATAD3A in lung tissue of DEK wild type (WT) and DEK knockout (KO) mice pretreated with HDM. (I) The expression of ATAD3A mRNA level and (J) DRP1 mRNA level in lung tissue. Western blot analysis of ATAD3A, DRP1. and DEK after co-immunoprecipitation in BEAS-2B cells (K–N). Western blot analysis of ATAD3A and DRP1 after co-immunoprecipitation in BEAS-2B cells (O, P) and lung tissues (Q, R). Data were presented as mean ± SEM. n=3. *p<0.05, **p<0.01, ***p<0.001.
Figure 7
Figure 7
Silencing ATAD3A down-regulated HDM and DEK protein induced DRP1 expression and mitochondrial DNA damage. (A) Immunofluorescence showing the co-localization of ATAD3A and MitoTracker Red in lung tissues from DEK wild type (WT) and DEK knockout mice induced by HDM or HDM+rmDEK. (B) The intensity of mitochondrial ATAD3A puncta was calculated with Image (J) Scale bar = 200 μm. (C) Immunohistochemical staining of DEK, ATAD3A, and DRP1 in lung sections of mice. Scale bar = 200 μm. (D) The intensity of DEK, ATAD3A, and DRP1 was quantified with Image (J). (E) Immunofluorescence showing the co-localization of ATAD3A and MitoTracker Red in BEAS-2B cells pretreated with rmDEK. (F) The intensity of mitochondrial ATAD3A puncta was calculated with Image (J) Scale bar = 100 μm. (G) Expression of ATAD3A mRNA levels in BEAS-2B cells transfected with positive control siRNA (siPC), negative control siRNA (siNC), and siATAD3A 1, 2, and 3 for 24 h. (H) Expression of DRP1 mRNA levels in BEAS-2B cells transfected with negative control siNC, siATAD3A, and siATAD3A 3 for 24 h. (I, J) Immunofluorescence showing the co-localization of DRP1 and MitoTracker Red in BEAS-2B cells treated with rmDEK (1 μg/mL) for 24 h after transfection with negative controls siNC, siATAD3A and siDRP1. Scale bar = 100 μm; (K, L) Immunofluorescence staining of TOM20 and mtDNA. Data were presented as mean ± SEM. n=3. ns=no statistical difference, *p<0.05, **p<0.01, ***p<0.001.

Comment on

Similar articles

Cited by

References

    1. Menzies-Gow A, Moore WC, Wechsler ME. Difficult-to-control asthma management in adults. J Allergy Clin Immunol In Pract (2022) 10(2):378–84. doi: 10.1016/j.jaip.2021.12.007 - DOI - PubMed
    1. Papi A, Brightling C, Pedersen SE, Reddel HK. Asthma. Lancet (2018) 391(10122):783–800. doi: 10.1016/s0140-6736(17)33311-1 - DOI - PubMed
    1. Prakash YS, Pabelick CM, Sieck GC. Mitochondrial dysfunction in airway disease. Chest (2017) 152(3):618–26. doi: 10.1016/j.chest.2017.03.020 - DOI - PMC - PubMed
    1. Chong L, Li H, Zhu L, Yu G. Regulatory effect of mitoq on the Mtros-Nlrp3 inflammasome pathway in leptin-pretreated beas-2 cells. Exp Ther Med (2021) 21(5):466. doi: 10.3892/etm.2021.9897 - DOI - PMC - PubMed
    1. Agache I, Lau S, Akdis CA, Smolinska S, Bonini M, Cavkaytar O, et al. . Eaaci guidelines on allergen immunotherapy: house dust mite-driven allergic asthma. Allergy (2019) 74(5):855–73. doi: 10.1111/all.13749 - DOI - PubMed

Publication types

MeSH terms