. 2024 Jan 11:14:1328533.
doi: 10.3389/fimmu.2023.1328533. eCollection 2023.

HLA-DPB1 genotype variants predict DP molecule cell surface expression and DP donor specific antibody binding capacity

Affiliations

HLA-DPB1 genotype variants predict DP molecule cell surface expression and DP donor specific antibody binding capacity

Yuxin Yin et al. Front Immunol. .

Abstract

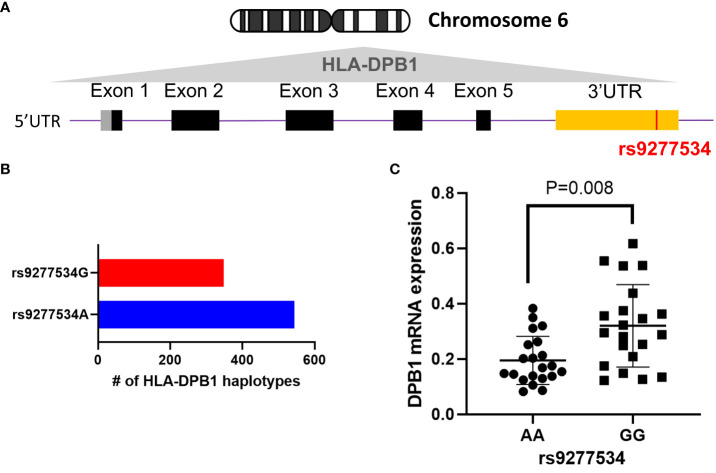
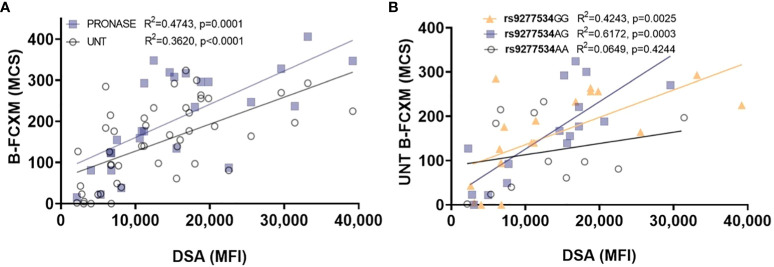
The contribution of alloresponses to mismatched HLA-DP in solid organ transplantation and hematopoietic stem cell transplantation (HCT) has been well documented. Exploring the regulatory mechanisms of DPB1 alleles has become an important question to be answered. In this study, our initial investigation focused on examining the correlation between the rs9277534G/A SNP and DPB1 mRNA expression. The result showed that there was a significant increase in DPB1 mRNA expression in B lymphoblastoid cell lines (BLCLs) with the rs9277534GG genotype compared to rs9277534AA genotype. In addition, B cells with the rs9277534GG exhibited significantly higher DP protein expression than those carrying the rs9277534AA genotype in primary B cells. Furthermore, we observed a significant upregulation of DP expression in B cells following treatment with Interleukin 13 (IL-13) compared to untreated B cells carrying rs9277534GG-linked DPB1 alleles. Fluorescence in situ hybridization (FISH) analysis of DPB1 in BLCL demonstrated significant differences in both the cytoplasmic (p=0.0003) and nuclear (p=0.0001) localization of DP mRNA expression comparing DPB1*04:01 (rs9277534AA) and DPB1*05:01 (rs9277534GG) homozygous cells. The study of the correlation between differential DPB1 expression and long non-coding RNAs (lncRNAs) showed that lnc-HLA-DPB1-13:1 is strongly associated with DP expression (r=0.85), suggesting the potential involvement of lncRNA in regulating DP expression. The correlation of DP donor specific antibody (DSA) with B cell flow crossmatch (B-FCXM) results showed a better linear correlation of DP DSA against GG and AG donor cells (R2 = 0.4243, p=0.0025 and R2 = 0.6172, p=0.0003, respectively), compared to DSA against AA donor cells (R2 = 0.0649, p=0.4244). This explained why strong DP DSA with a low expression DP leads to negative B-FCXM. In conclusion, this study provides evidence supporting the involvement of lncRNA in modulating HLA-DP expression, shedding lights on the intricate regulatory mechanisms of DP, particularly under inflammatory conditions in transplantation.

Keywords: HLA-DPB1; crossmatch; hematopoietic stem cell transplantation; long non-coding RNA; rs9277534; transplantation.


Conflict of interest statement

The authors declare that the research was conducted in the absence of any commercial or financial relationships that could be construed as a potential conflict of interest.

Figures

Figure 1
Figure 1
The rs9277534 SNP A or G is linked HLA-DPB1. (A) The schematic representation of the HLA-DPB1 allele within Chromosome 6 HLA region (6p21.1-21.3) is shown. The bottom panel illustrates DPB1 genomic structure, with black boxes denoting coding exons, gray and yellow boxes indicating 5’ and 3’ UTR, respectively. The purple line connecting the boxes represents introns, and the SNP (rs9277534, located in the 3’UTR) is highlighted in red. (B) The number of full genomic HLA-DPB1 haplotypes, containing the rs9277534 SNP, from IMGT/HLA database v3.54. rs9277534 has two groups (rs9277534A and rs9277534G) linked to HLA-DPB1. (C) Examination of the HLA DPB1 expression in 14 BLCLs. Both alleles linked to either rs9277534A or rs9277534G were used for each cell line. HLA-DPB1 mRNA expression was determined through a qRT-PCR assay with experiments involving triplicates. GAPDH served as endogenous control, and the scatter dot plot displays mean standard deviation (SD).
Figure 2
Figure 2
Examining the correlation between DP DSA and B-FCXM. (A) The correlation of DP DSA MFI on B-FCXM with and without pronase (UNT) treatment. (B) A robust linear correlation in B-FCXM with DP DSA against rs9277534GG and AG donor cells, whereas such correlation is not observed in cells with rs9277534AA. MCS, median channel shift.
Figure 3
Figure 3
Induction of cell surface expression by IL-13 cytokine. (A) IL-13 induced HLA class II cell surface expression. PBMCs were cultured with IL-13 (100ng/mL) for 48 hours, and cells stained with anti HLA-II antibodies were gated out of PBMCs. (B) IL-13 induced HLA DP cell surface expression on PBMCs. The combinations of AA, AG, and GG represent the two DPB1 alleles present in each donor cell, linked to the rs9277534 SNP. Only p values of < 0.05, considered statistically significant, are marked. The scatter dot plot presents mean SD.
Figure 4
Figure 4
FISH of DPB1 was conducted on BLCLs to assess the expression of DPB1 mRNA in cellular compartments. Two high-frequency HLA-DPB1 alleles were chosen for the primary test, with one BLCL being homozygous for DPB1*04:01 linked to rs9277534AA and the other homozygous for DPB1*05:01 linked to rs9277534GG. (A) Representative RNA FISH images of DPB1*04:01 (Cyan) and DPB1*05:01 (Magenta) RNA in BLCLs, with DAPI staining the nucleus (Blue). (B) The Box plot showing cytoplasmic and nuclear FISH counts for DPB1*04:01 and DPB1*05:01. The prefixes “cyto-” and “nuc-” denote the cytoplasmic and nuclear compartments, respectively, within a cell fraction.
Figure 5
Figure 5
Exploring the potential involvement of lncRNAs in HLA-DPB1 regulation. (A) A schematic representation illustrates the genomic location of lncRNAs (lnc-HLA-DPB1-13:1, lnc-HLA-DPB1-13:2, and lnc-HLA-DPB1-14:1) in relation to HLA-DPB1 on Chromosome 6 (hg38). The blue box highlights the location of lncRNAs, and the blue gene structure represents HLA-DPB1. The arrow indicates the direction of the lncRNA transcript, and splicing is denoted by a light gray line. (B–D) Comparative analysis of lncRNA expression between rs9277534A and G-linked HLA-DPB1. Experiments were conducted in triplicates, with GAPDH as the endogenous control. The scatter dot plot displays mean SD. (E) The correlation between lncRNA expression and HLA-DPB1. The correlation coefficient ranges between 0.8 and 1, indicating a very strong positive association, while a coefficient between 0.2 and 0.6 suggests a moderate to weak positive association.

References

    1. Klein J, Sato A. The HLA system. First of two parts. N Engl J Med (2000) 343(10):702–9. doi: 10.1056/NEJM200009073431006 - DOI - PubMed
    1. Klein J, Sato A. The HLA system. Second of two parts. N Engl J Med (2000) 343(11):782–6. doi: 10.1056/NEJM200009143431106 - DOI - PubMed
    1. Mosaad YM. Clinical role of human leukocyte antigen in health and disease. Scand J Immunol (2015) 82(4):283–306. doi: 10.1111/sji.12329 - DOI - PubMed
    1. Hickey MJ, Valenzuela NM, Reed EF. Alloantibody generation and effector function following sensitization to human leukocyte antigen. Front Immunol (2016) 7:30. doi: 10.3389/fimmu.2016.00030 - DOI - PMC - PubMed
    1. Patel R, Terasaki PI. Significance of the positive crossmatch test in kidney transplantation. New Engl J Med (1969) 280(14):735–9. doi: 10.1056/NEJM196904032801401 - DOI - PubMed