. 2024 Feb 28;146(8):5195-5203.
doi: 10.1021/jacs.3c11152. Epub 2024 Jan 26.

Intrinsic Burst-Blinking Nanographenes for Super-Resolution Bioimaging

Affiliations

Intrinsic Burst-Blinking Nanographenes for Super-Resolution Bioimaging

Xingfu Zhu et al. J Am Chem Soc. .

Abstract

Single-molecule localization microscopy (SMLM) is a powerful technique to achieve super-resolution imaging beyond the diffraction limit. Although various types of blinking fluorophores are currently considered for SMLM, intrinsic blinking fluorophores remain rare at the single-molecule level. Here, we report the synthesis of nanographene-based intrinsic burst-blinking fluorophores for highly versatile SMLM. We image amyloid fibrils in air and in various pH solutions without any additive and lysosome dynamics in live mammalian cells under physiological conditions. In addition, the single-molecule labeling of nascent proteins in primary sensory neurons was achieved with azide-functionalized nanographenes via click chemistry. SMLM imaging reveals higher local translation at axonal branching with unprecedented detail, while the size of translation foci remained similar throughout the entire network. These various results demonstrate the potential of nanographene-based fluorophores to drastically expand the applicability of super-resolution imaging.


Conflict of interest statement

The authors declare the following competing financial interest(s): X. Liu, A. Narita, Q. Chen, S. Parekh, C. Cremer, K. Land-fester, K. Mllen, and M. Bonn are listed as inventors on a patent (PCT/EP2019/076496, WO2020070085) and Q. Chen, A. Narita, K. Mllen, S. Parken, M. Bonn and X. Liu are listed as inventors on a patent (PCT/EP2019/076497, WO 2020070086) related to the work presented in this manuscript. All other authors have nothing to disclose.

Figures

Figure 1
Figure 1
Synthesis and optical characterization of DBOV-OTEG. (a) Chemical structure and synthesis of DBOV-OTEG. (b) UV–vis absorption and emission spectra of DBOV-OTEG in aqueous solution. (c) Single-molecule fluorescence time trace of DBOV-OTEG in PBS solution. (d) Histogram of detected photons per switching event and single-exponential fit of DBOV-OTEG in PBS solution. (e) On–off duty cycle of DBOV-OTEG in PBS solution. (f) Detected photons per switching event of DBOV-OTEG in solutions of various pH.
Figure 2
Figure 2
SMLM images of amyloid fibrils labeled with DBOV-OTEG in air and various pH solutions. (a) Reconstructed SMLM image of amyloid fibrils labeled with DBOV-OTEG from 15,000 frames in air. Inset: bright-field image of amyloid fibrils. (b) Magnification of yellow box (top) and the corresponding conventional wide-field fluorescence image (bottom). (c) Cross-line profiles of localization, corresponding regions lined in yellow in (b). (d) Distribution of photon counts per single switching event at 50 ms exposure time in air, with its average value. (e) Distribution of localization precision per single switching event at 50 ms exposure time in air, with its average value. (f) Reconstructed SMLM image of amyloid fibrils from 15,000 frames in various pH solutions. (g) Distribution of photon counts per single switching event at 50 ms exposure time in various pH solutions, with their average values. (h) Distribution of localization precision per single switching event at 50 ms exposure time in various pH solutions, with their average values.
Figure 3
Figure 3
SMLM imaging of lysosomes with DBOV-OTEG in live U2OS cells. (a) Colocalization of DBOV-OTEG and LysoTracker Green. (b) Conventional wide-field fluorescence image of lysosomes and corresponding SMLM image of lysosomes. SMLM imaging was performed in DMEM (supplement 10% FBS) at room temperature, with 642 nm laser of 1 kW/cm2 and 23 ms per frame. A total of 6,500 frames were acquired to reconstruct the SMLM image. (c) Time sequence super-resolution images of lysosomes at 30, 60, 90, 120, and 150 s. Three lysosomes were selected in (b), and corresponding SMLM images were reconstructed every 30 s. Scale bars: 20 μm for (a), 5 μm for (b), and 200 nm for (c).
Figure 4
Figure 4
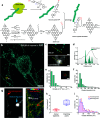
SMLM imaging of global nascent proteins labeled with DBOV-azide in DRG neurons. (a) Reaction schematic illustrating the synthesis of DBOV-azide and the labeling of global nascent proteins in neurons via click chemistry. (b) Reconstructed SMLM image of global nascent proteins in neurons. Imaging was performed in PBS solution. (c) Magnification of SMLM image and conventional wide-field fluorescence image for the yellow box region in (b), respectively. (d) Cross-line profiles of SMLM image and conventional wide-field fluorescence image lined in yellow in (c). (e) Distribution of the first-rank density (single-molecule localizations/μm2) of global nascent proteins in (b). The inset shows one representative protein cluster by the Voronoi diagram segment (the red line is the estimated outline of this protein cluster). (f) Cluster size distribution for global nascent proteins in (b) (∼2900 clusters). (g) Conventional wide-field fluorescence image of networks in neurons (left) and corresponding Voronoi diagram image (right) of the same position. The red arrow in (g) (left) indicates the linear axon, and the light blue arrow in (g) (left) shows the branching point (intersection between multiple axons). The white arrow in (g) (right) indicates one puncta in linear axon in reconstructed SMLM image. (h) Number of puncta (cluster)/μm2 of axonal segments and branching points in neuron networks. (i) Cluster size distribution of axonal segments and branching points in neuron networks. Scale bar: 5 μm for (b), 1 μm for (g), 200 nm for (c), 50 nm for (e).

References

    1. Sahl S. J.; Hell S. W.; Jakobs S. Fluorescence Nanoscopy in Cell Biology. Nat. Rev. Mol. Cell Biol. 2017, 18 (11), 685–701. 10.1038/nrm.2017.71. - DOI - PubMed
    1. Schermelleh L.; Ferrand A.; Huser T.; Eggeling C.; Sauer M.; Biehlmaier O.; Drummen G. P. C. Super-Resolution Microscopy Demystified. Nat. Cell Biol. 2019, 21 (1), 72–84. 10.1038/s41556-018-0251-8. - DOI - PubMed
    1. Pujals S.; Feiner-Gracia N.; Delcanale P.; Voets I.; Albertazzi L. Super-Resolution Microscopy as a Powerful Tool to Study Complex Synthetic Materials. Nat. Rev. Chem. 2019, 3 (2), 68–84. 10.1038/s41570-018-0070-2. - DOI
    1. Wöll D.; Flors C. Super-Resolution Fluorescence Imaging for Materials Science. Small Methods 2017, 1 (10), 170019110.1002/smtd.201700191. - DOI
    1. Chen T.; Dong B.; Chen K.; Zhao F.; Cheng X.; Ma C.; Lee S.; Zhang P.; Kang S. H.; Ha J. W.; Xu W.; Fang N. Optical Super-Resolution Imaging of Surface Reactions. Chem. Rev. 2017, 117 (11), 7510–7537. 10.1021/acs.chemrev.6b00673. - DOI - PubMed

Publication types

Substances