. 2023 Dec 21;13(1):25.
doi: 10.3390/antiox13010025.

Protective Mechanisms of Polyphenol-Enriched Blueberry Preparation in Preventing Inflammation in the Skin against UVB-Induced Damage in an Animal Model

Affiliations

Protective Mechanisms of Polyphenol-Enriched Blueberry Preparation in Preventing Inflammation in the Skin against UVB-Induced Damage in an Animal Model

Nawal Alsadi et al. Antioxidants (Basel). .

Abstract

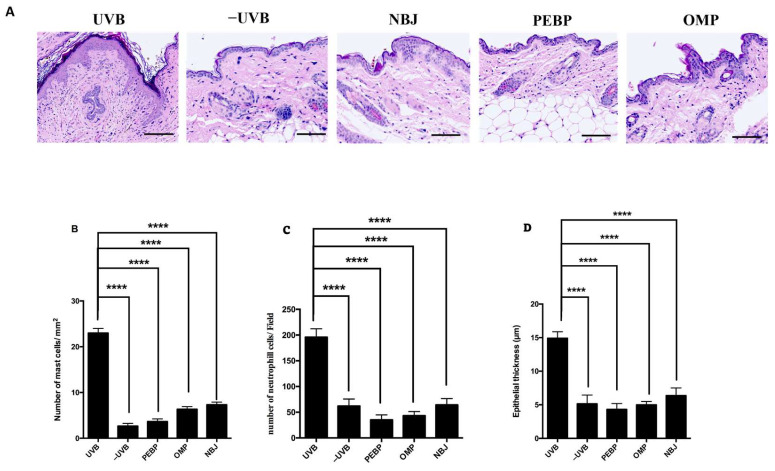
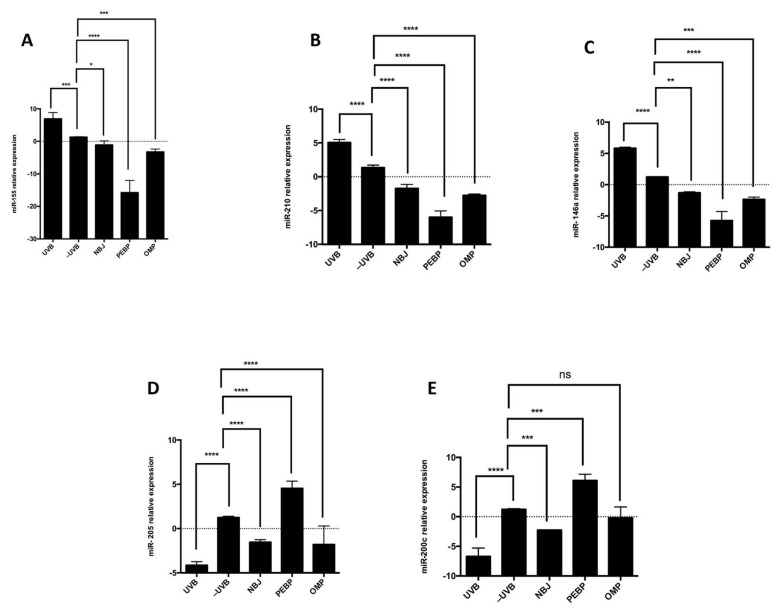
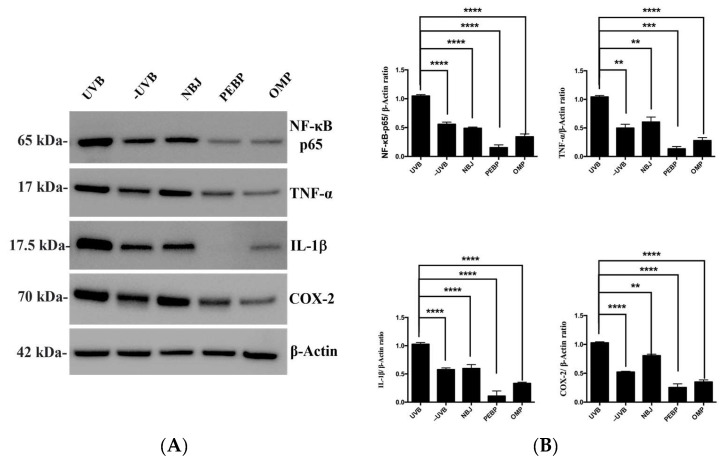
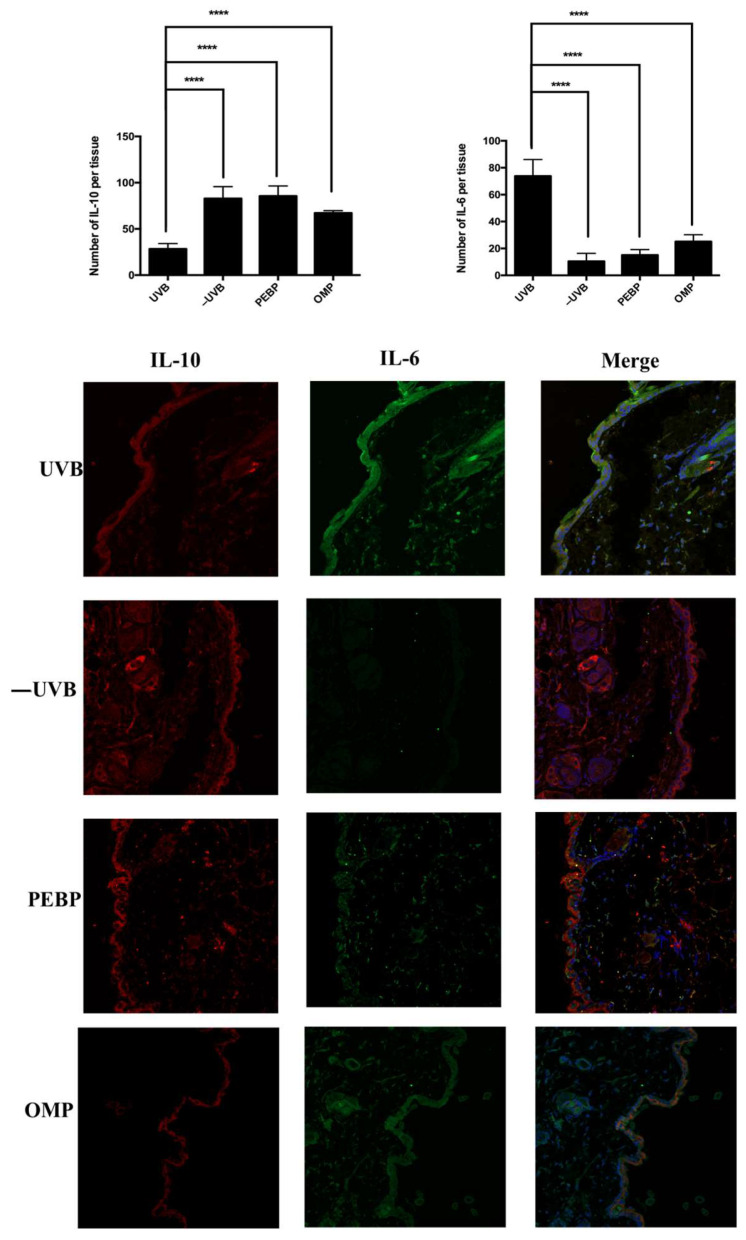
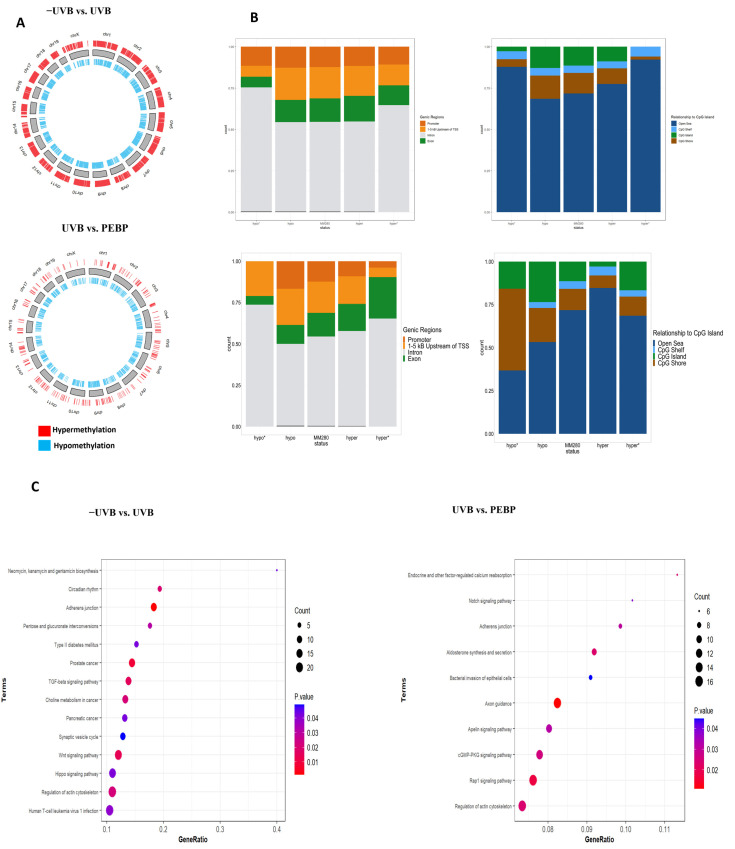
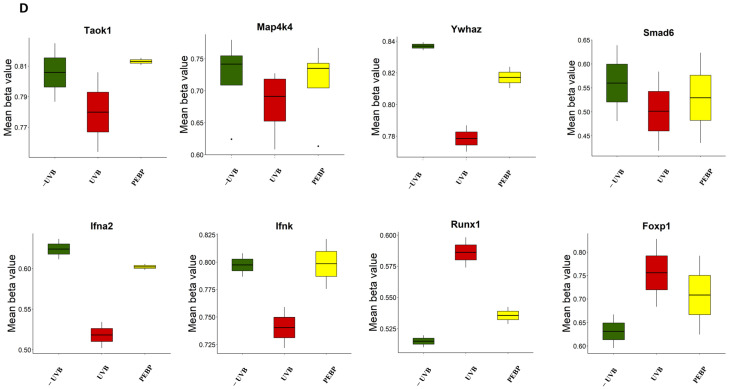
UVB significantly impacts the occurrence of cutaneous disorders, ranging from inflammatory to neoplastic diseases. Polyphenols derived from plants have been found to exhibit photoprotective effects against various factors that contribute to skin cancer. During the fermentation of the polyphenol-enriched blueberry preparation (PEBP), small oligomers of polyphenols were released, thus enhancing their photoprotective effects. This study aimed to investigate the protective effects of PEBP on UVB-induced skin inflammation. Topical preparations of polyphenols were applied to the skin of dorsally shaved mice. Mice were subsequently exposed to UVB and were sacrificed 90 min after UVB exposure. This study revealed that pretreatment with PEBP significantly inhibited UVB-induced recruitment of mast and neutrophil cells and prevented the loss of skin thickness. Furthermore, the findings show that PEBP treatment resulted in the downregulation of miR-210, 146a, and 155 and the upregulation of miR-200c and miR-205 compared to the UVB-irradiated mice. Additionally, PEBP was found to reduce the expression of IL-6, IL-1β, and TNFα, inhibiting COX-2 and increasing IL-10 after UVB exposure. Moreover, DNA methylation analysis indicated that PEBP might potentially reduce the activation of inflammation-related pathways such as MAPK, Wnt, Notch, and PI3K-AKT signaling. Our finding suggests that topical application of PEBP treatment may effectively prevent UVB-induced skin damage by inhibiting inflammation.

Keywords: PEBP; miRNA; nuclear factor kappa-light-chain-enhancer of activated B cells (NF-κB); polyphenols; ultraviolet radiation (UVB).


Conflict of interest statement

The author declares that there are no conflicts of interest regarding the publication of this paper.

Figures

Figure 1
Figure 1
Inhibition of UVB-induced histological alteration by PEBP and OMP in BALB/c mice. (A) H&E staining was performed on skin samples 90 min after UVB exposure. Skin non-exposed to UVB (−UVB) mice were treated without UVB. The horizontal line represents 100 μm. The UVB mice exhibited more inflammatory changes, such as increased (B) mast cells, (C) neutrophil cell count, and (D) skin thickness. In contrast, the PEBP and OMP-treated mice demonstrated decreased skin thickness, mast cells, and neutrophil cell count. Original magnification: ×40. **** p < 0.0001.
Figure 2
Figure 2
Effect of different treatments on the expression of (A) miR-155, (B) miR-210, (C) miR-146a, (D) miR-205, (E) and miR-200c after short-term UVB exposure. Expression levels of these miRNAs were measured by RT-qPCR. miR-210, miR-146a, and miR-155 were significantly downregulated (p < 0.0001), while miR-200c and miR-205 were upregulated (p < 0.0001) compared to non-irradiation control group. The data are the mean ± SEM of at least three independent experiments performed. ns: non-significant, * p < 0.05, ** p < 0.01, *** p < 0.001, **** p < 0.0001.
Figure 3
Figure 3
The expression levels of NF-κB-p65, TNF-α, IL-1β, and COX-2 were detected by Western blotting, and the relative intensity was calculated by dividing the intensity of the protein band by that of the control sample on the same blot and then normalizing against the intensity of β-actin on the same membrane. (A) Representative Western blot images; and (B) Representative quantify and normalize the protein levels using β-actin as the loading control. Values are shown as the mean ± SEM of at least three independent experiments.** p < 0.01, *** p < 0.001, **** p < 0.0001.
Figure 4
Figure 4
Immunohistochemical analysis skin sample with topical administration of PEBP and OMP after UVB exposure in BALB/c mouse tissues. Tissue sections from skin mice were fixed with 10% formalin, paraffin-embedded, and sectioned into 4-µm-thick slices. Staining was performed using the indicated primary antibodies (IL-6 and IL-10), followed by incubation with fluorophore-conjugated secondary antibodies. Immunofluorescence staining shows the presence of IL-6 (green) and IL-10 (red). Nuclei were stained with DAPI (blue). Quantification was generated from eight fields of view from a representative experiment by confocal microscopy (magnification, 20×). **** p < 0.0001.
Figure 5
Figure 5
Alterations of DNA methylation following exposure to UVB-irradiation in mouse skin tissues. (A) Circos Plot illustrating the distribution of the hyper- and hypo-DMRs relative to their chromosomal location when comparing −UVB to UVB groups (top panel) and UVB to UVB + PEBP groups (bottom panel). Red bars represent hypermethylated DMRs, while blue bars represent hypomethylated DMRs. Stacked barcharts displaying the distribution of hyper- and hypomethylated DMPs relative to the MM280 array when classified by (B) genic regions and (C) relationship to CpG island. (B) The bars labeled “hypo*” and “hyper*” represent significantly hypo- and hypermethylated DMRs, respectively, while the bars labeled “hypo” and “hyper” represent all hypo- or hypermethylated DMRs identified in the dataset. The bar labeled “MM280” illustrates the overall distribution of probes in the Illumina Infinium Mouse Methylation BeadChip. (C) Genomes (KEGG) pathway enrichments of the differentially expressed genes (DEGs) between UVB, non-exposed skin, and PEBP groups. The size and color of the dots represent the gene number and the range of p-values, respectively. (D) Boxplots illustrating the differences in DNA methylation levels between the control (−UVB), UVB, and UVB + PEBP groups for selected genes. The resulting box plot displays mean beta values for each sample as data points.
Figure 5
Figure 5
Alterations of DNA methylation following exposure to UVB-irradiation in mouse skin tissues. (A) Circos Plot illustrating the distribution of the hyper- and hypo-DMRs relative to their chromosomal location when comparing −UVB to UVB groups (top panel) and UVB to UVB + PEBP groups (bottom panel). Red bars represent hypermethylated DMRs, while blue bars represent hypomethylated DMRs. Stacked barcharts displaying the distribution of hyper- and hypomethylated DMPs relative to the MM280 array when classified by (B) genic regions and (C) relationship to CpG island. (B) The bars labeled “hypo*” and “hyper*” represent significantly hypo- and hypermethylated DMRs, respectively, while the bars labeled “hypo” and “hyper” represent all hypo- or hypermethylated DMRs identified in the dataset. The bar labeled “MM280” illustrates the overall distribution of probes in the Illumina Infinium Mouse Methylation BeadChip. (C) Genomes (KEGG) pathway enrichments of the differentially expressed genes (DEGs) between UVB, non-exposed skin, and PEBP groups. The size and color of the dots represent the gene number and the range of p-values, respectively. (D) Boxplots illustrating the differences in DNA methylation levels between the control (−UVB), UVB, and UVB + PEBP groups for selected genes. The resulting box plot displays mean beta values for each sample as data points.

References

    1. Parikh R., Sorek E., Parikh S., Michael K., Bikovski L., Tshori S., Shefer G., Mingelgreen S., Zornitzki T., Knobler H., et al. Skin exposure to UVB light induces a skin-brain-gonad axis and sexual behavior. Cell Rep. 2021;36:109579. doi: 10.1016/j.celrep.2021.109579. - DOI - PMC - PubMed
    1. Patra V., Wagner K., Arulampalam V., Wolf P. Skin Microbiome Modulates the Effect of Ultraviolet Radiation on Cellular Response and Immune Function. iScience. 2019;15:211–222. doi: 10.1016/j.isci.2019.04.026. - DOI - PMC - PubMed
    1. Amaro-Ortiz A., Yan B., D’Orazio J.A. Ultraviolet Radiation, Aging and the Skin: Prevention of Damage by Topical cAMP Manipulation. Molecules. 2014;19:6202–6219. doi: 10.3390/molecules19056202. - DOI - PMC - PubMed
    1. Brash D.E. Sunlight and the onset of skin cancer. Trends Genet. 1997;13:410–414. doi: 10.1016/S0168-9525(97)01246-8. - DOI - PubMed
    1. Wilgus T.A., Ross M.S., Parrett M.L., Oberyszyn T.M. Topical application of a selective cyclooxygenase inhibitor suppresses UVB mediated cutaneous inflammation. Prostaglandins Other Lipid Mediat. 2000;62:367–384. doi: 10.1016/S0090-6980(00)00089-7. - DOI - PubMed