. 2024 Jan 22;12(1):108.
doi: 10.3390/vaccines12010108.

Comparative Evaluation of Recombinant and Acellular Pertussis Vaccines in a Murine Model

Affiliations

Comparative Evaluation of Recombinant and Acellular Pertussis Vaccines in a Murine Model

Kyu-Ri Kang et al. Vaccines (Basel). .

Abstract

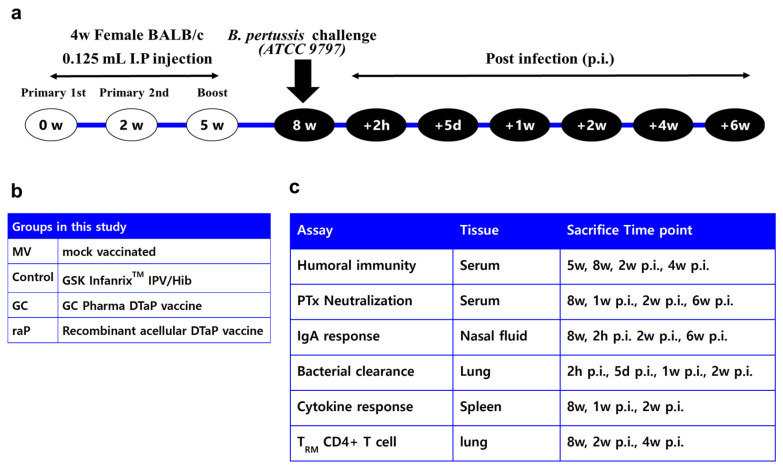
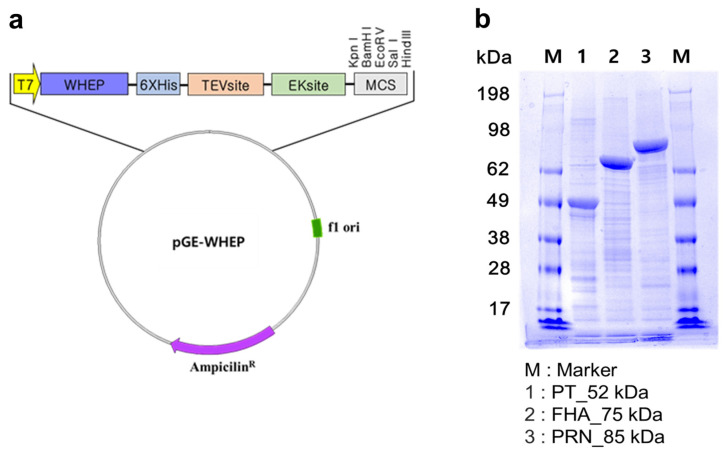
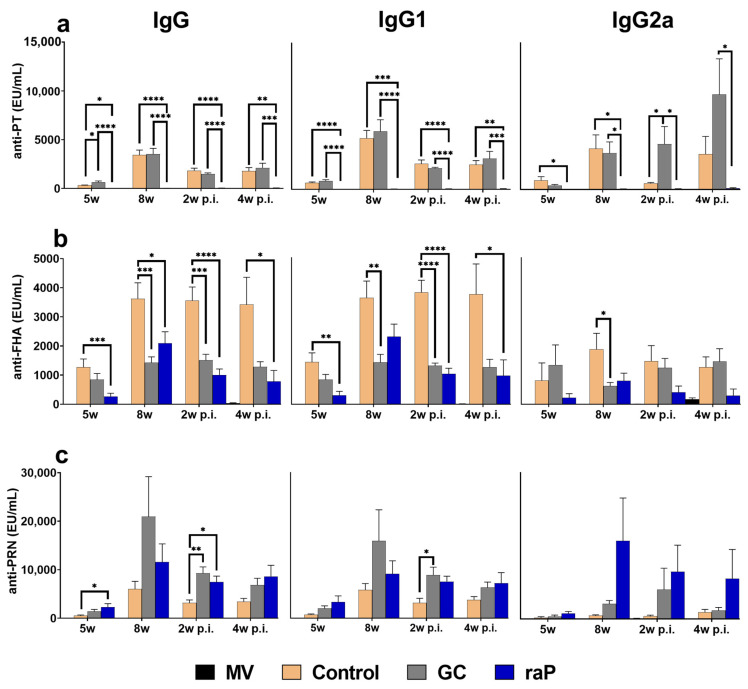
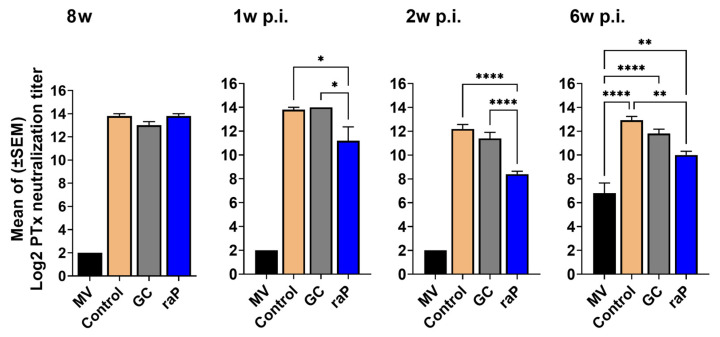
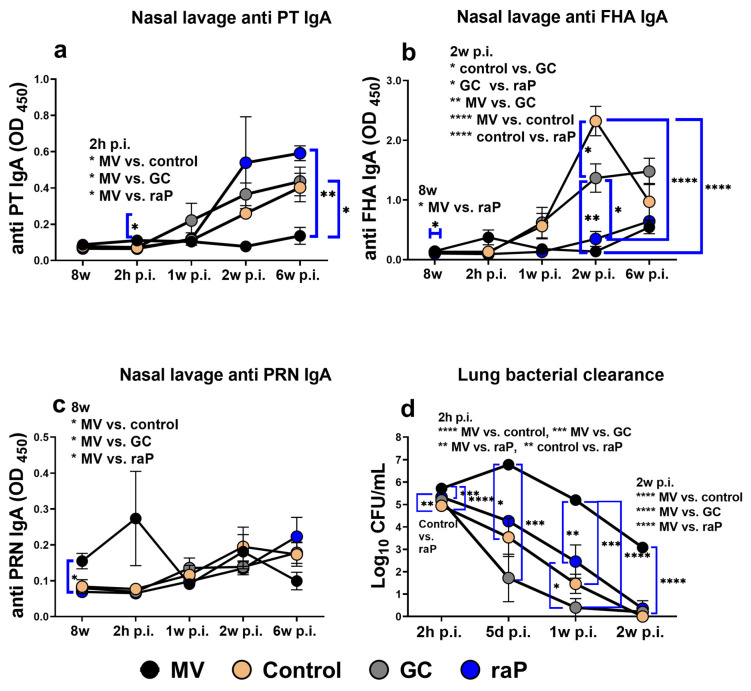
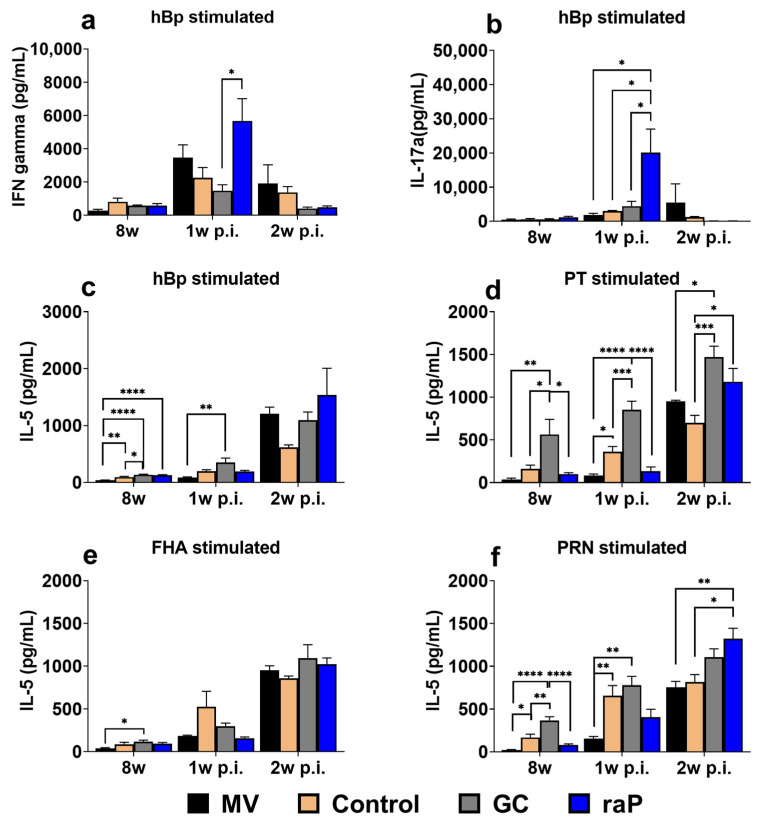
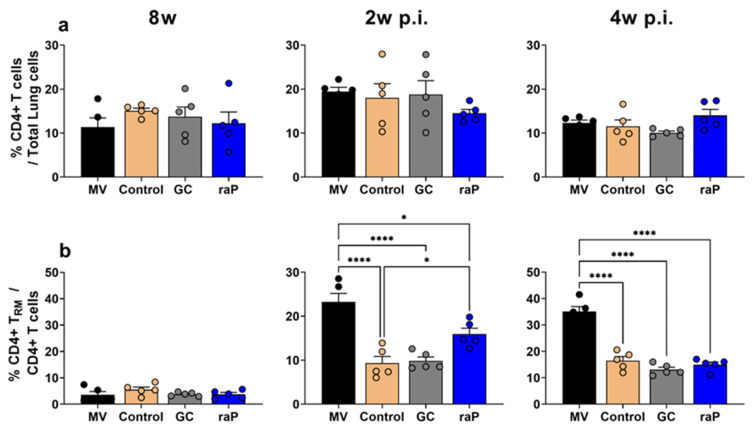
Since the 2000s, sporadic outbreaks of whooping cough have been reported in advanced countries, where the acellular pertussis vaccination rate is relatively high, and in developing countries. Small-scale whooping cough has also continued in many countries, due in part to the waning of immune protection after childhood vaccination, necessitating the development of an improved pertussis vaccine and vaccination program. Currently, two different production platforms are being actively pursued in Korea; one is based on the aP (acellular pertussis) vaccine purified from B. pertussis containing pertussis toxoid (PT), filamentous hemagglutin (FHA) and pertactin (PRN), and the other is based on the recombinant aP (raP), containing genetically detoxified pertussis toxin ADP-ribosyltransferase subunit 1 (PtxS1), FHA, and PRN domain, expressed and purified from recombinant E. coli. aP components were further combined with diphtheria and tetanus vaccine components as a prototype DTaP vaccine by GC Pharma (GC DTaP vaccine). We evaluated and compared the immunogenicity and the protective efficacy of aP and raP vaccines in an experimental murine challenge model: humoral immunity in serum, IgA secretion in nasal lavage, bacterial clearance after challenge, PTx (pertussis toxin) CHO cell neutralization titer, cytokine secretion in spleen single cell, and tissue resident memory CD4+ T cell (CD4+ TRM cell) in lung tissues. In humoral immunogenicity, GC DTaP vaccines showed high titers for PT and PRN and showed similar patterns in nasal lavage and IL-5 cytokine secretions. The GC DTaP vaccine and the control vaccine showed equivalent results in bacterial clearance after challenge, PTx CHO cell neutralization assay, and CD4+ TRM cell. In contrast, the recombinant raP vaccine exhibited strong antibody responses for FHA and PRN, albeit with low antibody level of PT and low titer in PTx CHO neutralization assay, as compared to control and GC DTaP vaccines. The raP vaccine provided a sterile lung bacterial clearance comparable to a commercial control vaccine after the experimental challenge in murine model. Moreover, raP exhibited a strong cytokine response and CD4+ TRM cell in lung tissue, comparable or superior to the experimental and commercial DTaP vaccinated groups. Contingent on improving the biophysical stability and humoral response to PT, the raP vaccine warrants further development as an effective alternative to aP vaccines for the control of a pertussis outbreak.

Keywords: DTaP vaccine; PTx neutralization; efficacy of acellular pertussis vaccine; mouse study; recombinant aP vaccine.


Conflict of interest statement

The authors declare no conflicts of interest.

Figures

Figure 1
Figure 1
Scheme of the study. Four-week female BABL/c mice were vaccinated according to (a) schedule of the study and (b) groups in this study as shown. All assays performed at each time point indicated in (c) assay lists with 5–8 mice per group.
Figure 2
Figure 2
Diagram of WHEP vector and SDS-PAGE results of recombinant pertussis antigens. Recombinant pertussis antigens were produced by (a) WHEP vector. WHEP is a chaperna domain of human origin, derived from glutamyl prolyl tRNA synthetase. Hexa-histidine tag inserted to the vector for Ni-affinity purification. Purified antigens were indicated by (b) SDS-PAGE analysis of raPs. TEV, site-specific TEV protease recognition sequence; EK, site-specific enterokinase recognition sequence; MCS, multi-cloning site.
Figure 3
Figure 3
Humoral responses. IgG, IgG1, and IgG2a antibody titers to vaccine antigens (PT NIBSC 15/126, FHA NIBSC JNIH-4, PRN NIBSC 18/154) were determined using ELISA assay. Serum was collected and analyzed at 3 weeks after inoculation with the second primary vaccine (5 weeks), 3 weeks after inoculation with the booster (8 weeks), and at 2 and 4 weeks post-infection with pertussis (ATCC 9797). Data are presented as mean ± standard errors of the mean (SEM) (EU/mL). Results were obtained from eight animals per group at 5 weeks and 8 weeks, and five animals per group post-infection. (a) PT. (b) FHA. (c) PRN. Between-group differences were investigated using one-way ANOVA and Bonferroni’s post hoc test, and p values are visualized as follows: * p < 0.05, ** p < 0.01, *** p < 0.001, **** p < 0.0001. The differences with the mocked-vaccine group are not shown. EU, ELISA unit; MV, mock vaccinated.
Figure 4
Figure 4
PTx CHO cell neutralization assay. Serum was collected at 3 weeks after the booster injection (8w) and at 1, 2, and 6 weeks post infection (p.i.) with B. pertussis (ATCC 9797), was serially diluted two-fold, then was reacted with NIBSC 15/126 PTx at a concentration corresponding to 4 CPU, and then cultivated with CHO-K1 cells for 24 h. The serum titer was measured as the dilution ratio at which the CHO cell clustering began. All results were transformed to Log2, then expressed as mean ± standard errors of the mean (SEM). Serum was collected from five mice per group. Between-group differences were investigated using one-way ANOVA and Bonferroni’s post hoc test, and p values are displayed as follows: * p < 0.05, ** p < 0.01, **** p < 0.0001. Differences with the mock- vaccinated group only presented at 6 w p.i., since differences of **** p < 0.0001 were observed at 8 w, 1 w p.i., and 2 w p.i. MV, mock vaccinated.
Figure 5
Figure 5
IgA of nasal lavage fluid and bacterial clearance of lungs. After three rounds of vaccination, we measured IgA levels in nasal lavage fluid (1:1 diluted with PBS) for each antigen at 8 w and at 2 h and 1, 2, and 6 weeks post infection (p.i.). All results are presented as the mean ± standard errors of the mean (SEM) of the OD450 values for five animals per group. We also investigated the levels of bacteria (CFU) in lung tissue from mice challenged with the same method at 2 h, 5 days, and 1 and 2 weeks p.i. (a) PT., (b) FHA., (c) PRN., (d) Lung homogenate was serially diluted ten-fold with casamino acid solution and cultured in charcoal agar for at least 5 days in a CO2 incubator before measuring the CFU. Between-group differences were investigated using one-way ANOVA and Bonferroni’s post hoc test, and p values are displayed as follows: * p < 0.05, ** p < 0.01, *** p < 0.001, **** p < 0.0001. CFU, colony-forming unit; MV, mock vaccinated.
Figure 6
Figure 6
Cytokine response. Heat-inactivated pertussis (hBp) and individual solutions of the antigens PT, FHA, and PRN (obtained from GC and prepared to their vaccine concentrations of 25 μg/mL, 25 μg/mL, and 8 μg/mL, respectively) were cultured for 72 h with single splenocytes collected from the spleen at 8 weeks (3 weeks after boost vaccination) and 1 and 2 weeks post-infection (p.i.) with pertussis (ATCC 9797). After culture, the supernatant was collected, and cytokine ELISA kits (Proteintech) were used to measure the levels of IFN-gamma, IL-5, and IL-17a for each group (n = 5). To prepare heat-inactivated pertussis, the bacteria were adjusted using McFarland standards to a concentration of 1 × 10⁶ CFU/mL, suspended in pH 7.4 PBS, and heated at 65 °C for 30 min. (a) hBP-stimulated IFN-gamma secretion; (b) hBP-stimulated IL-17a secretion; (c) hBP-stimulated IL-5 secretion; (d) PT-stimulated IL-5 secretion; (e) FHA-stimulated IL-5 secretion; (f) results for PRN-stimulated IL-5 secretion. All results are presented as the means ± standard errors of the means (SEM). Statistical differences were investigated using one-way ANOVA and Bonferroni’s post hoc test. p values are as follows: * p < 0.05, ** p < 0.01, *** p < 0.001, **** p < 0.0001. MV, mock vaccinated.
Figure 7
Figure 7
Expression of CD4+ T cells and CD4+ TRM cells. CD4+ T cells and T RM cells in lungs from five mice per each group were analyzed with FACS Aria Fusion at 8 weeks and 2 weeks post-infection (p.i.) and 4 weeks p.i. (a) Accumulation of CD4+ T cells among 10,000 lung cells are shown as a percentage. (b) The graph shows the percentage of CD4+ T RM cells among total CD4+ T cells in lung tissue-resident cells (CD3+ CD45.2+ CD4+). All groups were compared using one-way ANOVA and Bonferroni’s post hoc test. p values are as follows: * p < 0.05, **** p < 0.0001.

References

    1. Hewlett E.L., Edwards K.M. Clinical practice. Pertussis–not just for kids. N. Engl. J. Med. 2005;352:1215–1222. doi: 10.1056/NEJMcp041025. - DOI - PubMed
    1. Mattoo S., Cherry J.D. Molecular pathogenesis, epidemiology, and clinical manifestations of respiratory infections due to Bordetella pertussis and other Bordetella subspecies. Clin. Microbiol. Rev. 2005;18:326–382. doi: 10.1128/CMR.18.2.326-382.2005. - DOI - PMC - PubMed
    1. Choe Y.J., Choe Y.J., Park Y.J., Jung C., Bae G.R., Lee D.H. National pertussis surveillance in South Korea 1955–2011: Epidemiological and clinical trends. Int. J. Infect. Dis. 2012;16:e850–e854. doi: 10.1016/j.ijid.2012.07.012. - DOI - PubMed
    1. Sato Y., Sato H. Development of acellular pertussis vaccines. Biologicals. 1999;27:61–69. doi: 10.1006/biol.1999.0181. - DOI - PubMed
    1. WHO (World Health Organization) Pertussis vaccines: WHO position paper, August 2015–Recommendations. Vaccine. 2016 August 20;34:1423–1425. doi: 10.1016/j.vaccine.2015.10.136. - DOI - PubMed

LinkOut - more resources