. 2024 Jan 26:12:RP89762.
doi: 10.7554/eLife.89762.

Association of genetic variation in COL11A1 with adolescent idiopathic scoliosis

Affiliations

Association of genetic variation in COL11A1 with adolescent idiopathic scoliosis

Hao Yu et al. Elife. .

Abstract

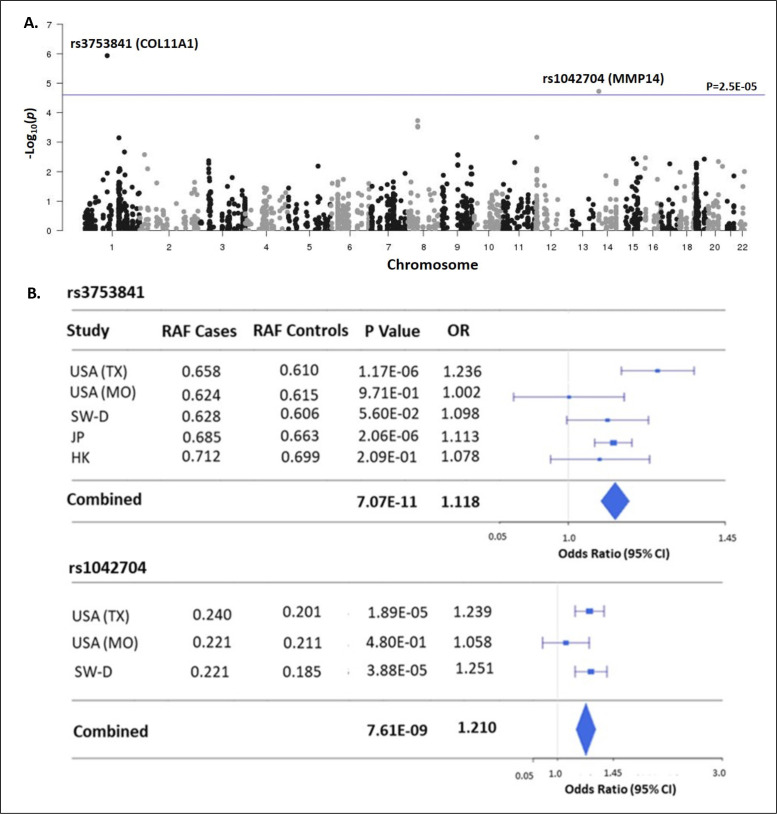
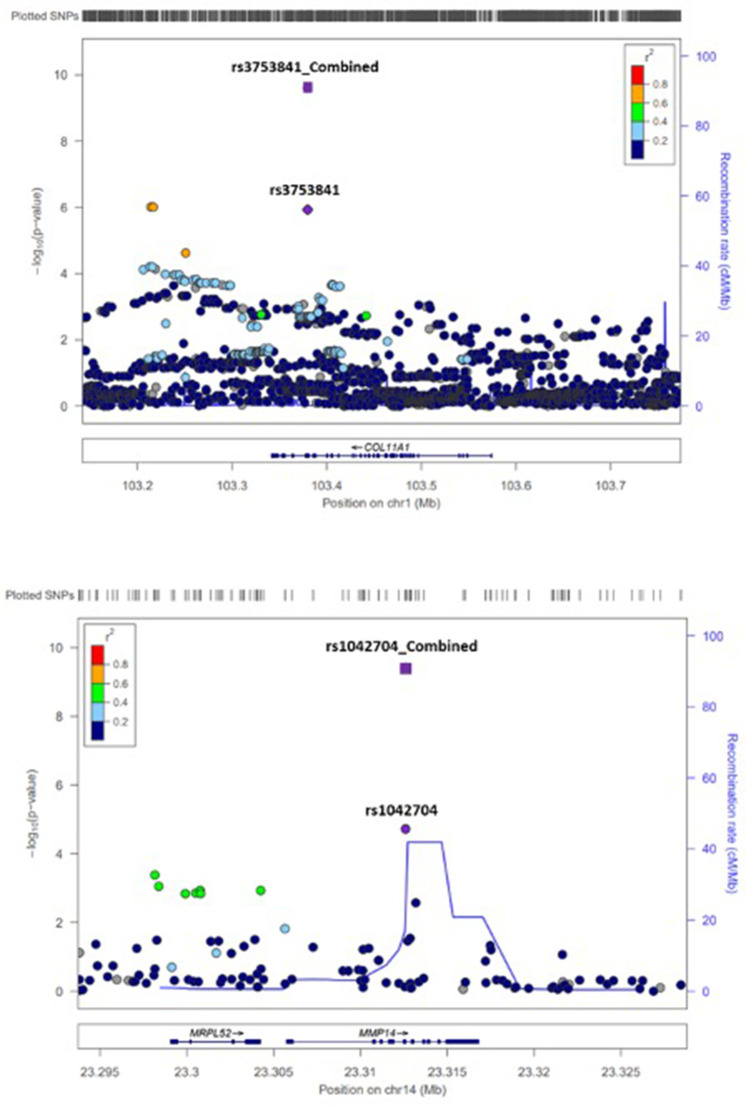
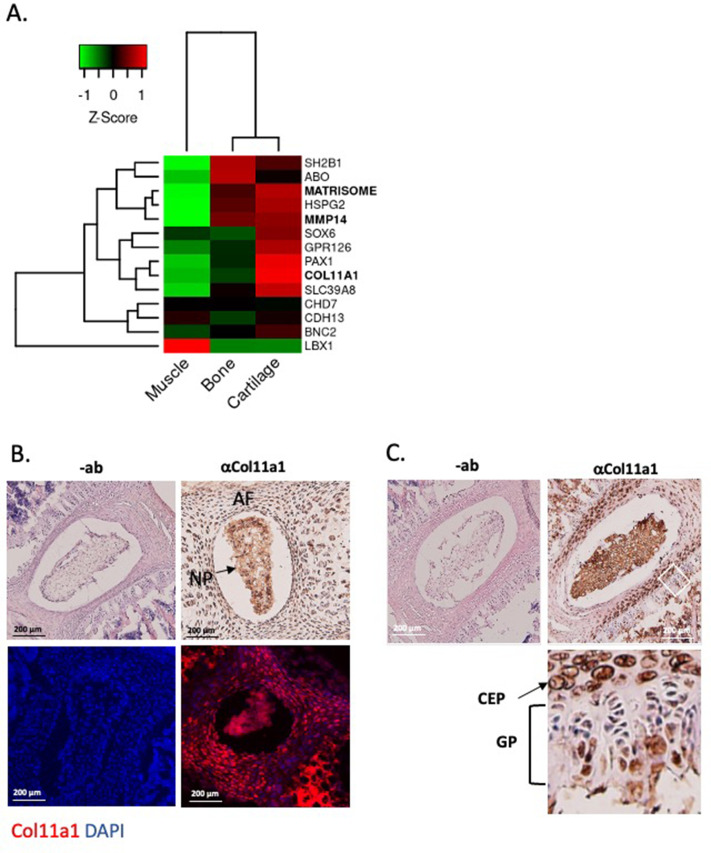
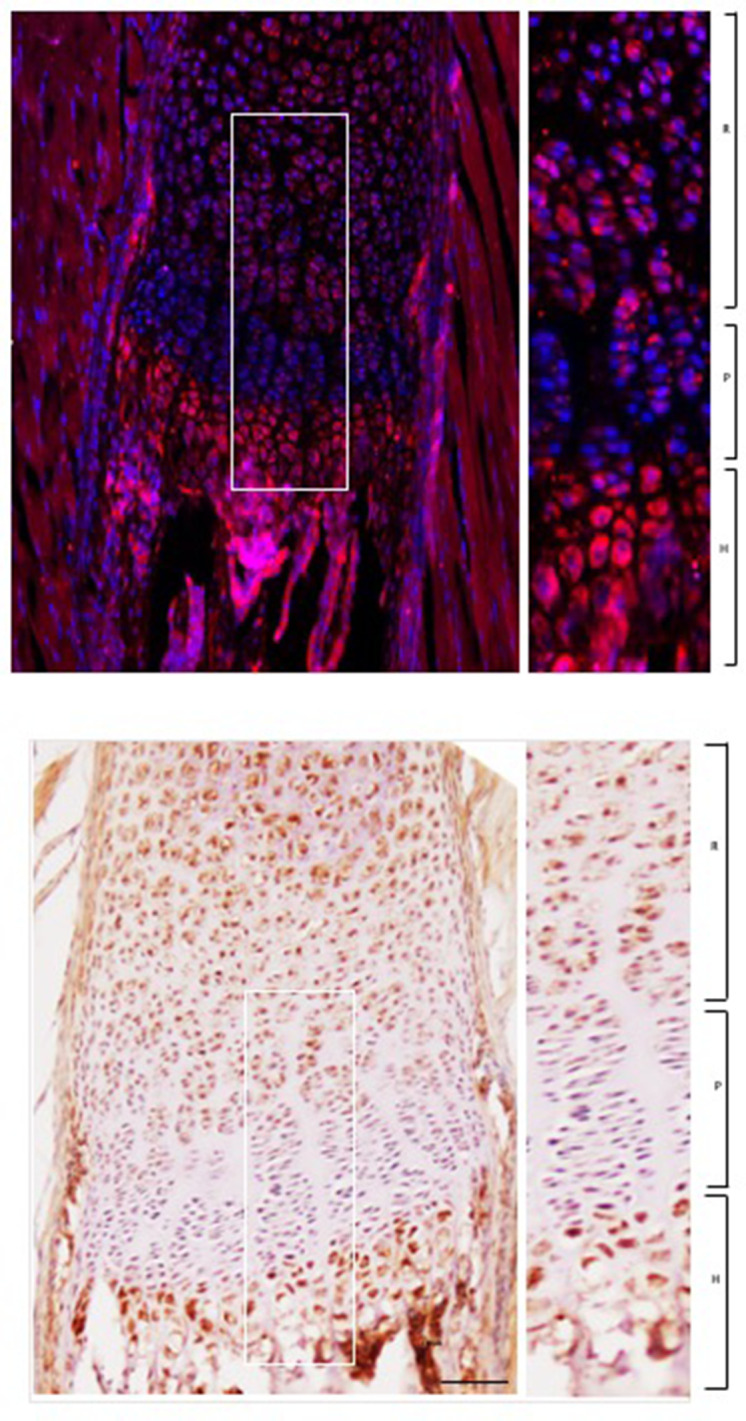
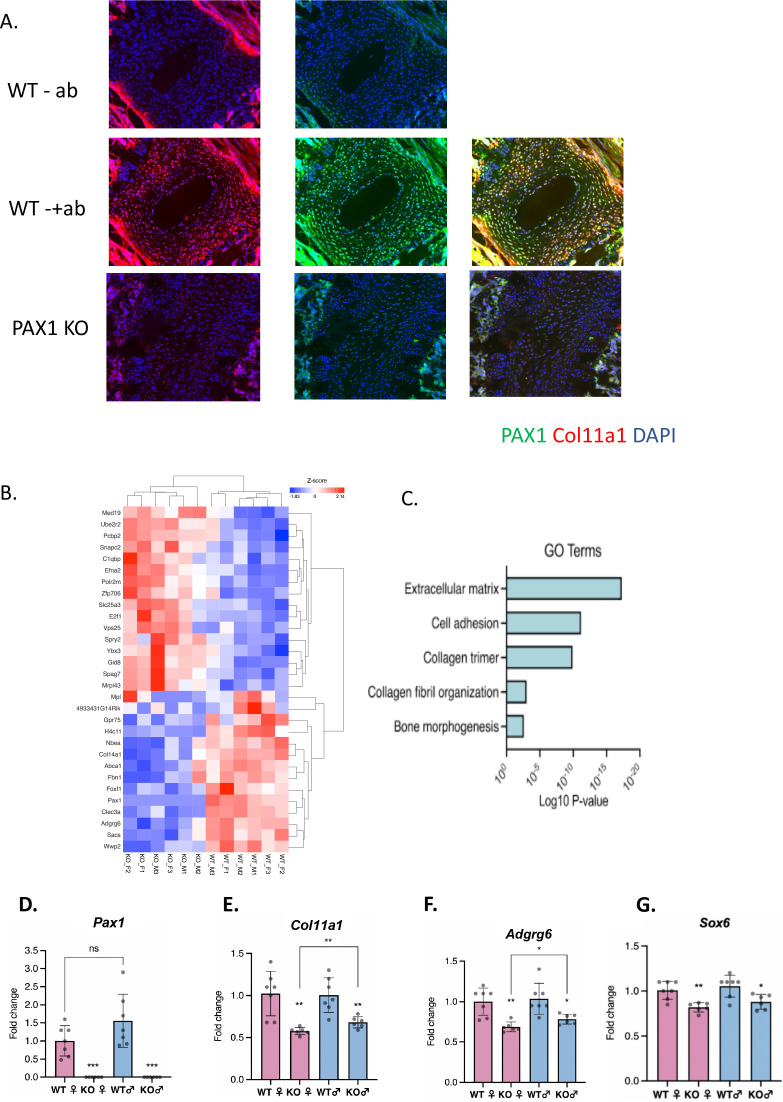
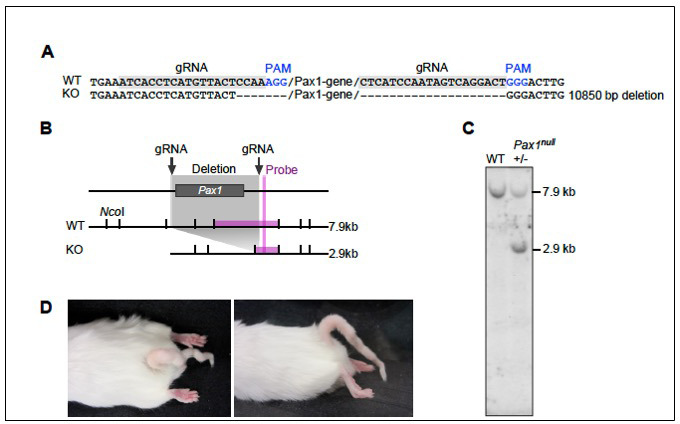
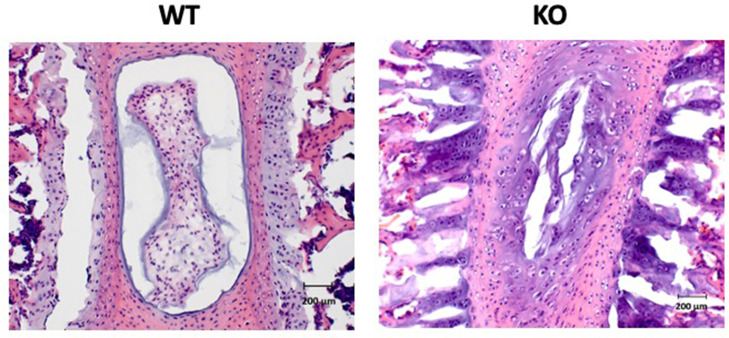
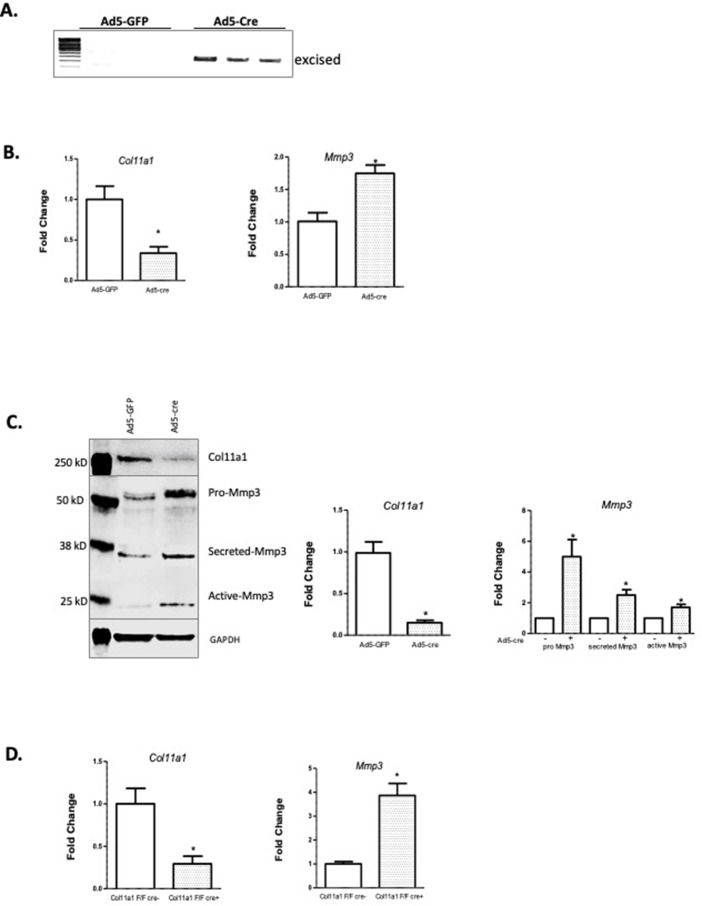
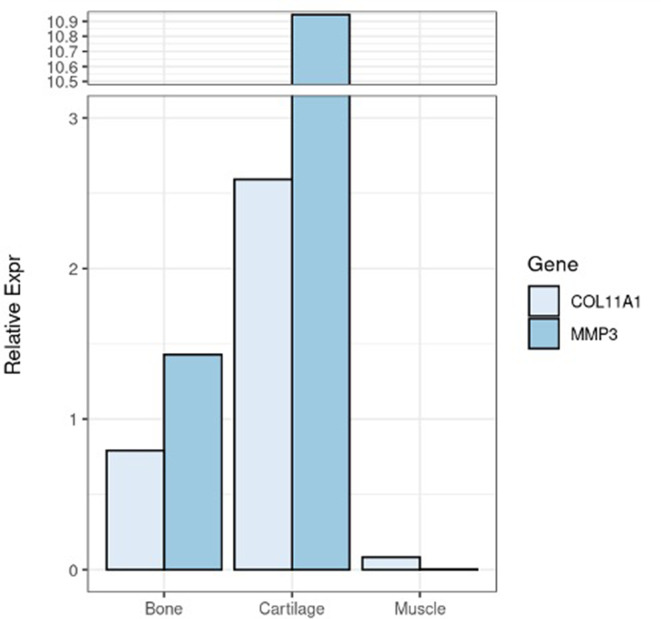
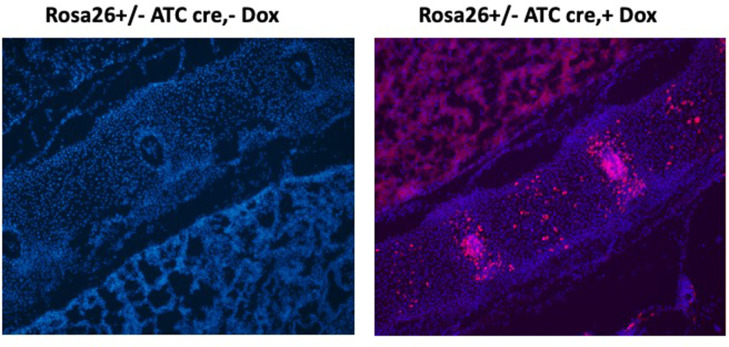
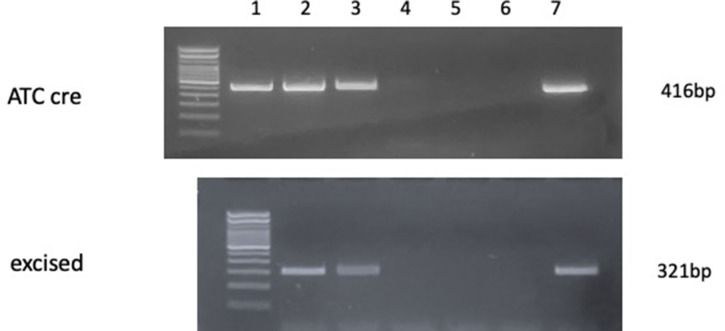
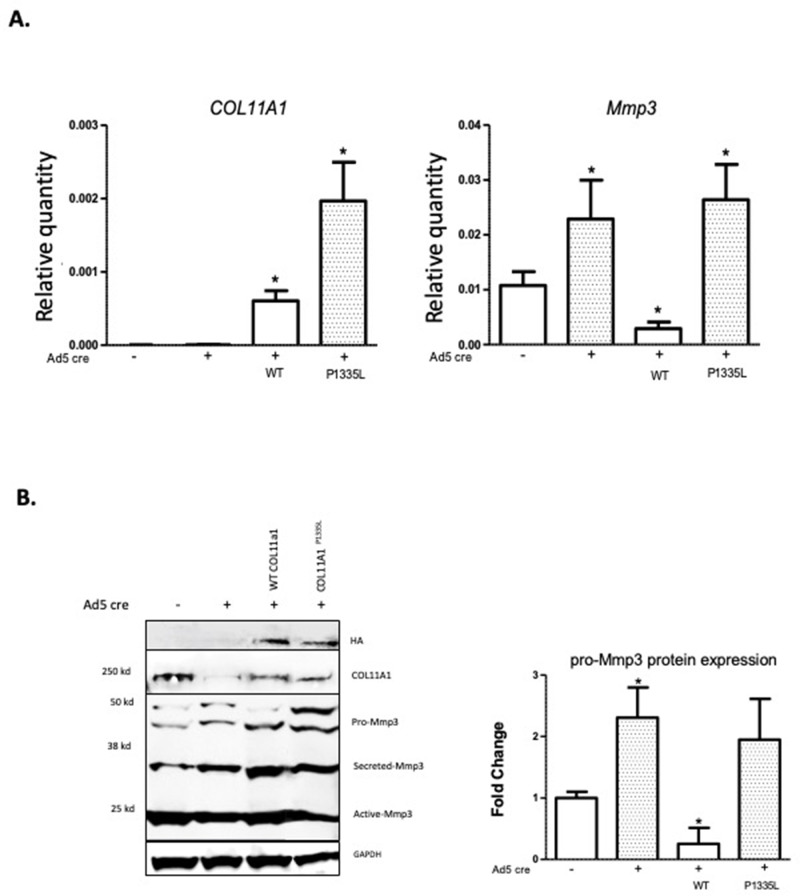
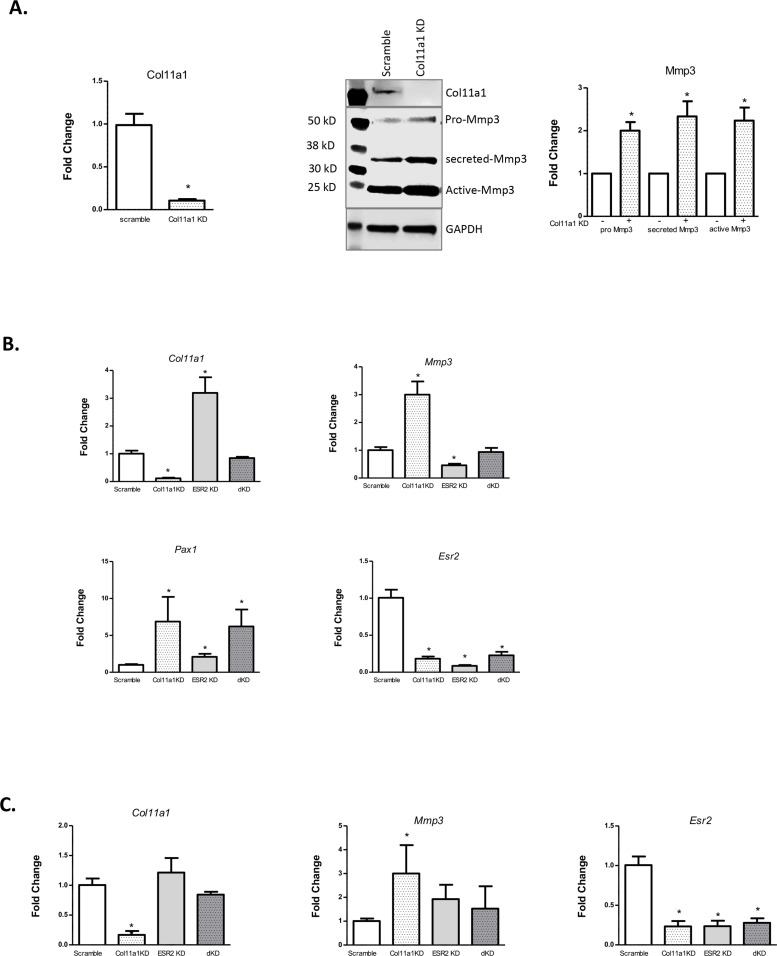
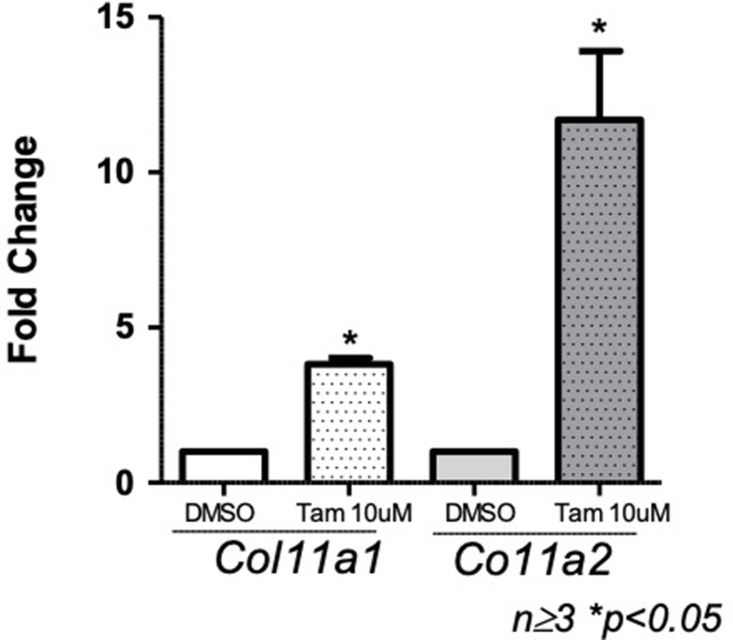
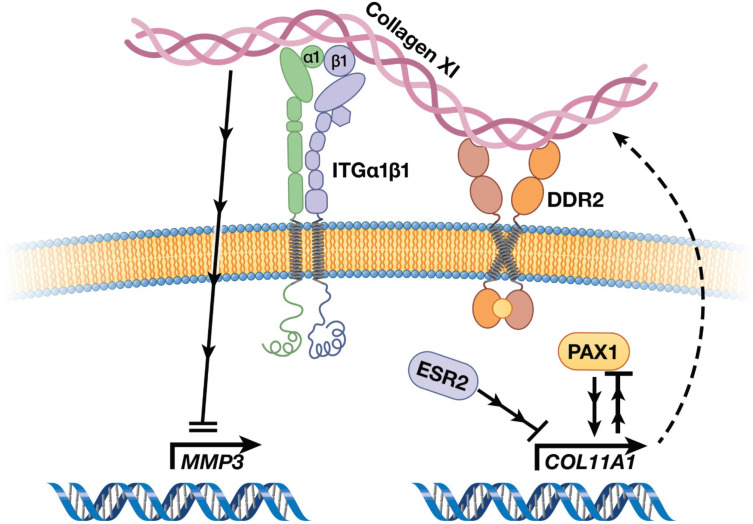
Adolescent idiopathic scoliosis (AIS) is a common and progressive spinal deformity in children that exhibits striking sexual dimorphism, with girls at more than fivefold greater risk of severe disease compared to boys. Despite its medical impact, the molecular mechanisms that drive AIS are largely unknown. We previously defined a female-specific AIS genetic risk locus in an enhancer near the PAX1 gene. Here, we sought to define the roles of PAX1 and newly identified AIS-associated genes in the developmental mechanism of AIS. In a genetic study of 10,519 individuals with AIS and 93,238 unaffected controls, significant association was identified with a variant in COL11A1 encoding collagen (α1) XI (rs3753841; NM_080629.2_c.4004C>T; p.(Pro1335Leu); p=7.07E-11, OR = 1.118). Using CRISPR mutagenesis we generated Pax1 knockout mice (Pax1-/-). In postnatal spines we found that PAX1 and collagen (α1) XI protein both localize within the intervertebral disc-vertebral junction region encompassing the growth plate, with less collagen (α1) XI detected in Pax1-/- spines compared to wild-type. By genetic targeting we found that wild-type Col11a1 expression in costal chondrocytes suppresses expression of Pax1 and of Mmp3, encoding the matrix metalloproteinase 3 enzyme implicated in matrix remodeling. However, the latter suppression was abrogated in the presence of the AIS-associated COL11A1P1335L mutant. Further, we found that either knockdown of the estrogen receptor gene Esr2 or tamoxifen treatment significantly altered Col11a1 and Mmp3 expression in chondrocytes. We propose a new molecular model of AIS pathogenesis wherein genetic variation and estrogen signaling increase disease susceptibility by altering a PAX1-COL11a1-MMP3 signaling axis in spinal chondrocytes.

Keywords: collagen XI; estrogen signaling; extracellular matrix; genetics; genomics; human; mouse; scoliosis.

Plain language summary

Adolescent idiopathic scoliosis (AIS) is a twisting deformity of the spine that occurs during periods of rapid growth in children worldwide. Children with severe cases of AIS require surgery to stop it from getting worse, presenting a significant financial burden to health systems and families. Although AIS is known to cluster in families, its genetic causes and its inheritance pattern have remained elusive. Additionally, AIS is known to be more prevalent in females, a bias that has not been explained. Advances in techniques to study the genetics underlying diseases have revealed that certain variations that increase the risk of AIS affect cartilage and connective tissue. In humans, one such variation is near a gene called Pax1, and it is female-specific. The extracellular matrix is a network of proteins and other molecules in the space between cells that help connect tissues together, and it is particularly important in cartilage and other connective tissues. One of the main components of the extracellular matrix is collagen. Yu, Kanshour, Ushiki et al. hypothesized that changes in the extracellular matrix could affect the cartilage and connective tissues of the spine, leading to AIS. To show this, the scientists screened over 100,000 individuals and found that AIS is associated with variants in two genes coding for extracellular matrix proteins. One of these variants was found in a gene called Col11a1, which codes for one of the proteins that makes up collagen. To understand the relationship between Pax1 and Col11a1, Yu, Kanshour, Ushiki et al. genetically modified mice so that they would lack the Pax1 gene. In these mice, the activation of Col11a1 was reduced in the mouse spine. They also found that the form of Col11a1 associated with AIS could not suppress the activation of a gene called Mmp3 in mouse cartilage cells as effectively as unmutated Col11a1. Going one step further, the researchers found that lowering the levels of an estrogen receptor altered the activation patterns of Pax1, Col11a1, and Mmp3 in mouse cartilage cells. These findings suggest a possible mechanism for AIS, particularly in females. The findings of Yu, Kanshour, Ushiki et al. highlight that cartilage cells in the spine are particularly relevant in AIS. The results also point to specific molecules within the extracellular matrix as important for maintaining proper alignment in the spine when children are growing rapidly. This information may guide future therapies aimed at maintaining healthy spinal cells in adolescent children, particularly girls.


Conflict of interest statement

HY, AK, AU, NO, YK, EE, YF, LA, YK, RC, RS, YZ, JP, NG, BE, JC, JH, CT, YS, CG, PG, SI, JR, NA, CW No competing interests declared

Figures

Figure 1.
Figure 1.. Matrisome-wide association study.
(A) Manhattan plot showing –log10 p-values (y-axis) versus chromosomal position (x-axis) for the 2008 common coding variants tested in the discovery study USA (TX). The horizontal line represents the threshold for significance level (p-value <2.5 × 10⁻⁵) after Bonferroni multiple testing correction. (B) Tests of association for SNPs rs3753841 and rs1042704 in discovery and independent replication cohorts. RAF – reference allele frequency; OR – odds ratio; CI –confidence interval.
Figure 1—figure supplement 1.
Figure 1—figure supplement 1.. Statistical power as a function of the genotype relative risk (OR) to detect significant association at α=2.5E–05 for different disease allele frequencies, using 1358 cases and 12,507 controls in the discovery study.
Figure 1—figure supplement 2.
Figure 1—figure supplement 2.. Manhattan plot showing –log10 p-values (y-axis) plotted versus chromosomal position (x-axis) for the 2009 common coding variants tested for females in the discovery study USA (TX).
Figure 1—figure supplement 3.
Figure 1—figure supplement 3.. Tests of association of SNP rs1042704 with adolescent idiopathic scoliosis (AIS) in East Asian cohorts.
RAF – reference allele frequency; OR – odds ratio; CI – confidence interval.
Figure 1—figure supplement 4.
Figure 1—figure supplement 4.. LocusZoom plots of SNPs in genomic regions of SNPs rs3753841 (top) and rs1042704 (bottom).
Genomic location (x-axis) is plotted versus –log10 p-values (y-axis). Correlation between SNPs is shown by color-coded r2 value (legend).
Figure 2.
Figure 2.. Col11a1 and Mmp14 expression in spine.
(A) A heatmap of transcript per million (TPM) values of COL11A1, MMP14, and other published genes associated with adolescent idiopathic scoliosis (AIS). The average TPM value of matrisome genes is represented as MATRISOME. (B) Detection of collagen a1(XI) in P0.5 mouse spine. Immunohistochemistry (IHC) shown at top, with immunofluorescence (IF) staining below. ‘-ab’ refers to negative controls lacking primary antibody (shown at left). Results are representative of N≥3 technical replicates in whole spines. (C) Detection of collagen a1(XI) in P28 mouse spine. Negative antibody IHC control shown at left; antibody-positive IHC shown at right. Enlarged, rotated view of white boxed area shows a biphasic staining pattern. CEP – cartilage endplate; GP – growth plate. Results are representative of N≥3 technical replicates in whole spines.
Figure 2—figure supplement 1.
Figure 2—figure supplement 1.. Immunofluorescence (IF) staining using collagen a1(XI) antibody in P28 ribs (top).
Boxed area shows biphasic staining pattern expanded at right. R – presumed resting zone; P – columnar chondrocytes of presumed proliferating zone; H – presumed hypertrophic zone and chondro-osseous junction. Each image is representative of results in at least three animals.
Figure 3.
Figure 3.. Assessing Pax1 regulation of Col11a1 expression.
(A) Immunofluorescence (IF) staining of P28 intervertebral disc (IVD) from thoracic regions of Pax1-/- (bottom) and wild-type (WT) littermate (middle, top) mice using PAX1- (green) and collagen a1(XI)-specific (red) antibodies and DAPI nuclear counterstain. Antibody-negative controls are shown at top as (-ab). Results are representative of N≥3 technical replicates in whole spines. (B) Heatmap of differentially expressed genes (p-value <0.0001) in embryonic stage 12.5 (E12.5) tails of WT and Pax1-/- mice. (C) Gene ontology (GO) analysis of differentially expressed genes in E12.5 tail WT and Pax1-/- mice. (D–G) Gene expression levels dissected from E12.5 mouse tail from WT and Pax1-/- (knockout [KO]) mice as determined by quantitative real-time PCR (qRT-PCR). Each value represents the ratio of each gene expression to that of β-actin, and values are mean ± standard deviation. The expression value of WT female group was arbitrarily set at 1.0. Each dot represents one embryo and statistical differences were determined using a two-sided unpaired t-test (*p<0.05, **p<0.01, ***p<0.001).
Figure 3—figure supplement 1.
Figure 3—figure supplement 1.. Design and validation of Pax1 knockout in mouse using CRISPR-mediated gene targeting.
(A) Guide RNAseq and PAM sites flanking 5’ and 3’ sides of the Pax1 gene. (B) Location of the NcoI restriction enzyme sites, shown as vertical lines in wild-type (WT) and knockout (KO) loci. The deletion and probe location are shown as gray and pink rectangles, respectively. Expected band sizes in WT and KO are written to the right of the map. (C) Southern blot analyses of WT and heterozygous KO mice with the estimated band size written to the right of the blot. Southern blot analyses were performed >2 times using founder and F1 generation. (D) Pax1-/- mice showed kinky tail phenotype on dorsal (left) and lateral (right) views.
Figure 3—figure supplement 2.
Figure 3—figure supplement 2.. HE staining of sectioned lumbar spines from wild-type (left) and Pax1-/- (right) mice.
Figure 4.
Figure 4.. Col11a1 regulation of Mmp3 expression in cartilage.
(A) PCR assay of Col11a1 excision in Col11a1fl/fl cultured costal chondrocytes. (B) Gene expression levels from Col11a1fl/fl cultured costal chondrocytes transduced with green fluorescent protein (GFP) (Ad5-GFP, left) or Cre-expressing adenovirus (Ad5-cre, right) as determined by quantitative real-time PCR (qRT-PCR). Values represent the ratio of each gene expression to that of GAPDH, and values are mean ± standard deviation. The expression value of control Ad5-GFP results was arbitrarily set at 1.0. Statistical differences were determined using a two-sided paired t-test (*p<0.05). Results shown for N≥3 biologic replicates, each including three technical replicates. (C) Western blot detection of collagen a1(XI), MMP3, and GAPDH loading control in cultured costal chondrocytes after Ad5-GFP or Ad5-cre transduction. Results are representative of N=4 biologic replicates. Protein size ladder is shown in lane 1. Quantification of bands detected by western blotting, where Ad5-GFP was set to 1.0, is shown at right. Statistical differences were determined using a two-sided paired t-test (*p<0.05). (D) Gene expression levels from dissected Col11a1fl/fl:ATC costal cartilage, analyzed as described in (A). Results shown for N=3 biologic replicates, each including three technical replicates.
Figure 4—figure supplement 1.
Figure 4—figure supplement 1.. Relative expression of MMP3 compared to COL11A1 in human spinal tissues.
Values are plotted from average TPM values for each gene.
Figure 4—figure supplement 2.
Figure 4—figure supplement 2.. Immunofluorescence microscopy of Rosa26+/-:ATC P0 spines, without doxycycline treatment (left) and after doxycycline treatment starting at embryonic stage 15.5 (E15.5) (right).
Figure 4—figure supplement 3.
Figure 4—figure supplement 3.. PCR assays in DNA from costal cartilage.
Top gel shows detection of ATC Cre transgene (top, 416 bp band) in Col11a1fl/fl:ATC mice (lanes 2,3,7) and Col11a1fl/fl mice (lanes 4,5,6) after doxycycline treatment. Lane 1 is positive control. Bottom gel shows Col11a1 fl/fl excision-specific band (321 bp) in Col11a1fl/fl:ATC mice (lanes 2,3,7) and Col11a1fl/fl mice (lanes 4,5,6) after doxycycline treatment.
Figure 5.
Figure 5.. Col11a1P1335L regulation of Mmp3 expression in lentiviral transduced mouse GPCs.
(A) Quantitative real-time PCR (qRT-PCR) of human COL11A1 and endogenous mouse Mmp3 in SV40-immortalized mouse costal chondrocytes transduced with the lentiviral vector only (lanes 1,2), human wild-type (WT) COL11A1 (lane 3), or COL11A1P1335L. Values represent the ratio of each gene expression to that of GAPDH, and values are mean ± standard deviation. Significant quantitative changes (p≤0.05) relative to vector-only transfected cells as measured by unpaired t-tests are shown by *. Results shown for N=4 biologic replicates, each including three technical replicates. (B) Western blot corresponding to experiments shown in (A) using HA antibody to detect epitope-tagged human collagen a1(XI), COL11A1 antibody to detect mouse and human collagen a1(XI), MMP3 antibody to detect endogenous mouse MMP3, and GAPDH. Values are mean after normalization to GAPDH, ± standard deviation. Significant differences (p≤0.05) relative to vector-only, Ad5-negative transfected cells as measured by unpaired t-tests are shown by *.
Figure 6.
Figure 6.. Effects of estrogen receptor beta on Col11a1-Mmp3 signaling axis.
(A) RT-qPCR (left) of Col11a1 expression after siRNA-mediated knockdown as shown at left. Representative western blot (of N=4 biologic replicates) of cultured costal chondrocytes after scramble or Col11a1-specific siRNA knockdown is shown in middle. Protein size ladder is shown in lane 1. Quantification of bands detected by western blotting is shown at right, where scramble results were set to 1.0. Values are mean after normalization to GAPDH, ± standard deviation. (B) Gene expression levels of Col11a1, Mmp3, Pax1, and Esr2 mRNA in cultured costal chondrocytes showing fold change relative to the scramble control. dKD = double Col11a1-Esr2-specific siRNA knockdowns. Each value represents the ratio of each gene expression to that of GAPDH, and values are mean ± standard deviation. Results are representative of N≥3 biologic replicates, each including three technical replicates. (C) Gene expression levels from rat cartilage endplate (CEP) cells, as described in (B).
Figure 6—figure supplement 1.
Figure 6—figure supplement 1.. Quantitative real-time PCR (qRT-PCR) of Col11a1 and Col11a2 mRNA in cultured costal chondrocytes treated with DMSO carrier or tamoxifen (N≥3 independent experiments).
Figure 6—figure supplement 2.
Figure 6—figure supplement 2.. Quantitative real-time PCR (qRT-PCR) of Sfrp2, Krt19, and Mmp12 mRNA to validate expression of these marker genes in cultured rat nucleus pulposus (NP), annulus fibrosus (AF), and cartilage endplate (CEP) cells.
Figure 7.
Figure 7.. Cartoon depiction of a collagen XI-mediated signaling axis in chondrocytes.
Collagen XI is held in the pericellular space by integrins and DDR2. COL11A1, under the regulation of ESR2 and PAX1, signals through unknown mechanisms and inhibits MMP3 transcription.

Update of

References

    1. Ameur A, Dahlberg J, Olason P, Vezzi F, Karlsson R, Martin M, Viklund J, Kähäri AK, Lundin P, Che H, Thutkawkorapin J, Eisfeldt J, Lampa S, Dahlberg M, Hagberg J, Jareborg N, Liljedahl U, Jonasson I, Johansson Å, Feuk L, Lundeberg J, Syvänen A-C, Lundin S, Nilsson D, Nystedt B, Magnusson PK, Gyllensten U. SweGen: a whole-genome data resource of genetic variability in a cross-section of the Swedish population. European Journal of Human Genetics. 2017;25:1253–1260. doi: 10.1038/ejhg.2017.130. - DOI - PMC - PubMed
    1. Anders S, Pyl PT, Huber W. HTSeq—a python framework to work with high-throughput sequencing data. Bioinformatics. 2015;31:166–169. doi: 10.1093/bioinformatics/btu638. - DOI - PMC - PubMed
    1. Ashburner M, Ball CA, Blake JA, Botstein D, Butler H, Cherry JM, Davis AP, Dolinski K, Dwight SS, Eppig JT, Harris MA, Hill DP, Issel-Tarver L, Kasarskis A, Lewis S, Matese JC, Richardson JE, Ringwald M, Rubin GM, Sherlock G. Gene Ontology: tool for the unification of biology. Nature Genetics. 2000;25:25–29. doi: 10.1038/75556. - DOI - PMC - PubMed
    1. Aszódi A, Chan D, Hunziker E, Bateman JF, Fässler R. Collagen II is essential for the removal of the notochord and the formation of intervertebral discs. The Journal of Cell Biology. 1998;143:1399–1412. doi: 10.1083/jcb.143.5.1399. - DOI - PMC - PubMed
    1. Bachmann-Gagescu R, Phelps IG, Stearns G, Link BA, Brockerhoff SE, Moens CB, Doherty D. The ciliopathy gene cc2d2a controls zebrafish photoreceptor outer segment development through a role in Rab8-dependent vesicle trafficking. Human Molecular Genetics. 2011;20:4041–4055. doi: 10.1093/hmg/ddr332. - DOI - PMC - PubMed