

Application of elastic net regression for modeling COVID-19 sociodemographic risk factors
- PMID: 38277346
- PMCID: PMC10817220
- DOI: 10.1371/journal.pone.0297065
Application of elastic net regression for modeling COVID-19 sociodemographic risk factors
Abstract
Objectives: COVID-19 has been at the forefront of global concern since its emergence in December of 2019. Determining the social factors that drive case incidence is paramount to mitigating disease spread. We gathered data from the Social Vulnerability Index (SVI) along with Democratic voting percentage to attempt to understand which county-level sociodemographic metrics had a significant correlation with case rate for COVID-19.
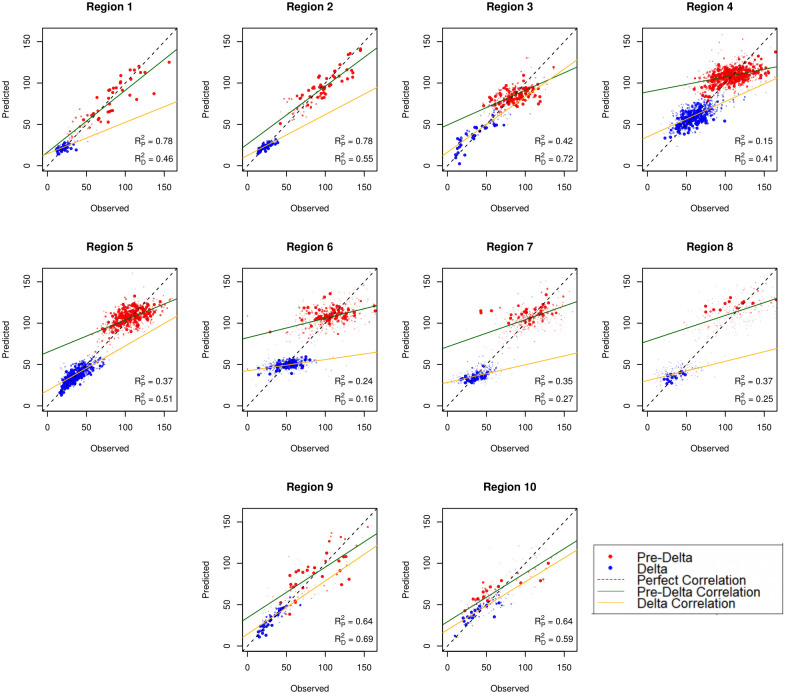
Methods: We used elastic net regression due to issues with variable collinearity and model overfitting. Our modelling framework included using the ten Health and Human Services regions as submodels for the two time periods 22 March 2020 to 15 June 2021 (prior to the Delta time period) and 15 June 2021 to 1 November 2021 (the Delta time period).
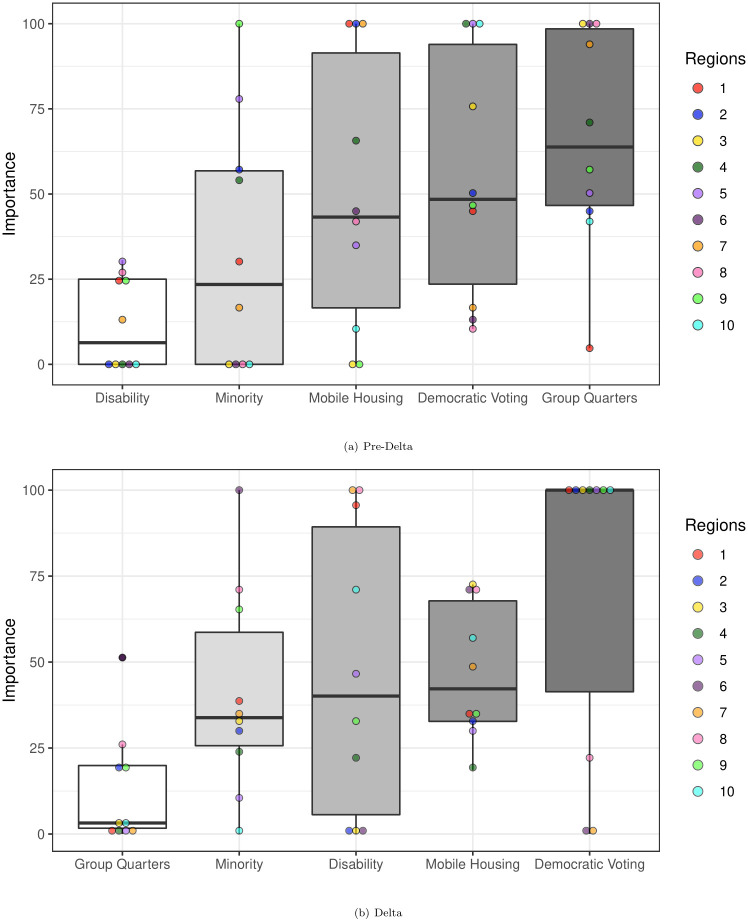
Results: Statistically, elastic net improved prediction when compared to multiple regression, as almost every HHS model consistently had a lower root mean square error (RMSE) and satisfactory R2 coefficients. These analyses show that the percentage of minorities, disabled individuals, individuals living in group quarters, and individuals who voted Democratic correlated significantly with COVID-19 attack rate as determined by Variable Importance Plots (VIPs).
Conclusions: The percentage of minorities per county correlated positively with cases in the earlier time period and negatively in the later time period, which complements previous research. In contrast, higher percentages of disabled individuals per county correlated negatively in the earlier time period. Counties with an above average percentage of group quarters experienced a high attack rate early which then diminished in significance after the primary vaccine rollout. Higher Democratic voting consistently correlated negatively with cases, coinciding with previous findings regarding a partisan divide in COVID-19 cases at the county level. Our findings can assist regional policymakers in distributing resources to more vulnerable counties in future pandemics based on SVI.
Copyright: © 2024 Moxley et al. This is an open access article distributed under the terms of the Creative Commons Attribution License, which permits unrestricted use, distribution, and reproduction in any medium, provided the original author and source are credited.
Conflict of interest statement
The authors have declared that no further competing interests exist.
Figures
Update of
-
Application of Elastic Net Regression for Modeling COVID-19 Sociodemographic Risk Factors.medRxiv [Preprint]. 2023 Jan 20:2023.01.19.23284288. doi: 10.1101/2023.01.19.23284288. medRxiv. 2023. Update in: PLoS One. 2024 Jan 26;19(1):e0297065. doi: 10.1371/journal.pone.0297065. PMID: 36711957 Free PMC article. Updated. Preprint.
Similar articles
-
Application of Elastic Net Regression for Modeling COVID-19 Sociodemographic Risk Factors.medRxiv [Preprint]. 2023 Jan 20:2023.01.19.23284288. doi: 10.1101/2023.01.19.23284288. medRxiv. 2023. Update in: PLoS One. 2024 Jan 26;19(1):e0297065. doi: 10.1371/journal.pone.0297065. PMID: 36711957 Free PMC article. Updated. Preprint.
-
Spatial and temporal trends in social vulnerability and COVID-19 incidence and death rates in the United States.PLoS One. 2021 Mar 24;16(3):e0248702. doi: 10.1371/journal.pone.0248702. eCollection 2021. PLoS One. 2021. PMID: 33760849 Free PMC article.
-
Spatial and temporal trends in social vulnerability and COVID-19 incidence and death rates in the United States.medRxiv [Preprint]. 2020 Sep 11:2020.09.09.20191643. doi: 10.1101/2020.09.09.20191643. medRxiv. 2020. Update in: PLoS One. 2021 Mar 24;16(3):e0248702. doi: 10.1371/journal.pone.0248702. PMID: 32935111 Free PMC article. Updated. Preprint.
-
Temporal trends in the association of social vulnerability and race/ethnicity with county-level COVID-19 incidence and outcomes in the USA: an ecological analysis.BMJ Open. 2021 Jul 22;11(7):e048086. doi: 10.1136/bmjopen-2020-048086. BMJ Open. 2021. PMID: 34301657 Free PMC article.
-
Comparison of National Vulnerability Indices Used by the Centers for Disease Control and Prevention for the COVID-19 Response.Public Health Rep. 2022 Jul-Aug;137(4):803-812. doi: 10.1177/00333549221090262. Epub 2022 May 5. Public Health Rep. 2022. PMID: 35514159 Free PMC article. Review.
Cited by
-
Automated Machine Learning Analysis of Patients With Chronic Skin Disease Using a Medical Smartphone App: Retrospective Study.J Med Internet Res. 2023 Nov 28;25:e50886. doi: 10.2196/50886. J Med Internet Res. 2023. PMID: 38015608 Free PMC article.
-
An elastic net regression model for predicting the risk of ICU admission and death for hospitalized patients with COVID-19.Sci Rep. 2024 Jun 22;14(1):14404. doi: 10.1038/s41598-024-64776-0. Sci Rep. 2024. PMID: 38909101 Free PMC article.
-
Using Machine Learning to Predict Weight Gain in Adults: an Observational Analysis From the All of Us Research Program.J Surg Res. 2025 Feb;306:43-53. doi: 10.1016/j.jss.2024.11.042. Epub 2024 Dec 31. J Surg Res. 2025. PMID: 39742657
References
-
- The New York Times. Coronavirus in the U.S.: Latest Map and Case Count; 2022. The New York Times.
-
- Centers for Disease Control and Prevention. COVID-19 Vaccines Work; 2022. COVID-19. - PubMed
-
- Bollyky TJ, Hulland EN, Barber RM, Collins JK, Kiernan S, Moses M, et al.. Pandemic preparedness and COVID-19: an exploratory analysis of infection and fatality rates, and contextual factors associated with preparedness in 177 countries, from Jan 1, 2020, to Sept 30, 2021. The Lancet. 2022;399(10334):1443–1445. doi: 10.1016/S0140-6736(22)00172-6 - DOI - PMC - PubMed
MeSH terms
Grants and funding
LinkOut - more resources
Full Text Sources
Medical
