

Antibody-mediated SARS-CoV-2 entry in cultured cells
- PMID: 38277394
- PMCID: PMC10702815
- DOI: 10.15252/embr.202357724
Antibody-mediated SARS-CoV-2 entry in cultured cells
Abstract
Severe acute respiratory syndrome coronavirus 2 (SARS-CoV-2) enters host cells by first engaging its cellular receptor angiotensin converting enzyme 2 (ACE2) to induce conformational changes in the virus-encoded spike protein and fusion between the viral and target cell membranes. Here, we report that certain monoclonal neutralizing antibodies against distinct epitopic regions of the receptor-binding domain of the spike can replace ACE2 to serve as a receptor and efficiently support membrane fusion and viral infectivity in vitro. These receptor-like antibodies can function in the form of a complex of their soluble immunoglobulin G with Fc-gamma receptor I, a chimera of their antigen-binding fragment with the transmembrane domain of ACE2 or a membrane-bound B cell receptor, indicating that ACE2 and its specific interaction with the spike protein are dispensable for SARS-CoV-2 entry. These results suggest that antibody responses against SARS-CoV-2 may help expand the viral tropism to otherwise nonpermissive cell types with potential implications for viral transmission and pathogenesis.
Keywords: SARS-CoV-2; antibody; receptor; viral entry.
© 2023 The Authors.
Conflict of interest statement
The authors declare that they have no conflict of interest.
Figures
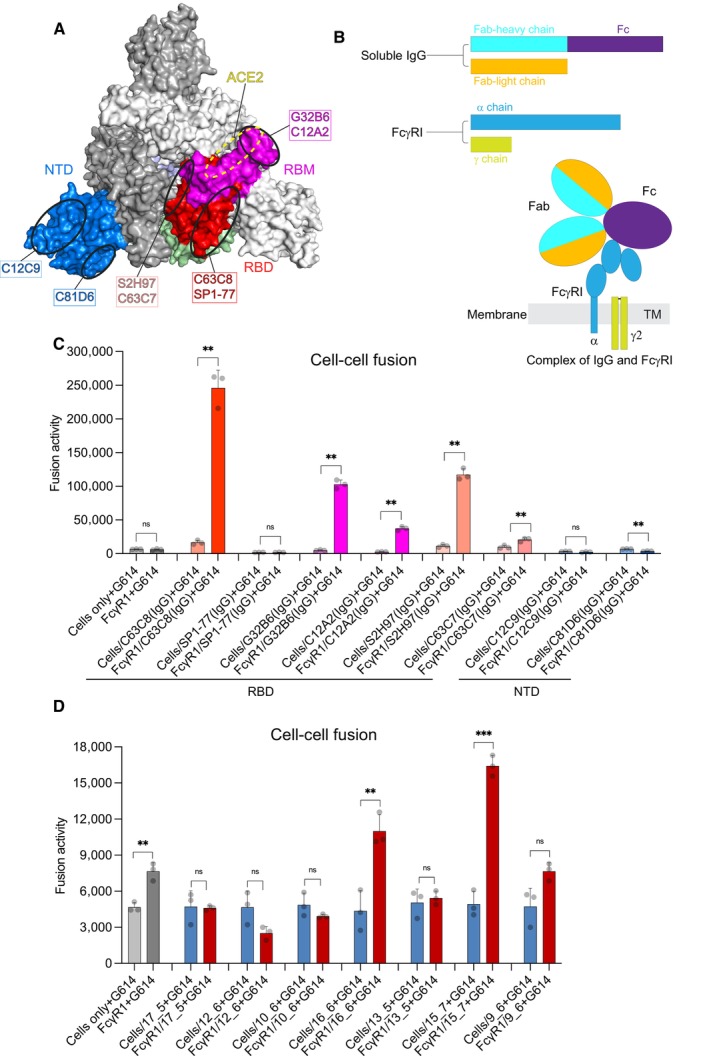
Binding site locations of selected monoclonal antibodies and ACE2 binding site. Surface regions of the SARS‐CoV‐2 spike trimer in a top view targeted by eight selected antibodies on the RBD and NTD are highlighted by ellipses. Various domains of one protomer are colored (RBM in magenta, the rest of RBD in red and NTD in blue); the other two protomers in white and gray, respectively. The ACE2 binding site is marked with a yellow dashed line.
Schematic representation of antibody IgG (heavy and light chains) and FcγRI (α and γ chains) constructs, as well as a diagram for how FcγRI captures an IgG antibody on the surface of membrane based on the crystal structure PDB ID: 4W4O (Kiyoshi et al, 2015).
HEK293T cells with or without expressing FcγRI were decorated with eight selected monoclonal antibodies and tested for membrane fusion with the full‐length G614 S protein expressing cells in our standard cell–cell fusion assay. Cell–cell fusion led to reconstitution of α and ω fragments of β‐galactosidase yielding an active enzyme and thus the fusion activity was quantified by a chemiluminescent assay. Cells only and cells expressing FcγRI with no antibody added were negative controls. The experiment with three technical replicates (n = 3) was repeated three times with similar results, and one representative experiment is shown. Each dot represents a technical replicate. Error bars, mean ± s.d.
The cell–cell fusion assay was used to analyze seven polyclonal IgG antibodies purified from serum samples of vaccinated convalescent individuals reported previously (Chen et al, 2022). The experiment with three technical replicates (n = 3) was repeated twice with similar results, and one representative experiment is shown. Each dot represents a technical replicate. Error bars, mean ± s.d.
Titration of C63C8 concentration in the assay for antibody/FcγRI mediated cell–cell fusion. HEK293T cells expressing FcγRI were decorated with C63C8 IgG at various concentrations and tested for membrane fusion with the full‐length G614 S protein expressing cells. Cell–cell fusion led to reconstitution of α and ω fragments of β‐galactosidase yielding an active enzyme and thus the fusion activity was quantified by a chemiluminescent assay. The experiment with three technical replicates (n = 3) each was repeated three times with similar results, and one representative experiment is shown. Each dot represents a technical replicate. Error bars, mean ± s.d.
The cell–cell fusion assay was used to analyze serum samples from 10 convalescent individuals, collected between May 2020 and April 2021. A serum sample for an uninfected healthy individual was used as a control. The ID50 and ID80 values were determined using a pseudovirus‐based neutralization assay (Xiao et al, 2021). The experiment with three technical replicates (n = 3) each was repeated three times with similar results, and one representative experiment is shown. Each dot represents a technical replicate. Error bars, mean ± s.d.
Cell–cell fusion of S‐expressing and FcγRI‐expressing cells decorated with monoclonal antibodies SP1‐77, C12C9 or C81D6 detected by our β‐galactosidase‐based cell–cell fusion assay. The wildtype ACE2 and C63C8 IgG were positive controls. The experiment with three technical replicates (n = 3) each was repeated twice with similar results, and one representative experiment is shown. Each dot represents a technical replicate. Error bars, mean ± s.d.
Images of cell association 15 min after S‐expressing and FcγRI‐expressing cells decorated with monoclonal antibodies SP1‐77, C12C9 or C81D6 were mixed, as indicated. Scale bar in black, 50 μm.
Schematic representation of the full‐length human ACE2 and design of antibody‐based expression constructs. Various segments for ACE2 include: catalytic peptidase domain, neck domain; TM, transmembrane anchor; and CT, cytoplasmic tail. Expression constructs of antibody‐ACE2 chimera, the Fab heavy chain of an antibody is fused with the neck domain, TM and CT of ACE2, coexpressed with the Fab light chain. A diagram showing how Fab is presented on the cell surfaces by the ACE2 TM anchor.
Expression of the endogenous ACE2 was monitored, by Western blot using an antibody recognizing the catalytic domain of ACE2, when cells were transfected with various antibody‐ACE2t constructs. Bands for the wildtype ACE2 and the sample loading control β‐actin are indicated.
Images of cell association 15 min after S‐expressing and antibody‐ACE2t‐expressing cells were mixed, as indicated. Scale bar in black, 50 μm.
HEK293T cells transfected with eight different antibody‐ACE2 chimeric constructs were tested for membrane fusion with the full‐length S protein (G614 or Omicron subvariant BA.2) expressing cells in the β‐galactosidase‐based cell–cell fusion assay. The wildtype ACE2 was a positive control; no receptor/no S a negative control. The experiment with four technical repeats (n = 4) was repeated at least three times with similar results, and one representative experiment is shown. Each dot represents a technical replicate. Error bars, mean ± s.d.
Infection of HEK293T cells transfected with either ACE2 or various antibody‐ACE2 chimeric constructs by HIV‐based pseudotyped viruses using the full‐length G614 and BA.1 S constructs in a single cycle. Empty vector was used as a negative control. The experiment with two technical replicates (n = 2) was repeated three times with similar results, and one representative experiment is shown. Each dot represents a technical replicate. G614 and BA.1 data are individually normalized according to their measurement with the wildtype ACE2 receptor.
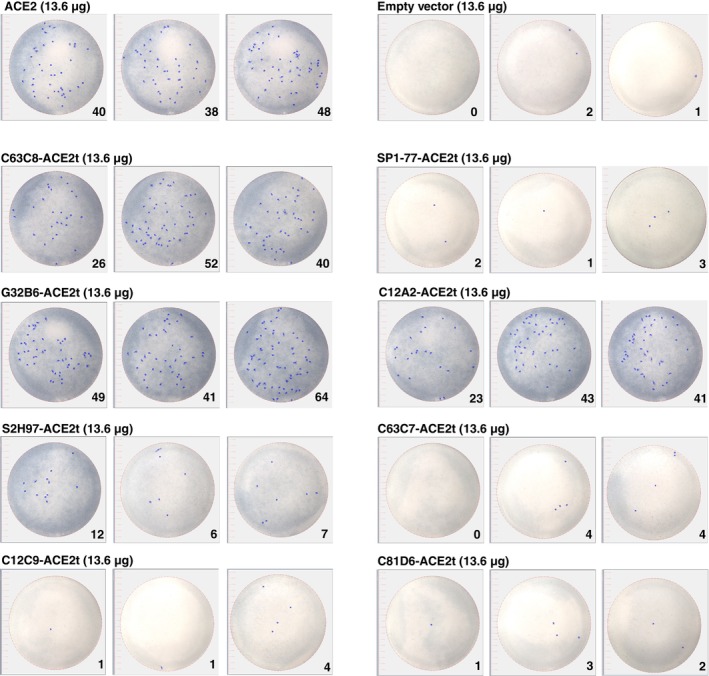
Virus foci in MDCK cells transfected with either ACE2 or various antibody‐ACE2 chimeric constructs followed by infection of the authentic SARS‐CoV‐2 G614 isolate. Empty vector was used as a negative control. The experiment with three technical replicates (n = 3) was repeated three times with similar results, and one representative experiment is shown. Each dot represents a technical replicate. Error bars, mean ± s.d.
Schematic representation of the C‐terminally GFP‐tagged full‐length human ACE2 and antibody‐ACE2t expression constructs.
HEK293T cells transfected with GFP‐tagged ACE2 and eight different GFP‐tagged antibody‐ACE2t constructs were tested for membrane fusion with the full‐length S protein (G614 or Omicron subvariant BA.2) expressing cells in the β‐galactosidase‐based cell–cell fusion assay. The GFP‐tagged ACE2 was a positive control and no receptor/no S a negative control. The experiment with four technical replicates (n = 4) was repeated twice with similar results, and one representative experiment is shown. Each dot represents a technical replicate. Error bars, mean ± s.d.
Expression levels of GFP‐tagged constructs were quantified by flow cytometry. The experiment with two technical replicates (n = 2) was repeated twice with similar results, and one representative experiment is shown. Each dot represents a technical replicate.
Expression levels of GFP‐tagged constructs were quantified using an anti‐Fab secondary antibody conjugated with a dye by flow cytometry. The experiment with two technical replicates (n = 2) was repeated twice with similar results, and one representative experiment is shown. Each dot represents a technical replicate.
Schematic representation of the membrane‐bound B cell receptor (BCR) expression constructs and a diagram showing how Fab is presented on the cell surfaces by the BCR TM anchor.
HEK293T cells transfected with eight different membrane‐bound BCR constructs were tested for membrane fusion with the full‐length S protein (G614 or Omicron subvariant BA.2) expressing cells in the β‐galactosidase‐based cell–cell fusion assay. The wildtype ACE2 was a positive control and no receptor/no S a negative control. The experiment with four technical replicates (n = 4) was repeated twice with similar results, and one representative experiment is shown. Each dot represents a technical replicate. Error bars, mean ± s.d.
Infection of HEK293T cells transfected with either ACE2 or various BCR constructs by HIV‐based pseudotyped viruses using the full‐length G614 and Omicron BA.1 S constructs in a single cycle. Empty vector was used as a negative control. The experiment with two technical replicates (n = 2) was repeated twice with similar results, and one representative experiment is shown. Each dot represents a technical replicate. G614 and BA.1 data are individually normalized according to their measurement with the wildtype ACE2 receptor.
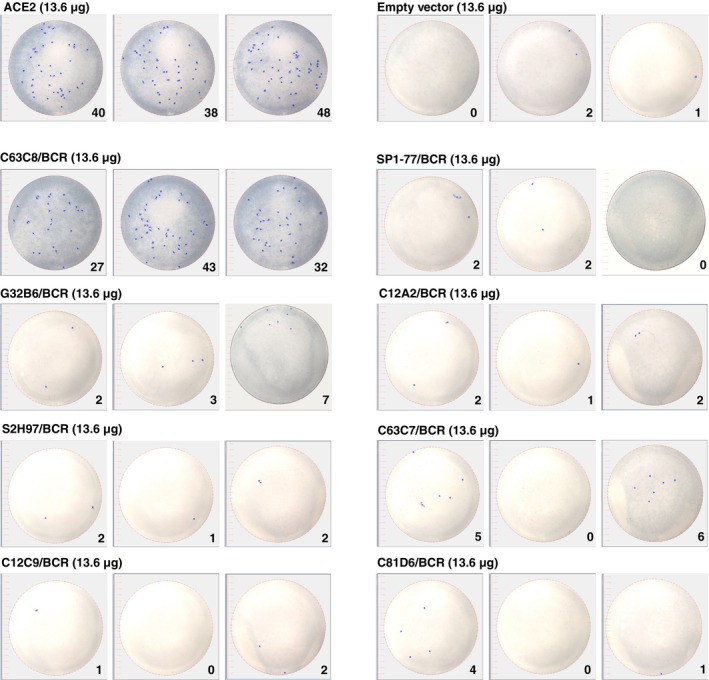
Virus foci in MDCK cells transfected with either ACE2 or various BCR constructs followed by infection of the authentic SARS‐CoV‐2 G614 isolate. Empty vector was used as a negative control. The experiment with three technical replicates (n = 3) each was repeated three times with similar results, and one representative experiment is shown. Each dot represents a technical replicate. Error bars, mean ± s.d.
Expression of the endogenous ACE2 was monitored, by Western blot using an antibody recognizing the catalytic domain of ACE2, when cells were transfected with various BCR constructs. Bands for the wildtype ACE2 and the sample loading control β‐actin are indicated.
Expression levels of BCR constructs were quantified using an anti‐Fab secondary antibody conjugated with a dye by flow cytometry. The experiment with two technical replicates (n = 2) each was repeated twice with similar results, and one representative experiment is shown. Each dot represents a technical replicate.
- A, B
Inhibition of viral infectivity by protease inhibitors. Pseudovirus (G614 S) infection of HEK293T cells transfected with ACE2 or antibody constructs with/without TMPRSS2 were treated with either E‐64d (a cathepsin L inhibitor) or Camostat (TMPRSS2 inhibitor). DMSO, organic solvent used to dissolve E‐64d. The experiment with two technical replicates (n = 2) each was repeated three times with similar results, and one representative experiment is shown. Each dot represents a technical replicate.
- C–E
Antibody neutralization of pseudoviruses containing the G614 S protein was determined using IgG antibodies (C63C8 and SP1‐77 in red, S2H97 and C63C7 in light red; G32B6 and C12A2 in magenta; and C12C9 in blue) with ACE2 (in C), C63C8‐ACE2t (in D) and C63C8/BCR (in E) stable cell lines. Percent neutralization was calculated from average relative light units (RLUs) from duplicate wells (technical replicates). Assays were performed twice with similar results.
Similar articles
-
V367F Mutation in SARS-CoV-2 Spike RBD Emerging during the Early Transmission Phase Enhances Viral Infectivity through Increased Human ACE2 Receptor Binding Affinity.J Virol. 2021 Jul 26;95(16):e0061721. doi: 10.1128/JVI.00617-21. Epub 2021 Jul 26. J Virol. 2021. PMID: 34105996 Free PMC article.
-
Competitive SARS-CoV-2 Serology Reveals Most Antibodies Targeting the Spike Receptor-Binding Domain Compete for ACE2 Binding.mSphere. 2020 Sep 16;5(5):e00802-20. doi: 10.1128/mSphere.00802-20. mSphere. 2020. PMID: 32938700 Free PMC article.
-
Structural Basis of a Human Neutralizing Antibody Specific to the SARS-CoV-2 Spike Protein Receptor-Binding Domain.Microbiol Spectr. 2021 Oct 31;9(2):e0135221. doi: 10.1128/Spectrum.01352-21. Epub 2021 Oct 13. Microbiol Spectr. 2021. PMID: 34643438 Free PMC article.
-
Angiotensin-Converting Enzyme 2 (ACE2) in the Pathogenesis of ARDS in COVID-19.Front Immunol. 2021 Dec 22;12:732690. doi: 10.3389/fimmu.2021.732690. eCollection 2021. Front Immunol. 2021. PMID: 35003058 Free PMC article. Review.
-
Single domain antibodies derived from ancient animals as broadly neutralizing agents for SARS-CoV-2 and other coronaviruses.Biomed Eng Adv. 2022 Dec;4:100054. doi: 10.1016/j.bea.2022.100054. Epub 2022 Sep 18. Biomed Eng Adv. 2022. PMID: 36158162 Free PMC article. Review.
Cited by
-
Design of customized coronavirus receptors.Nature. 2024 Nov;635(8040):978-986. doi: 10.1038/s41586-024-08121-5. Epub 2024 Oct 30. Nature. 2024. PMID: 39478224 Free PMC article.
-
Facilitating and restraining virus infection using cell-attachable soluble viral receptors.Proc Natl Acad Sci U S A. 2024 Nov 5;121(45):e2414583121. doi: 10.1073/pnas.2414583121. Epub 2024 Oct 31. Proc Natl Acad Sci U S A. 2024. PMID: 39480852 Free PMC article.
-
RBD mutations at the residues K417, E484, N501 reduced immunoreactivity with antisera from vaccinated and COVID-19 recovered patients.Drug Target Insights. 2024 May 31;18:20-26. doi: 10.33393/dti.2024.3059. eCollection 2024 Jan-Dec. Drug Target Insights. 2024. PMID: 38860262 Free PMC article.
-
The role of IL-22 in cancer.Med Oncol. 2024 Sep 5;41(10):240. doi: 10.1007/s12032-024-02481-8. Med Oncol. 2024. PMID: 39231878 Review.
-
SARS-CoV-2 spike protein: structure, viral entry and variants.Nat Rev Microbiol. 2025 Jul;23(7):455-468. doi: 10.1038/s41579-025-01185-8. Epub 2025 May 6. Nat Rev Microbiol. 2025. PMID: 40328900 Review.
References
MeSH terms
Substances
Grants and funding
LinkOut - more resources
Full Text Sources
Medical
Miscellaneous
