. 2024 Jan 26;9(91):eade6924.
doi: 10.1126/sciimmunol.ade6924. Epub 2024 Jan 26.

Sulfated bile acid is a host-derived ligand for MAIT cells

Affiliations

Sulfated bile acid is a host-derived ligand for MAIT cells

Emi Ito et al. Sci Immunol. .

Abstract

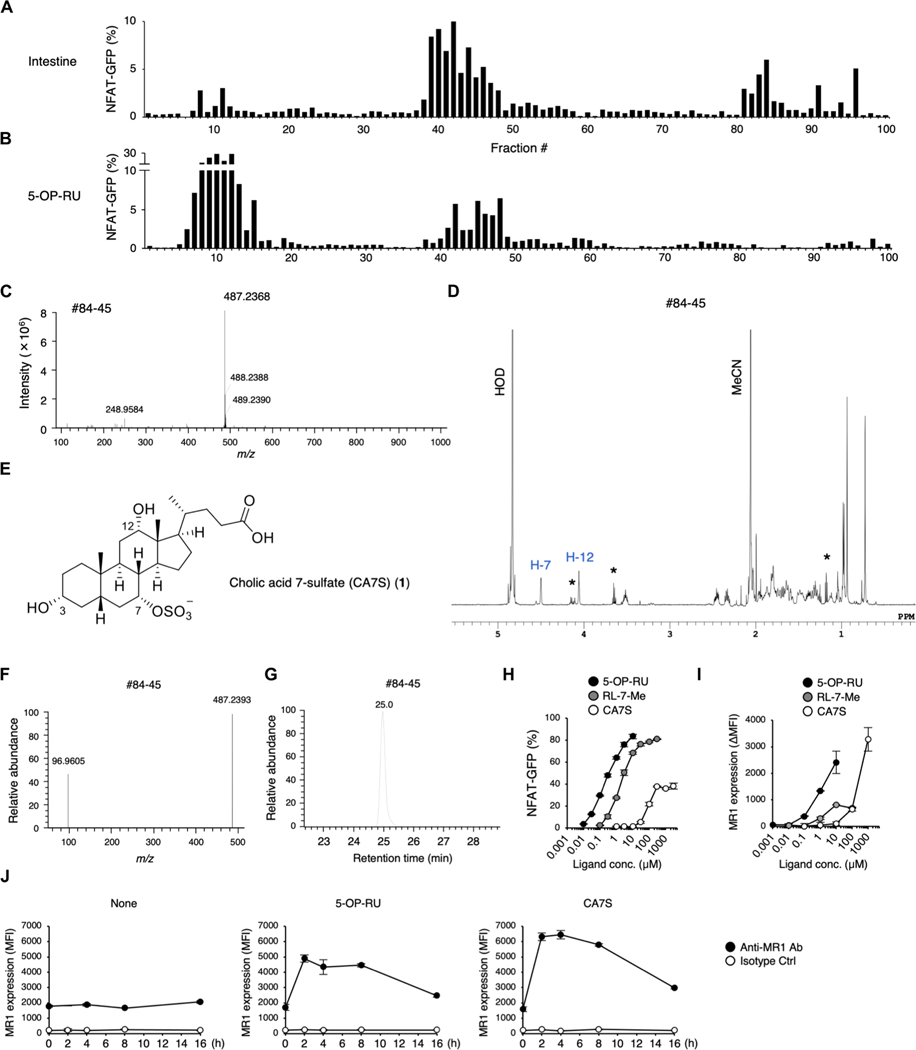
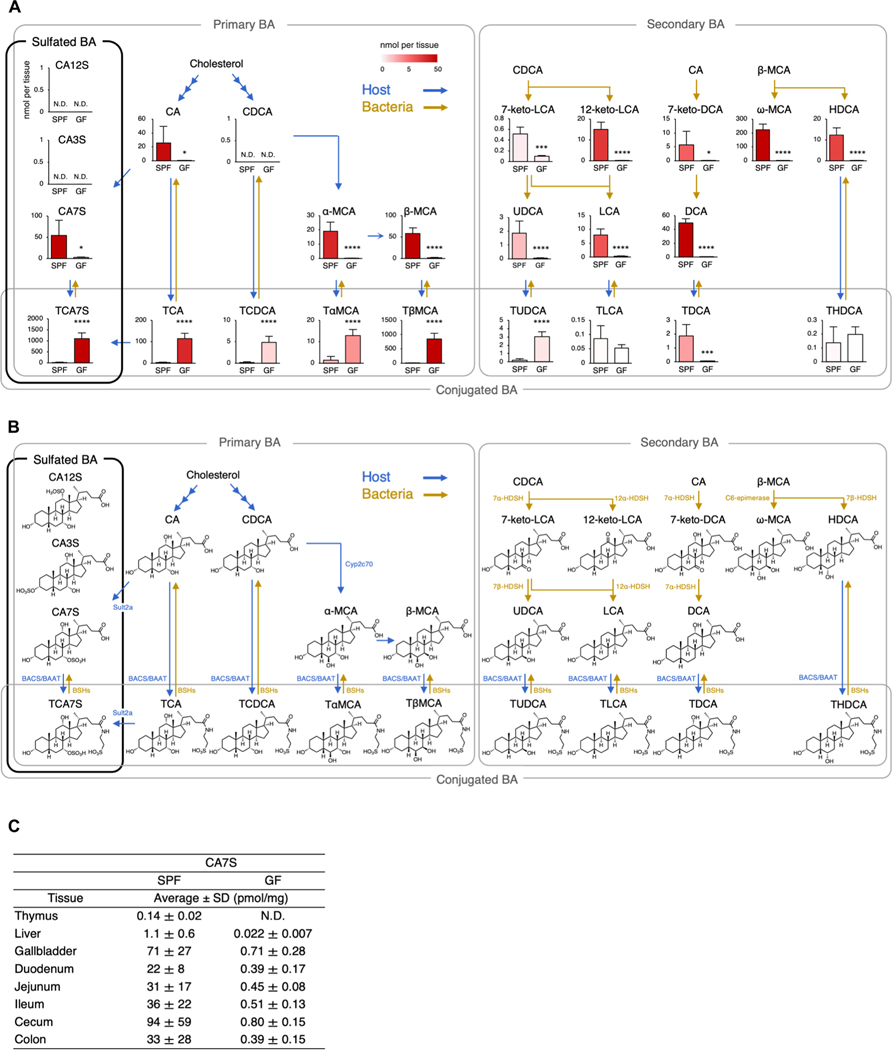
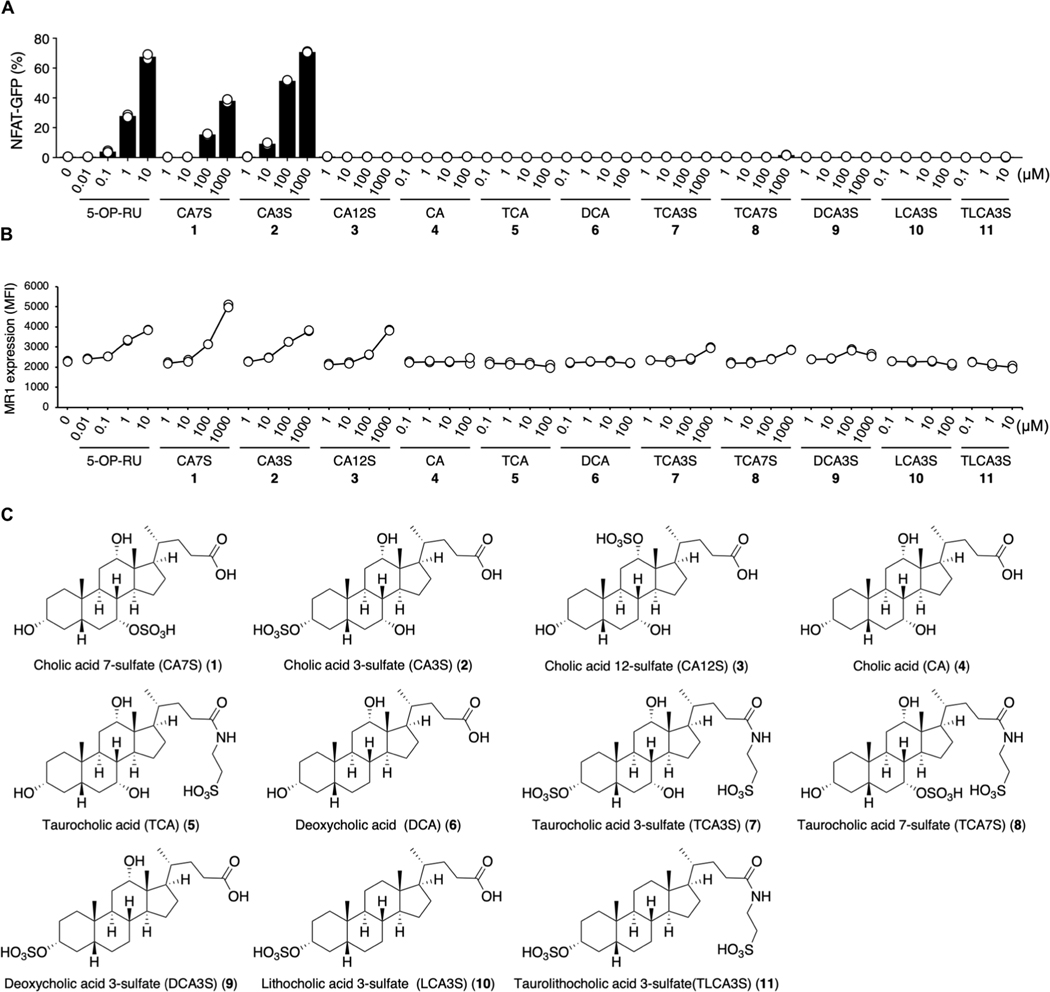
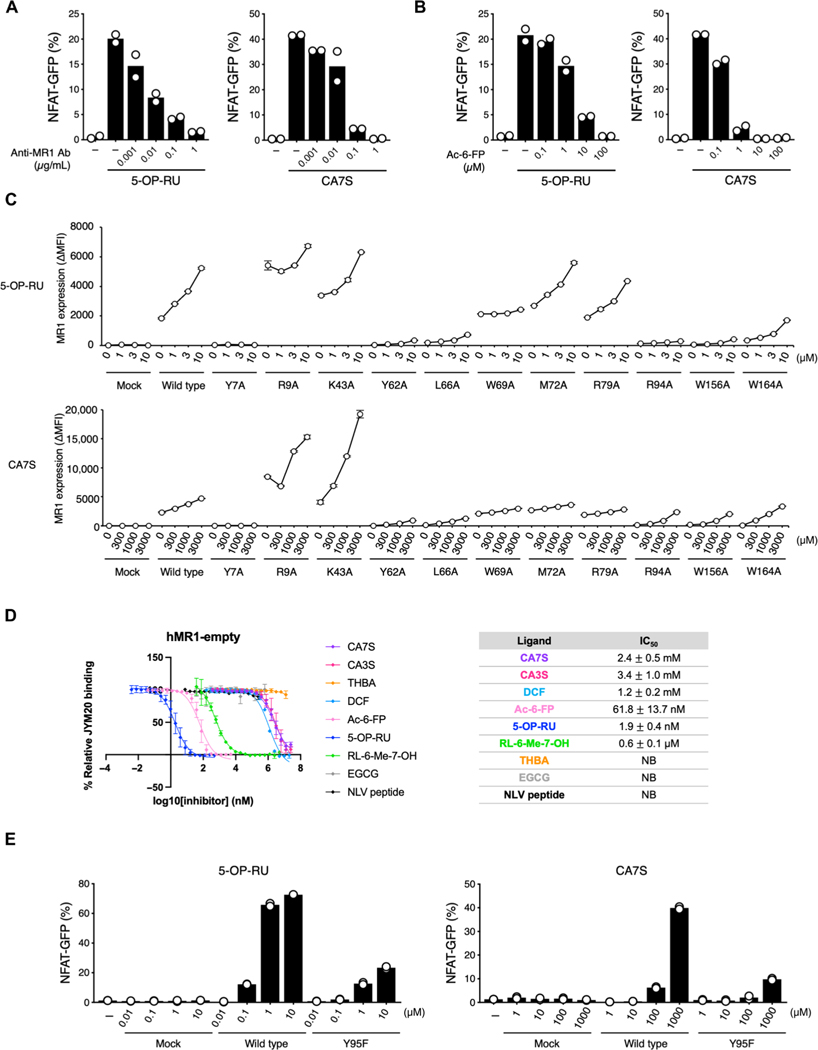
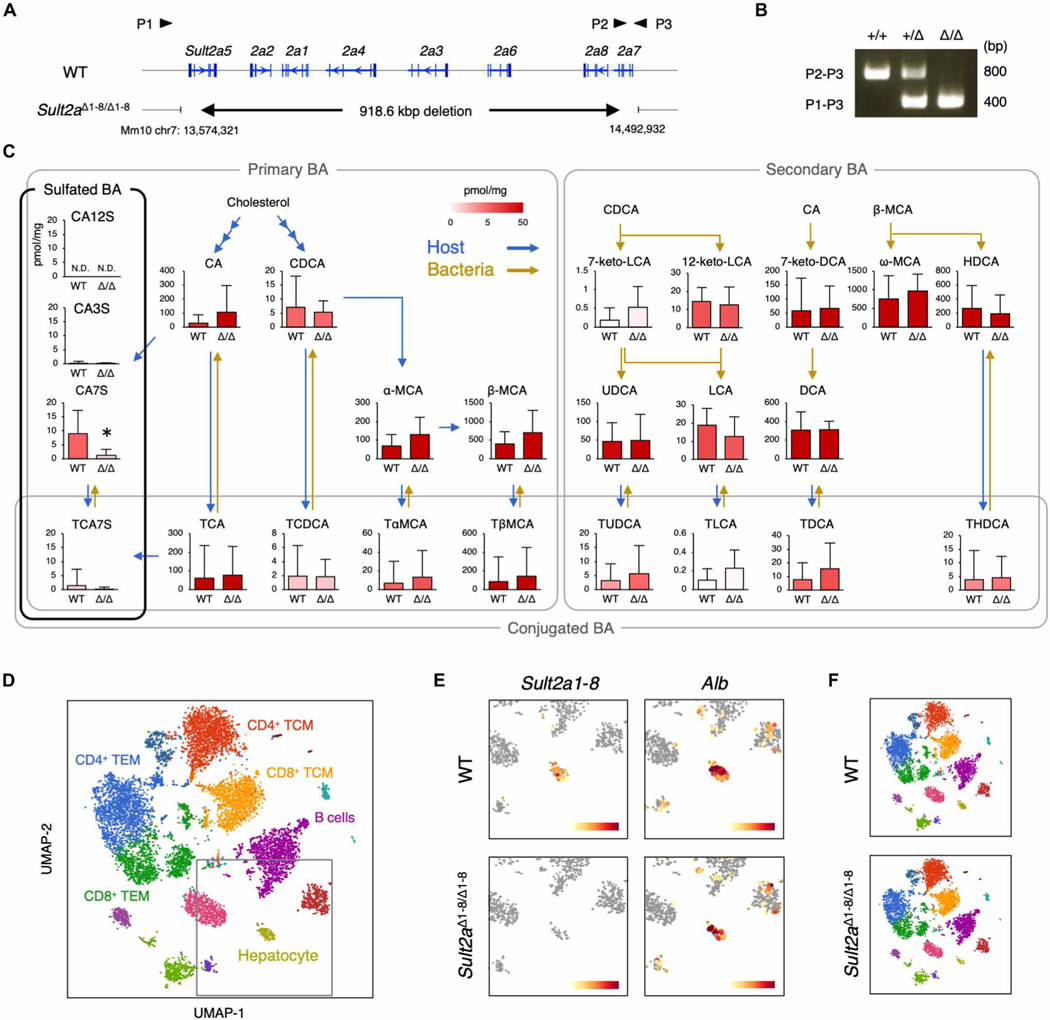
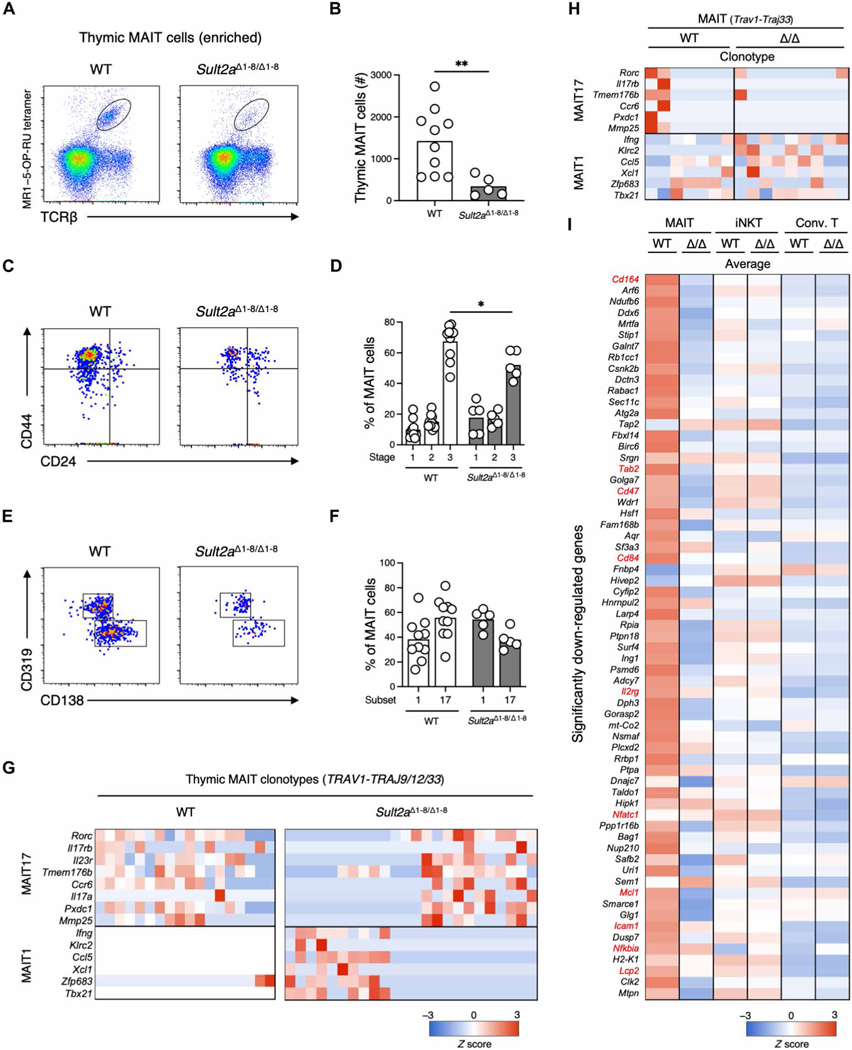
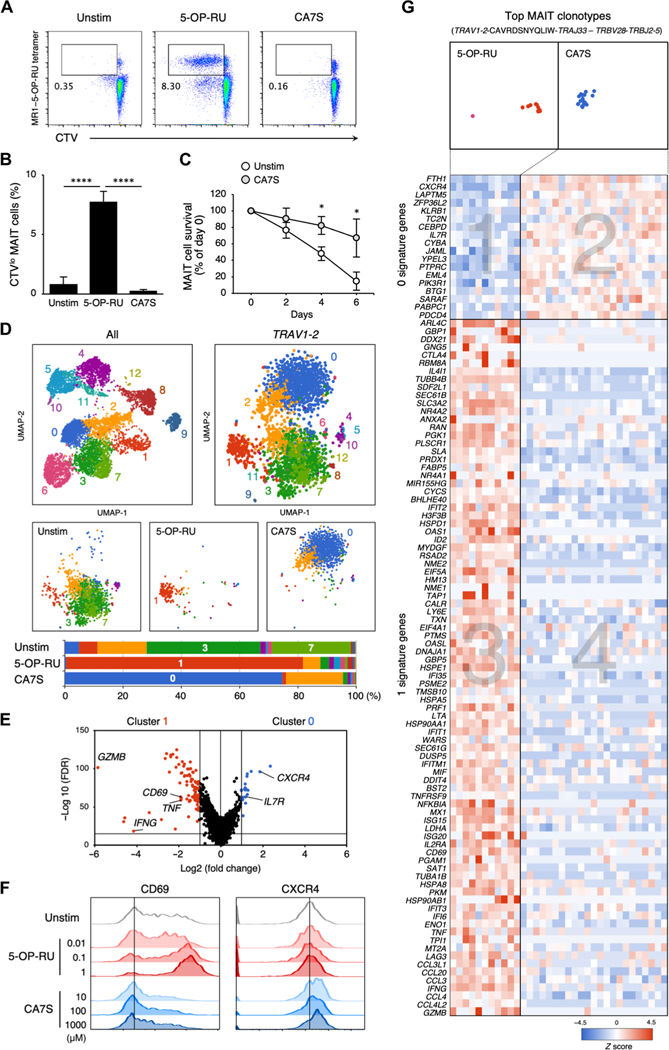
Mucosal-associated invariant T (MAIT) cells are innate-like T cells that recognize bacterial riboflavin-based metabolites as activating antigens. Although MAIT cells are found in tissues, it is unknown whether any host tissue-derived antigens exist. Here, we report that a sulfated bile acid, cholic acid 7-sulfate (CA7S), binds the nonclassical MHC class I protein MR1 and is recognized by MAIT cells. CA7S is a host-derived metabolite whose levels were reduced by more than 98% in germ-free mice. Deletion of the sulfotransferase 2a family of enzymes (Sult2a1-8) responsible for CA7S synthesis reduced the number of thymic MAIT cells in mice. Moreover, recognition of CA7S induced MAIT cell survival and the expression of a homeostatic gene signature. By contrast, recognition of a previously described foreign antigen, 5-(2-oxopropylideneamino)-6-d-ribitylaminouracil (5-OP-RU), drove MAIT cell proliferation and the expression of inflammatory genes. Thus, CA7S is an endogenous antigen for MAIT cells, which promotes their development and function.


Conflict of interest statement

Competing interests: J.R., J.Y.W.M., and D.P.F. are coinventors on patents describing MR1 tetramers and MR1-ligand complexes. All other authors declare that they have no competing financial interests.

Figures

Fig. 1.
Fig. 1.. Purification and structural determination of a ligand for MAIT cells.
(A and B) Screening of MAIT cell agonists from mouse intestine. NFAT-GFP reporter cells expressing MAIT TCR and MR1 were stimulated with HPLC-separated fractions from SPF mouse intestine (A) and freshly prepared 5-OP-RU as a control (B) for 16 to 20 hours and analyzed by flow cytometry. (C and D) HRMS (C) and 1H NMR spectra (600 MHz, D2O) (D) of fraction #84–45 from SPF mice intestine. In (D), impurities are denoted by asterisks. (E) Chemical structure of CA7S. (F and G) HRMS/MS spectra (F) and extracted ion chromatogram (G) of fraction #84–45. (H and I) NFAT-GFP reporter cells were stimulated with 5-OP-RU, RL-7-Me, and CA7S. Percentages of GFP+ cells (H) and MR1 expression (I) were analyzed at 20 and 6 hours after stimulation, respectively. MR1 surface expression is presented as mean fluorescence intensity (MFI) values of stimulated cells subtracted by those of vehicle-treated unstimulated cells (ΔMFI). (J) MR1 surface expression at 0, 2, 4, 8, and 16 hours after stimulation with vehicle control (None), 5-OP-RU, or CA7S. (H to J) Data are presented as the means ± SD of triplicate assays and are representative of more than two independent experiments.
Fig. 2.
Fig. 2.. Decrease in the level of CA7S in GF mice.
(A) Quantification of bile acid metabolites in the cecum and cecal contents from SPF and GF mice. Blue and yellow arrows indicate host- and bacteria-mediated enzymatic responses, respectively. N.D., not detected (<0.010 nmol per tissue). (B) Metabolic pathway map of bile acids in mice, related to (A). Sult, sulfotransferase; HDSH, hydroxysteroid dehydrogenase; BAAT, bile acid–CoA:amino acid N-acyltransferase; BACS, bile acid–CoA synthetase; Cyp, cytochrome P450; BSHs, bile salt hydrolases. (C) Tissue distribution of CA7S in various tissues of SPF and GF mice. N.D., not detected (<0.010 pmol/mg). (A and C) Data are presented as the means ± SD from experiments with three or more mice per group and are representative of two independent experiments. *P < 0.05, ***P < 0.005, and ****P < 0.001 by two-tailed, unpaired Student’s t tests with Benjamini-Hochberg correction.
Fig. 3.
Fig. 3.. Structure-activity relationship of bile acid metabolites for MAIT cell activation.
(A and B) MAIT TCR activation assays using NFAT-GFP reporter cells expressing mouse MAIT TCR and MR1. Reporter cells were stimulated with vehicle control, 5-OP-RU, and analogs of CA7S (1); cholic acid 3-sulfate (CA3S: 2), cholic acid 12-sulfate (CA12S: 3), cholic acid (CA: 4), taurocholic acid (TCA: 5), deoxycholic acid (DCA: 6), taurocholic acid 3-sulfate (TCA3S: 7), taurocholic acid 7-sulfate (TCA7S: 8), deoxycholic acid 3-sulfate (DCA3S: 9), lithocholic acid 3-sulfate (LCA3S: 10), and taurolithocholic acid 3-sulfate (TLCA3S: 11). Because of their inherent cell toxicity as surfactants, several bile acids were added at lower concentrations (4, 5, 6, 10, and 11). Some water-insoluble bile acids (4, 5, 6, and 10) were coated on plates as described (81). Compound 11 was added as dimethyl sulfoxide solution because of its insolubility in both water and organic solvents. NFAT-GFP (A) and MR1 (B) expressions were evaluated at 20 and 6 hours after stimulation, respectively. (C) Structural formula of bile acid analogs related to (A) and (B). (A and B) Data are presented as individual values of duplicate assays and are representative of more than two independent experiments.
Fig. 4.
Fig. 4.. Binding mode of CA7S to MR1 and MAIT TCR.
(A and B) Inhibition assay of 5-OP-RU (0.5 μM) and CA7S (500 μM) by anti-MR1 Ab (26.5) (A) or Ac-6-FP (B). Percentages of GFP+ cells were shown. (C) Effect of hMR1 mutations (Y7A, R9A, K43A, Y62A, L66A, W69A, M72A, R79A, R94A, W156A, and W164A) on the recognition of ligands. Cells expressing hMR1 mutants and a MAIT TCR were stimulated with vehicle control, 5-OP-RU, or CA7S and analyzed by flow cytometry after 6 hours. MR1 expression was shown as MFI of anti-MR1 staining subtracted by isotype control. (D) MR1-restricted ligand affinities (IC50) determined by FP assay (31). Left: Titration curves of strong MR1 binders (5-OP-RU and Ac-6-FP), moderate MR1 binder (RL-6-Me-7-OH), weak MR1 binders (CA7S, CA3S, and DCF), and MR1 nonbinding substances [epigallocatechin gallate (EGCG) and NLV peptide] are displayed. Tetrahydroxy bile acid (THBA) was used as a bile acid control with similar hydrophilicity to CA7S and CA3S. The table represents a summary of IC50 for all investigated compounds. (E) Effect of MAIT TCRα mutation on ligand recognition. Reporter cells transfected with vector alone (Mock), MAIT TCRβ together with WT MAIT TCRα (WT), or mutant TCRα (Y95F) were stimulated with vehicle control, 5-OP-RU, or CA7S and analyzed after 20 hours. (C and D) Data are presented as the means ± SD of triplicate assays. (A, B, and E) Data are presented as individual values of duplicate assays. All data are representative of at least two independent experiments. NB, no binding.
Fig. 5.
Fig. 5.. Generation of Sult2aΔ1–8/Δ1–8 mice.
(A) Gene-targeting strategy for Sult2aΔ1–8/Δ1–8 mice. P1, P2, and P3 indicate primers used for genomic PCR. (B) Genotyping PCR of Sult2a+/+, Sult2a+/Δ1–8, and Sult2aΔ1–8/Δ1–8 mice. (C) Quantification of bile acid metabolites in feces from WT and Sult2aΔ1–8/Δ1–8 mice. Blue and yellow arrows indicate host- and bacteria-mediated enzymatic responses, respectively. (D) UMAP projection based on sc-RNA-seq of density-fractionated liver cell suspensions from WT and Sult2aΔ1–8/Δ1–8 mice. Erythrocytes expressing Hbb-bs above 1.8 were excluded in the process of analysis. (E) Expression of Sult2a1–8 (left) and Alb (right) in the hepatocyte clusters derived from WT (top) and Sult2aΔ1–8/Δ1–8 (bottom) mice. (F) UMAP projection of WT (top) and Sult2aΔ1–8/Δ1–8 (bottom) mice. (C) Data are presented as the means ± SD from experiment with six or more mice per group. (D to F) Data are from experiments with three mice per group. (C) A direct product of SULT2A, CA7S, was analyzed by two-tailed, unpaired Student’s t tests (*P < 0.05). For all other bile acid metabolites, P values were adjusted with Benjamini-Hochberg correction (FDR < 0.05).
Fig. 6.
Fig. 6.. Impaired MAIT cell development in Sult2aΔ1–8/Δ1–8 mice.
(A to F) Flow cytometry analysis of MAIT cells among MR1–5-OP-RU tetramer-enriched thymocytes from 3- to 4-week-old WT and Sult2aΔ1–8/Δ1–8 mice. (A) Representative flow cytometry dot plots of MR1–5-OP-RU tet+TCRβ+ MAIT cells in thymocytes. (B) Absolute number of thymic MAIT cells in WT and Sult2aΔ1–8/Δ1–8 mice. (C) Representative CD44 and CD24 expression in MAIT cells from WT (left) and Sult2aΔ1–8/Δ1–8 (right) mice. (D) Frequency of stage 1 (CD44CD24+), stage 2 (CD44CD24), and stage 3 (CD44+CD24) MAIT cells in WT and Sult2aΔ1–8/Δ1–8 mice. (E) Representative CD319 and CD138 expression in CD44+CD24 MAIT cells in WT (left) and Sult2aΔ1–8/Δ1–8 (right) mice. (F) Frequency of MAIT17 cells (CD138+) and MAIT1 cells (CD319+) in WT and Sult2aΔ1–8/Δ1–8 mice. (G and H) Heatmap of mRNA expression of MAIT1 and 17 signature genes in canonical MAIT cells (Trav1-Traj9/12/33) in the (G) thymi and (H) livers of WT and Sult2aΔ1–8/Δ1–8 mice. (I) Heatmap of mRNA expression in canonical MAIT cells (Trav1-Traj9/12/33), canonical iNKT cells (Trav11-Traj18), and conventional T cells in the liver of WT and Sult2aΔ1–8/Δ1–8 mice. The genes significantly down-regulated in Trav1-expressing cells from Sult2aΔ1–8/Δ1–8 mice (P < 0.05) compared with those from WT mice are shown. The gene expression levels are shown as average values. Data are from experiments with three or more mice per group. *P < 0.05 and **P < 0.01 by two-tailed, unpaired Student’s t tests or one-way ANOVA followed by Tukey’s multiple comparison test.
Fig. 7.
Fig. 7.. Responses of human MAIT cell to CA7S.
(A and B) Human PBMCs were labeled with CTV and stimulated with vehicle control (Unstim), 5-OP-RU (10 μM), or CA7S (1000 μM) in the absence of cytokines on day 6. Representative flow cytometry dot plots of proliferating CD3+MR1–5-OP-RU tet+CTVlo MAIT cells (A). Proportion of MR1–5-OP-RU tet+CTVlo MAIT cells in CD3+-gated cells (B). (C) Survival ratio of MAIT cells stimulated with 1000 μM CA7S (CA7S) or left unstimulated (Un-stim). (D and E) Sc-RNA-seq of CD3+CD161+MR1–5-OP-RU tet+ MAIT cells stimulated with vehicle control (Unstim), 5-OP-RU (10 μM), or CA7S (1000 μM) for 24 hours. UMAP based on mRNA expression was performed on all isolated cells (top left). UMAPs of Trav1–2+ cells (top right) were separately shown for different stimuli (Unstim, 5-OP-RU, and CA7S) (middle). Proportions of the clusters in Trav1–2+ cells of each group are shown as bar graphs (bottom) (D). Volcano plot of mRNA expression comparing the characteristic clusters of 5-OP-RU stimulation (cluster 1) and CA7S stimulation (cluster 0) (E). (F) Surface expression of CD69 and CXCR4 after CA7S stimulation. PBMCs were stimulated with indicated concentrations of 5-OP-RU (red) or CA7S (blue), and surface expression of CD69 and CXCR4 within CD3+CD161+MR1–5-OP-RU tet+ MAIT cells was determined at day 9. (G) Heatmap of mRNA expression in the most frequent MAIT clonotypes (TRAV1–2-CAVRDSNYQLIW-TRAJ33TRBV28-TRBJ2–5). The genes with differential expression between clusters 1 and 0 in (E) are shown. (B and C) Data are presented as the means ± SD of triplicate assays, and (A), (B), (C), and (E) are representative of more than three independent experiments. *P < 0.05 and ****P < 0.001 by two-tailed, unpaired Student’s t tests with Benjamini-Hochberg correction or one-way ANOVA followed by Tukey’s multiple comparison test.

References

    1. Godfrey DI, Koay HF, McCluskey J, Gherardin NA, The biology and functional importance of MAIT cells. Nat. Immunol 20, 1110–1128 (2019). - PubMed
    1. Legoux F, Salou M, Lantz O, MAIT cell development and functions: The microbial connection. Immunity 53, 710–723 (2020). - PubMed
    1. Treiner E, Duban L, Bahram S, Radosavljevic M, Wanner V, Tilloy F, Affaticati P, Gilfillan S, Lantz O, Addendum: Selection of evolutionarily conserved mucosal-associated invariant T cells by MR1. Nature 423, 1018 (2003). - PubMed
    1. Kjer-Nielsen L, Patel O, Corbett AJ, Le Nours J, Meehan B, Liu L, Bhati M, Chen Z, Kostenko L, Reantragoon R, Williamson NA, Purcell AW, Dudek NL, McConville MJ, O’Hair RAJ, Khairallah GN, Godfrey DI, Fairlie DP, Rossjohn J, McCluskey J, MR1 presents microbial vitamin B metabolites to MAIT cells. Nature 491, 717–723 (2012). - PubMed
    1. Corbett AJ, Eckle SBG, Birkinshaw RW, Liu L, Patel O, Mahony J, Chen Z, Reantragoon R, Meehan B, Cao H, Williamson NA, Strugnell RA, Van Sinderen D, Mak JYW, Fairlie DP, Kjer-Nielsen L, Rossjohn J, McCluskey J, T-cell activation by transitory neo-antigens derived from distinct microbial pathways. Nature 509, 361–365 (2014). - PubMed

Publication types