. 2024 Jan 26;15(1):779.
doi: 10.1038/s41467-023-44503-5.

Using deep learning to quantify neuronal activation from single-cell and spatial transcriptomic data

Affiliations

Using deep learning to quantify neuronal activation from single-cell and spatial transcriptomic data

Ethan Bahl et al. Nat Commun. .

Abstract

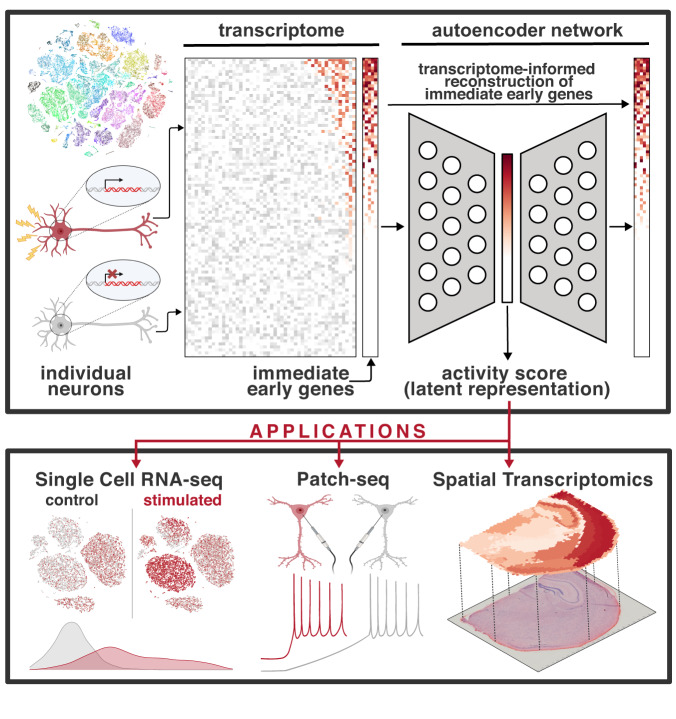
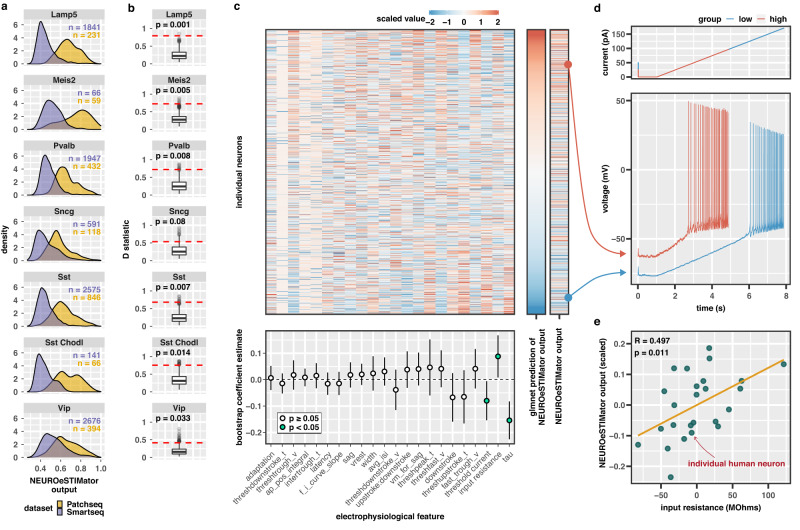
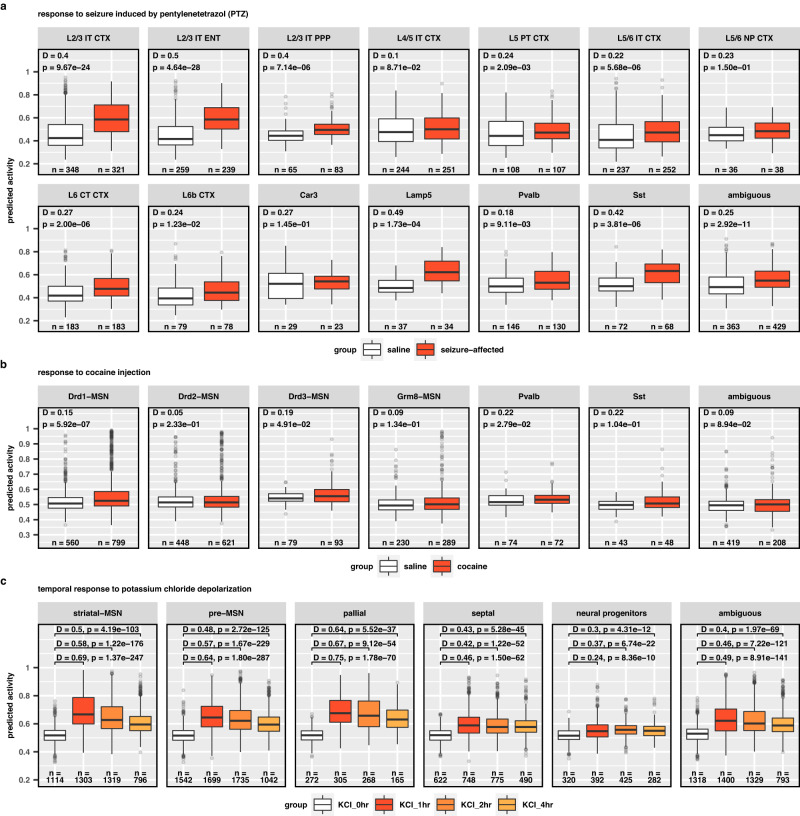
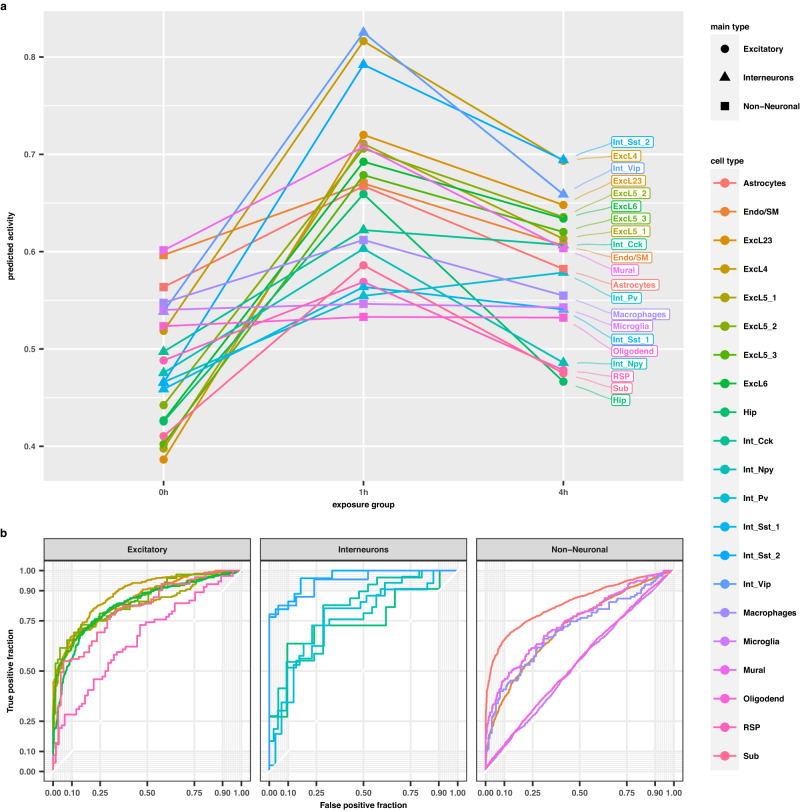
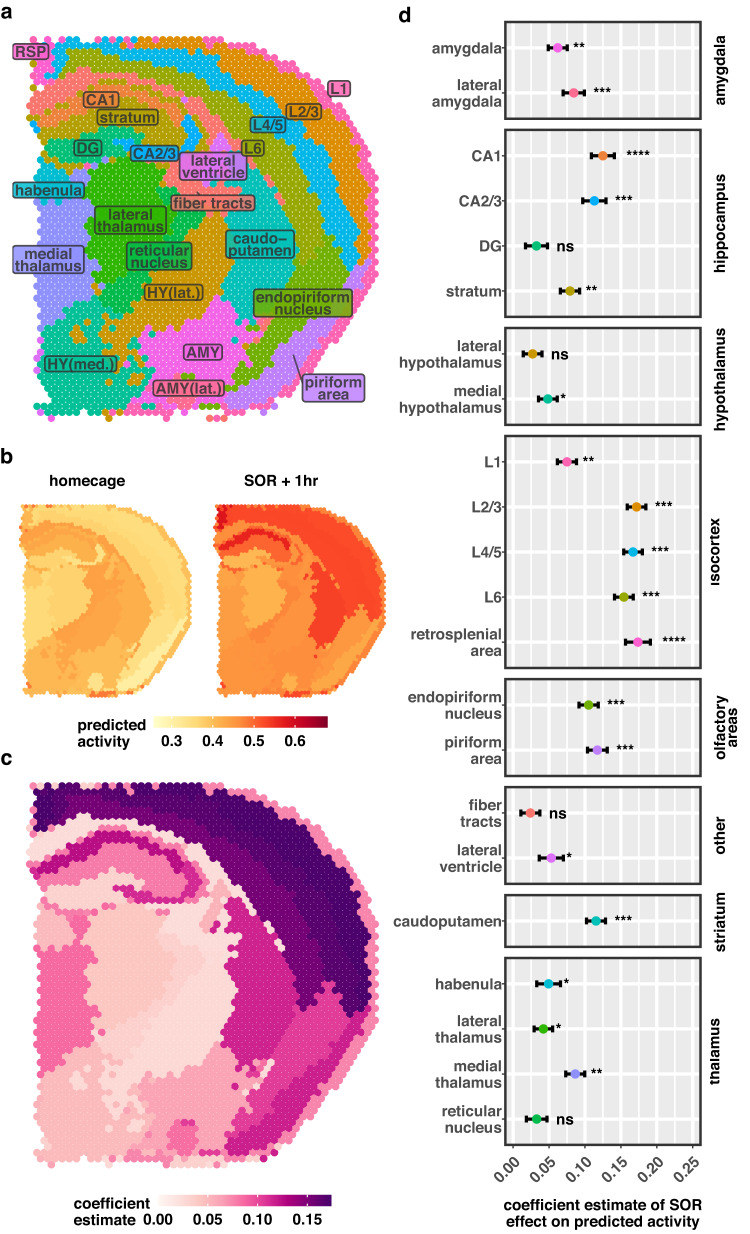
Neuronal activity-dependent transcription directs molecular processes that regulate synaptic plasticity, brain circuit development, behavioral adaptation, and long-term memory. Single cell RNA-sequencing technologies (scRNAseq) are rapidly developing and allow for the interrogation of activity-dependent transcription at cellular resolution. Here, we present NEUROeSTIMator, a deep learning model that integrates transcriptomic signals to estimate neuronal activation in a way that we demonstrate is associated with Patch-seq electrophysiological features and that is robust against differences in species, cell type, and brain region. We demonstrate this method's ability to accurately detect neuronal activity in previously published studies of single cell activity-induced gene expression. Further, we applied our model in a spatial transcriptomic study to identify unique patterns of learning-induced activity across different brain regions in male mice. Altogether, our findings establish NEUROeSTIMator as a powerful and broadly applicable tool for measuring neuronal activation, whether as a critical covariate or a primary readout of interest.


Conflict of interest statement

T.A. serves on the Scientific Advisory Board of EmbarkNeuro and is a scientific advisor to Aditum Bio and Radius Health. The other authors declare no conflicting interests.

Figures

Fig. 1
Fig. 1. Schematic Overview of NEUROeSTIMator.
The graphical abstract illustrates the application of NEUROeSTIMator, a deep learning model, to estimate neuronal activity. Transcriptome-wide gene expression data from individual neurons is input to an autoencoder, which reconstructs expression of immediate early genes from a single unit latent space called the ‘activity score’. The activity score can be applied to gene expression data, including single cell RNA-sequencing, Patch-seq, or spatial transcriptomics studies for detecting transcriptomic signatures of activity.
Fig. 2
Fig. 2. Electrophysiological features of neuronal stimulation captured by transcriptome-based activity score.
a Activity score distributions compared between stimulated Patch-seq neurons (gold) and unstimulated SMART-seq neurons (violet). The number of cells in each comparison are given as text annotations for each density plot. b Observed D statistics (red line) and empirical distribution from Kolmogorov–Smirnov tests (two-sided) between activity score distributions of Patch-seq and SMART-seq datasets, using permutations of shuffled expression values (n = 1000 permutations per cell type) from all cells represented in a. Boxplots depict median value, box bounds denote interquartile range (IQR), whiskers denote values within ±1.5 x IQR, and points outside of whisker range denote outliers with values ≥1.5 x IQR. c Associations between electrophysiological (e-phys) features and predicted activity (n = 1277 cells). Heatmap shows feature value columns ordered by the mean bootstrap coefficient, and individual neuron rows ordered by ephys-based lasso model prediction of NEUROeSTIMator output (top). Predicted and observed NEUROeSTIMator output shown to the right. Colors represent z-scaled values, with red colors indicating higher values and blue indicating lower values. The dot plot (bottom) shows a summary of coefficients estimated by fitting lasso-regularized linear models between electrophysiology feature value and NEUROeSTIMator output (n = 10,000 bootstrap permutations per feature). Dots represent the mean coefficient estimate across bootstraps, lines indicate standard error across bootstraps. P-values were estimated by counting the number of bootstrap permutations where the coefficient was zero or the opposite sign of coefficients observed from the lasso model fit to all data. Significant features with standard errors that do not cross zero (p < 0.05, unadjusted) are depicted by green-colored dots (bottom). See source data for full statistics and feature descriptions. d Spike train comparison of two Vip/Ptprt/Pkp2 neurons exhibiting representative electrophysiological features of high (red) and low (blue) NEUROeSTIMator predictions (ramp current injected - top panel, membrane potential - bottom panel). e Patch-seq validation of the positive association between input resistance and NEUROeSTIMator predictions in a novel set of human excitatory neurons (n = 25 cells). Pearson’s correlation test (two-sided) statistics annotated; linear fit (orange line). Source data are provided as a Source Data file.
Fig. 3
Fig. 3. Multi-species generalization of neuronal activity score applied to previously published chemical induction studies.
Predicted activity for various neuron types responding to treatment with potent chemical modulators of neuron activity. a Response to PTZ-induced seizure (red) and controls (white) in mouse cortical neurons. b Cocaine treatment (red) or controls (white) in rat nucleus accumbens neurons. c Time series of predicted activity for human iPSCs treated with depolarizing potassium chloride at 0 h (control), 1 h, 2 h, and 4 h. Annotated statistics from Kolmogorov–Smirnov tests (one-sided) are provided in Supplementary Data 5. Boxplots depict median value, box bounds denote interquartile range (IQR), whiskers denote values within ±1.5 x IQR, and points outside of whisker range denote outliers with values ≥1.5 x IQR. Source data are provided as a Source Data file.
Fig. 4
Fig. 4. Temporal patterns and classification of in vivo sensory activation.
a Cell type activity predictions of visual cortex neurons in freely behaving mice exposed to light for 0, 1, or 4 h. Activity predictions summarized by cell type and experimental group, and Kolmogorov–Smirnov (one-sided) test results are provided in Supplementary Data 6. Color indicates cell type and shape indicates major cell type groupings. b ROC plots indicate the ability of predicted activity to distinguish between the 0 h and 1 h experimental groups. Diagonals from bottom left to top right indicate an accuracy similar to random chance, while lines moving straight vertically, then straight horizontally indicate perfect separation. Source data are provided as a Source Data file.
Fig. 5
Fig. 5. Spatial transcriptomic patterns of neuronal activation after spatial learning.
a Spatial anatomical clustering of RNA-sequencing spots. RSP retrosplenial area, HY hypothalamus, AMY amygdala, med: medial, lat lateral. b Activity score per spot, averaged within experimental groups of homecage controls (left) and 1 h after SOR training (right). Yellow color indicates low activity and red indicates high activity. c Brain region-specific induction of activity following SOR training. Differences tested using a linear mixed effects model (two-sided), colored by the SOR coefficient estimate per region (n = 3 biologically independent mice per group). Dark purple colors represent greater differences between groups. Cluster-wise differential activity statistics are summarized in (d) and provided in Supplementary Data 7. Dots represent estimated coefficients of SOR on activity score; linear fit. Brackets indicate standard error of the coefficient. Asterisks indicate a significant difference in activity score between homecage and SOR groups—false discovery rate (FDR)-adjusted p-values are *FDR ≤ 0.05, **FDR ≤ 0.01, ***FDR ≤ 0.001, and ****FDR ≤ 0.0001. Exact p-values, FDR, coefficients, and the number of cells per group, per brain region are provided in Supplementary Data 7. Source data are provided as a Source Data file.

References

    1. Yap EL, Greenberg ME. Activity-regulated transcription: bridging the gap between neural activity and behavior. Neuron. 2018;100:330–348. doi: 10.1016/j.neuron.2018.10.013. - DOI - PMC - PubMed
    1. Cohen S, Greenberg ME. Communication between the synapse and the nucleus in neuronal development, plasticity, and disease. Annu Rev. Cell Dev. Biol. 2008;24:183–209. doi: 10.1146/annurev.cellbio.24.110707.175235. - DOI - PMC - PubMed
    1. West, A. E. & Greenberg, M. E. Neuronal activity-regulated gene transcription in synapse development and cognitive function. Cold Spring Harb. Perspect Biol.3, 10.1101/cshperspect.a005744 (2011). - PMC - PubMed
    1. Gallo FT, Katche C, Morici JF, Medina JH, Weisstaub NV. Immediate early genes, memory and psychiatric disorders: focus on c-Fos, Egr1 and Arc. Front Behav. Neurosci. 2018;12:79. doi: 10.3389/fnbeh.2018.00079. - DOI - PMC - PubMed
    1. Mews P, et al. From circuits to chromatin: the emerging role of epigenetics in mental health. J. Neurosci. 2021;41:873–882. doi: 10.1523/JNEUROSCI.1649-20.2020. - DOI - PMC - PubMed