

Response of skin temperature, blood ammonia and lactate during incremental exercise until exhaustion in elite athletes
- PMID: 38278863
- PMCID: PMC10817955
- DOI: 10.1038/s41598-024-52374-z
Response of skin temperature, blood ammonia and lactate during incremental exercise until exhaustion in elite athletes
Abstract
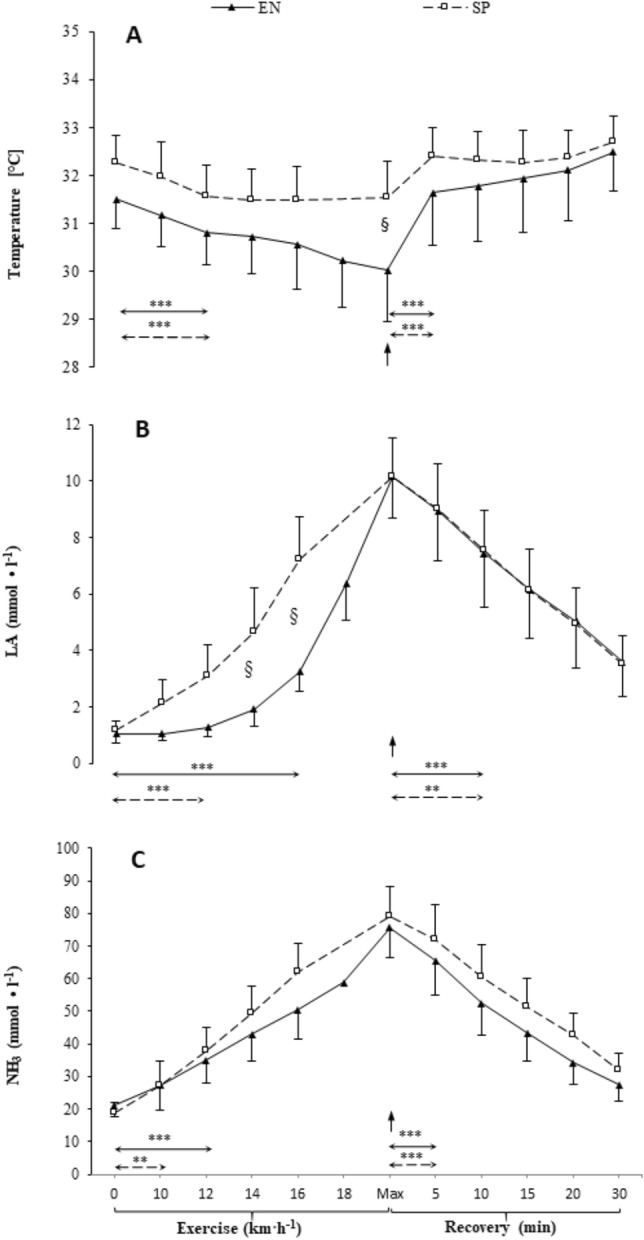
The study aimed to evaluate the lower limb skin temperature (Tsk) and blood concentrations of lactate (LA) and ammonia (NH3) during exercise and recovery. Eleven elite sprint athletes (25 ± 3.4 yrs) and 11 elite endurance athletes (24.45 ± 5.4 yrs) performed an incremental running test until exhaustion. Body composition was estimated using the DXA method. Thermograms of the anterior and posterior surfaces of the lower limbs were recorded at rest, before each test stage (every 3 min, starting from 10 km h-1 and increasing by 2 km h-1), and in the 5th, 10th, 15th, 20th, and 30th minute of recovery. Endurance athletes had a higher maximum oxygen uptake than sprint athletes (5.0 ± 0.7 vs 4.3 ± 0.4 l·kg-1, p = 0.018), lower percentage of lean content (79 ± 2 vs 83 ± 2%, p < 0.001), and a higher percentage of fat content in the lower limbs (17 ± 2 vs 12 ± 2%, p < 0.001). In both groups, a significant decrease in Tsk was observed compared to resting value (endurance athletes-31.5 ± 0.6 °C; sprint athletes-32.3 ± 0.6 °C), during exercise (p < 0.001) and rewarming during recovery (p < 0.001). However, endurance athletes had a lower Tsk than sprint athletes at the exhaustion point (30.0 ± 1.1 vs 31.6 ± 0.8 °C, p < 0.05) and the pattern of change in Tsk differed between groups (p < 0.001). Tsk in the endurance athletes group decreased throughout the exercise protocol and returned more rapidly to initial values during recovery, while Tsk in the sprint group stabilised between moderate intensity and exhaustion, recovering more slowly after exercise. Both LA (endurance athletes-max 10.2 ± 1.5; sprint athletes-max 10.1 ± 1.4 mmol⋅L-1, p < 0.001) and NH3 (endurance athletes-max 75.6 ± 11.5; sprint athletes-max 76.7 ± 9.0 mmol⋅L-1, p < 0.001) increased during exercise and decreased during recovery (p < 0.001). During exercise, lower levels and slower increases in LA were observed during exercise in the endurance athletes' group (p < 0.05). A negative correlation was revealed between Tsk and fat percentage (r = -0.43 to -0.71, p < 0.05). Tsk was positively correlated with LA during recovery (r = 0.43 to 0.48, p < 0.05), and negatively during recovery (r = -0.45 to -0.54, p < 0.05). Differences between groups in maximum aerobic capacity, the pattern of change in Tsk, and the correlation between Tsk and LA suggest that individuals who decrease less Tsk during exercise and higher Tsk during recovery are those with better aerobic capacity. In addition, athletes with less body fat dissipate heat from their tissues more efficiently.
© 2024. The Author(s).
Conflict of interest statement
The authors declare no competing interests.
Figures


References
-
- Akimov, E.B., Son’kin, V.D. Skin temperature and lactate threshold during muscle work in athletes. Hum. Physiol.37, 621–628 (2011). - PubMed
-
- Adamczyk JG, Boguszewski D, Siewierski M. Thermographic evaluation of lactate level in capillary blood during post-exercise recovery. Kinesiology. 2014;46(2):186–193.
-
- Włodarczyk M, Kusy K, Słomińska E, Krasiński Z, Zieliński J. Change in Lactate, Ammonia, and Hypoxanthine Concentrations in a 1-Year Training Cycle in Highly Trained Athletes: Applying Biomarkers as Tools to Assess Training Status. J. Strength Cond. Res. 2020;34(2):355–364. doi: 10.1519/JSC.0000000000003375. - DOI - PubMed
MeSH terms
Substances
Grants and funding
- 2013/09/B/NZ7/02556/Polish Ministry of Science and Higher Education
- 2013/09/B/NZ7/02556/Polish Ministry of Science and Higher Education
- 2013/09/B/NZ7/02556/Polish Ministry of Science and Higher Education
- 2013/09/B/NZ7/02556/Polish Ministry of Science and Higher Education
- 2013/09/B/NZ7/02556/Polish Ministry of Science and Higher Education
LinkOut - more resources
Full Text Sources
