. 2024 Jan 26;14(1):2211.
doi: 10.1038/s41598-024-52581-8.

Glomerular spatial transcriptomics of IgA nephropathy according to the presence of mesangial proliferation

Affiliations

Glomerular spatial transcriptomics of IgA nephropathy according to the presence of mesangial proliferation

Sehoon Park et al. Sci Rep. .

Abstract

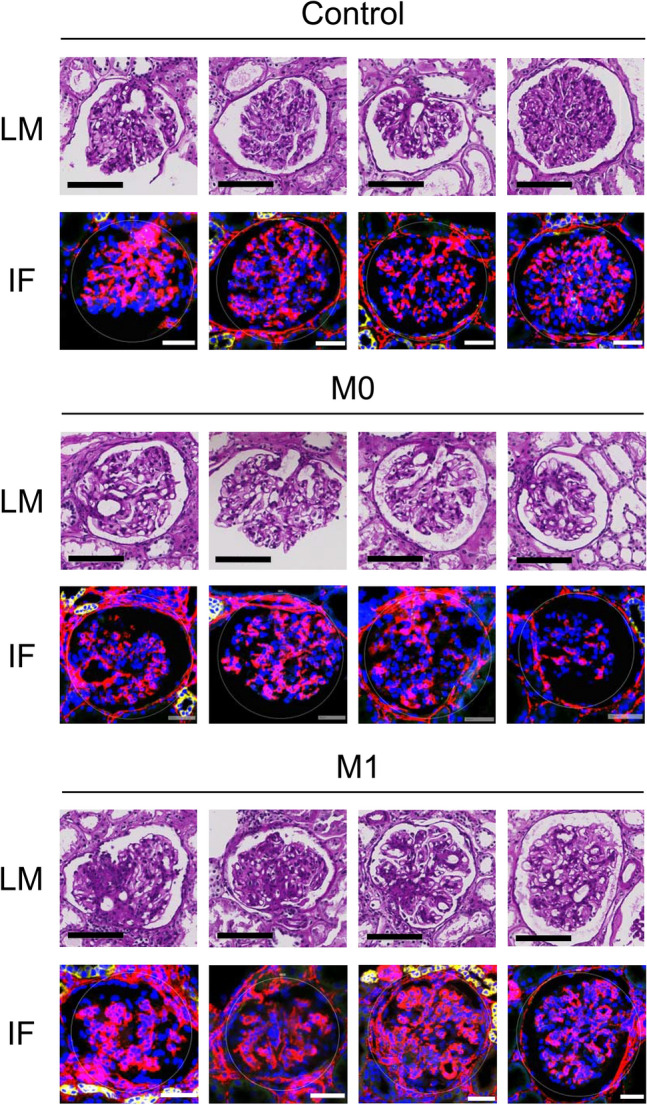
Mesangial proliferation is a diagnostic feature and a prognostic predictor of immunoglobulin A nephropathy (IgAN). We aimed to investigate the gene expression profiles of IgAN glomerulus according to the presence of mesangial proliferation. We performed spatial-specific transcriptomic profiling on kidney biopsy tissues using the GeoMx Digital Spatial Profiler. Twelve cases with three glomeruli for each case were profiled using direct pathologic classification (4 M1-IgAN, 4 M0-IgAN, and 4 donor controls). The results of enriched glom-specific genes demonstrated that M1-IgAN could be distinguished from controls (77 upregulated and 55 downregulated DEGs), while some DEGs were identified between M1-IgAN and M0-IgAN cases (24 upregulated and 8 downregulated DEGs) or between M0 and controls (1 upregulated and 16 downregulated DEGs). TCF21, an early podocyte damage marker, was the only differentially expressed gene (DEG) consistently upregulated in both M1-IgAN and M0-IgAN patients, whereas ATF3, EGR1, DUSP1, FOS, JUNB, KLF2, NR4A1, RHOB, and ZFP36 were consistently downregulated in IgAN cases. Glomeruli from M1-IgAN cases were significantly enriched for cell surface/adhesion molecules and gene expressions associated with vascular development or the extracellular matrix. Spatial transcriptomic analysis may contribute to dissecting structure-specific pathophysiology and molecular changes in IgAN.


Conflict of interest statement

The authors declare no competing interests.

Figures

Figure 1
Figure 1
Representative images of the targeted glomerulus in the study. The light microscopy (bars = 100 µm) and immunofluorescence images (blue, SYTO13; yellow, panCK; red, alpha Smooth Muscle Actin; green, CD68) are shown in the left and right graphs, respectively. A pathologist annotated the degree of mesangial proliferation in each glomerulus as part of a spatial transcriptome profiling study. The scale bars indicate 100 μm for light microscopy images and 50 μm for immunofluorescence images.
Figure 2
Figure 2
The initial quality control process of the read count results. (A) Relative log expression plot revealed no notable batch effects. The read counts from each area of interest are shown using box plots in the same order as the samples mounted on the experiment slides. Each slide included 12 area-of-interests from four cases with three glomeruli each (red, M1 cases; blue, M0 cases; green, control donor-kidney). (B) Kidney microstructure-specific gene expression profiles indicated a relative enrichment of glomerulus-specific genes (PODXL, NPHS2, and NPHS1) when compared to proximal convoluted tubule (SLC34A1), distal convoluted tubule (SLC12A3), and collecting duct (AQP2)-specific genes. To show the differences between other gene expression amounts, PODXL box plot was cropped and the glom-specific gene expression was evidently abundant. (C) Principal component analysis showed certain differences between the study groups (red, M1 cases; blue, M0 cases; green, control donor-kidney), which was particularly prominent for the M1 cases.
Figure 3
Figure 3
The differentially expressed genes (DEGs). (A) Volcano plots. X-axes indicate log2 (fold-change), and Y-axes indicate − log10 (adjusted-P value). Significantly (adjusted-P value < 0.1) downregulated and upregulated genes are marked in blue and red, respectively. DEGs between IgAN M0 cases and controls (left), IgAN M0 cases and controls (center), and IgAN M1 and IgAN M0 cases (right). (B) Venn-diagram showing the overlapping or specific DEGs in each target group.
Figure 4
Figure 4
Protein–protein interaction network analysis. (A) IgAN M0 cases and controls, (B) IgAN M1 cases and controls, and (C) IgAN M1 cases and M0 cases were compared using the STRING database, and the DEGs with at least one significant relationship with another DEG are displayed in each comparison.
Figure 5
Figure 5
Immunohistochemistry results for validation in protein level for TCF21 and THY1. Total of 12 case of IgAN and 4 healthy controls are included in the staining and 3 glomeruli in each case were selected for quantification. Representative images are shown in the figure. Quantification was performed by image J using an automated macro script. The quantified abundance of protein expression was compared in the according box plots.

References

    1. Schena FP, Nistor I. Epidemiology of IgA nephropathy: A global perspective. Semin. Nephrol. 2018;38(5):435–442. doi: 10.1016/j.semnephrol.2018.05.013. - DOI - PubMed
    1. Lee H, Kim DK, Oh KH, et al. Mortality of IgA nephropathy patients: A single center experience over 30 years. PLoS One. 2012;7(12):e51225. doi: 10.1371/journal.pone.0051225. - DOI - PMC - PubMed
    1. Barbour SJ, Coppo R, Zhang H, et al. Evaluating a new international risk-prediction tool in IgA nephropathy. JAMA Intern. Med. 2019;179(7):942–952. doi: 10.1001/jamainternmed.2019.0600. - DOI - PMC - PubMed
    1. Trimarchi H, Barratt J, Cattran DC, et al. Oxford classification of IgA nephropathy 2016: An update from the IgA nephropathy classification working group. Kidney Int. 2017;91(5):1014–1021. doi: 10.1016/j.kint.2017.02.003. - DOI - PubMed
    1. Liu P, Lassén E, Nair V, et al. Transcriptomic and proteomic profiling provides insight into mesangial cell function in IgA nephropathy. J. Am. Soc. Nephrol. 2017;28(10):2961–2972. doi: 10.1681/ASN.2016101103. - DOI - PMC - PubMed

MeSH terms

Substances