. 2024 Feb;6(2):226-237.
doi: 10.1038/s42255-023-00970-0. Epub 2024 Jan 26.

Genetic architecture and biology of youth-onset type 2 diabetes

Affiliations

Genetic architecture and biology of youth-onset type 2 diabetes

Soo Heon Kwak et al. Nat Metab. 2024 Feb.

Abstract

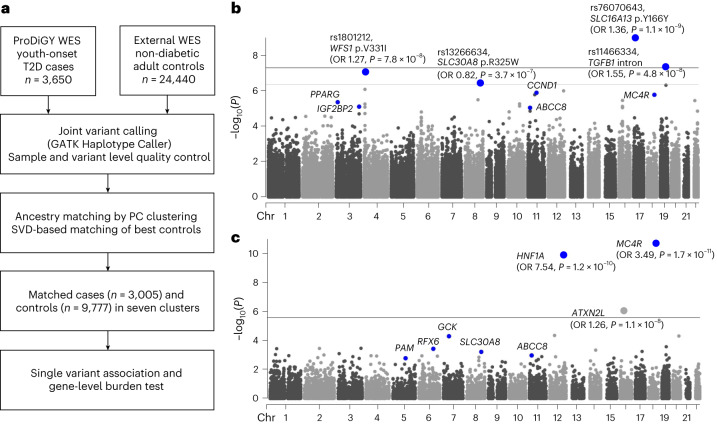
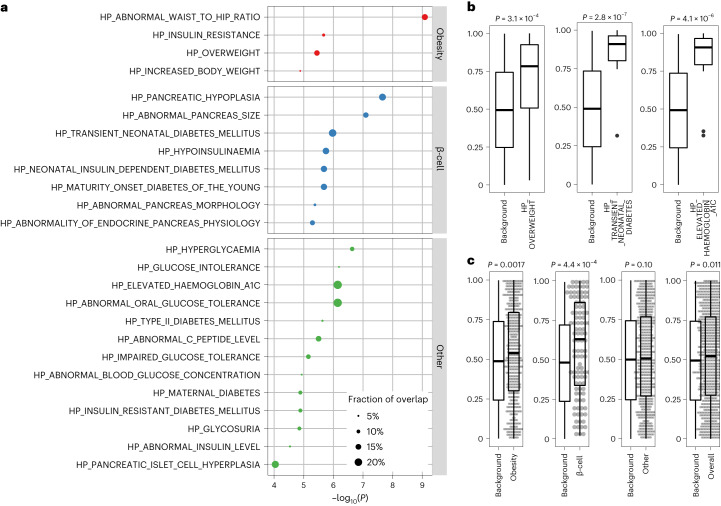
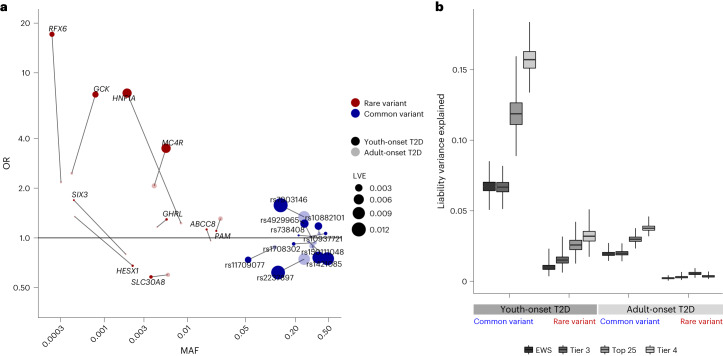
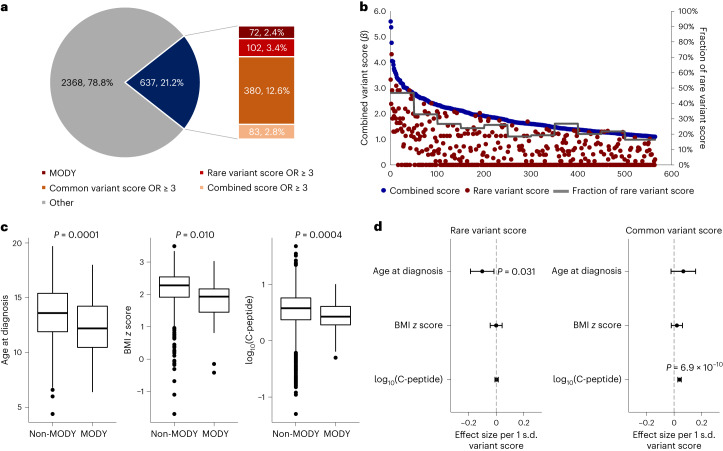
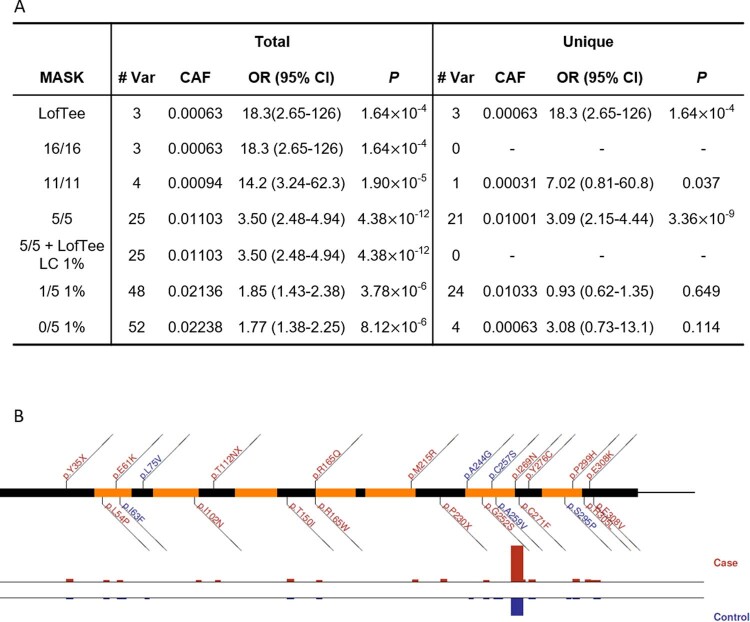
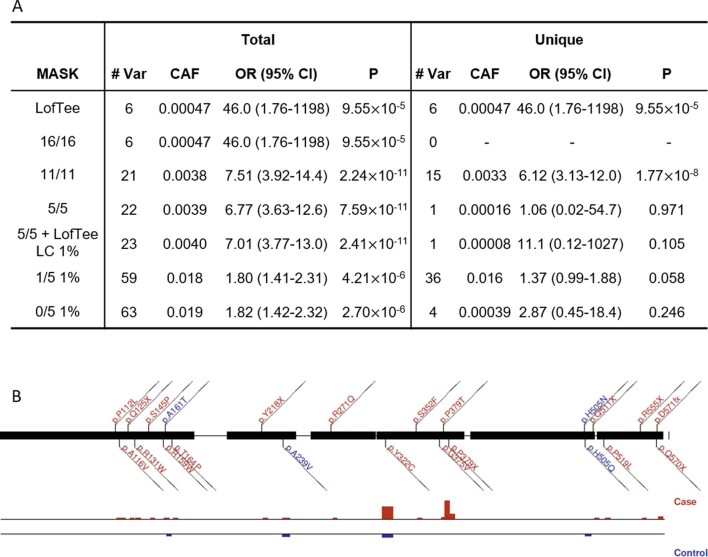
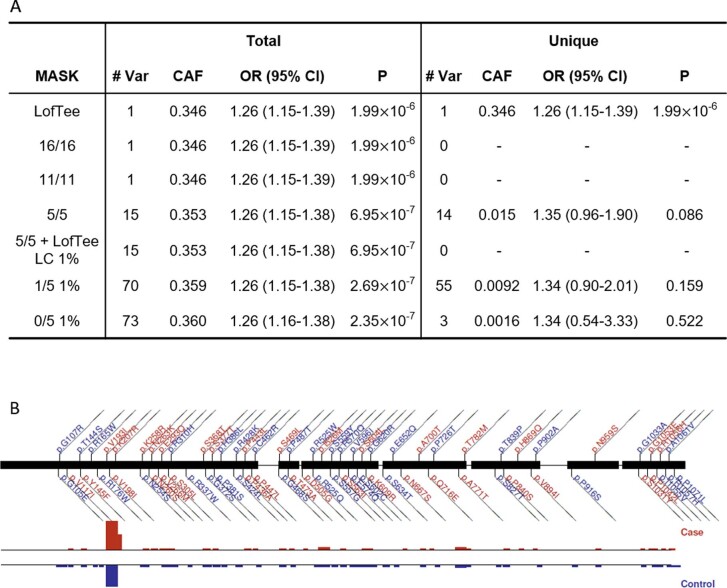
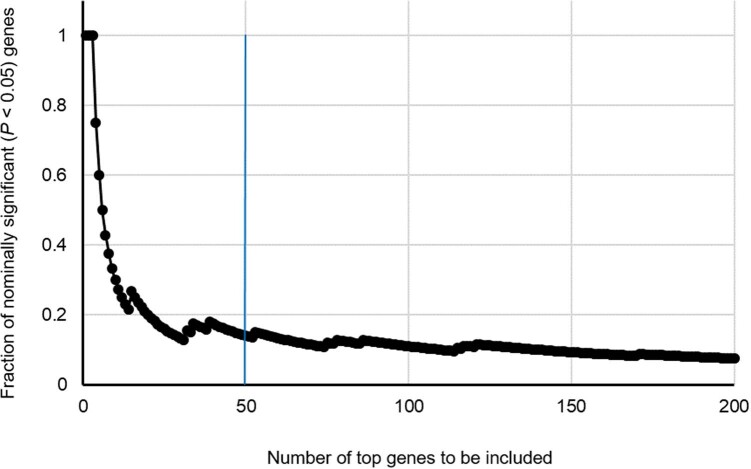
The prevalence of youth-onset type 2 diabetes (T2D) and childhood obesity has been rising steadily1, producing a growing public health concern1 that disproportionately affects minority groups2. The genetic basis of youth-onset T2D and its relationship to other forms of diabetes are unclear3. Here we report a detailed genetic characterization of youth-onset T2D by analysing exome sequences and common variant associations for 3,005 individuals with youth-onset T2D and 9,777 adult control participants matched for ancestry, including both males and females. We identify monogenic diabetes variants in 2.4% of individuals and three exome-wide significant (P < 2.6 × 10⁻⁶) gene-level associations (HNF1A, MC4R, ATXN2L). Furthermore, we report rare variant association enrichments within 25 gene sets related to obesity, monogenic diabetes and β-cell function. Many youth-onset T2D associations are shared with adult-onset T2D, but genetic risk factors of all frequencies-and rare variants in particular-are enriched within youth-onset T2D cases (5.0-fold increase in the rare variant and 3.4-fold increase in common variant genetic liability relative to adult-onset cases). The clinical presentation of participants with youth-onset T2D is influenced in part by the frequency of genetic risk factors within each individual. These findings portray youth-onset T2D as a heterogeneous disease situated on a spectrum between monogenic diabetes and adult-onset T2D.


Conflict of interest statement

A.M. receives consulting fees from Bayer, Chinook and Prokidney; research support from Alexion, Bayer, Boehringer Ingelheim and Chinook. J.C.F. has received speaking honoraria from AstraZeneca and Novo Nordisk for scientific talks over which he had full control of content; his wife has received a consulting honorarium from Novartis. The other authors declare no competing interests.

Figures

Fig. 1
Fig. 1. Scheme of the study and genetic discovery.
a, Whole-exome sequence data of individuals with youth-onset T2D were matched to those of external non-diabetic control participants using genetic principal components and a singular-value decomposition (SVD)-based method resulting in 3,005 cases and 9,777 control participants for single-variant and gene-level association analysis. b, Single-variant association analysis revealed four variants passing exome-wide significance (P < 4.3 × 10−7). c, Gene-level association analysis showed three genes associated with youth-onset T2D at exome-wide significance (P < 2.6 × 10−6). Blue dots represent previously known variants or genes of adult-onset T2D. Both single-variant and gene-level association analyses were performed with Firth’s penalized logistic regression. GATK, genome analysis toolkit; PC, principal components; WES, whole-exome sequencing.
Fig. 2
Fig. 2. Pathways involved in obesity and β-cell function are enriched in youth-onset T2D.
a, Gene-set enrichment analysis using a hypergeometric test with the top 50 gene-level association signals in youth-onset T2D identified 25 Human Phenotype Ontology gene sets that had significant overlap and were related to metabolic phenotypes of diabetes. These 25 gene sets were categorized into three subgroups of ‘obesity’, ‘β-cell function’ and ‘others’. b, A one-sided Wilcoxon rank-sum test (one-sided) using these 25 gene sets revealed representative sets with significant association enrichments beyond the top 50 associated genes, such as ‘HP_OVERWEIGHT’ (n = 24 genes versus 1,132 background genes), ‘HP_TRANSIENT_NEONATAL_DIABETES_MELLITUS’ (n = 16 genes versus 750 background genes), and ‘HP_ELEVATED_HAEMOGLOBIN_A1C’ (n = 15 genes versus 705 background genes). c, Gene-set clusters of ‘obesity’ (n = 438 genes versus 1,999 background genes) and ‘β-cell function’ (n = 108 genes versus 519 background genes) showed significant enrichment (P < 0.05) when combining genes across all sets in the cluster using the one-sided Wilcoxon rank-sum test. Background denotes matched genes with similar numbers and frequencies of variants within them. All box-and-whisker plots represent the following: line, median; box, interquartile range (IQR) and whiskers, 1.5 × IQR.
Fig. 3
Fig. 3. Genetic architecture and LVE by common and rare variants.
a, OR, allele frequency distribution and LVE by ten tier 3 gene-level association signals and ten common variant association signals and their LVE in youth-onset T2D and adult-onset T2D. b, LVE by common variants and gene-level associations in youth-onset T2D and adult-onset T2D for exome-wide significant associations (EWS), ten tier 3 genes and same number of common variants (tier 3), top 25 significant gene-level and common variant associations (top 25) and 46 tier 4 genes and same number of common variants (tier 4). The LVE by common variants increased by 3.5–4.2-fold in youth-onset T2D compared to adult-onset T2D. There was even larger 5.0–9.0-fold increase in LVE by rare variant gene-level associations in youth-onset T2D. Box-and-whisker plots represent the following: line, median; box, IQR; whiskers, minimum and maximum.
Fig. 4
Fig. 4. Individual genetic risk conferred by common and rare variants.
a, Fraction of individuals having high genetic risk conferred by MODY variants, rare variant score, common variant score or combined variant score. Among 3,005 youth-onset T2D cases, 2.4% carried MODY variants, 3.4% had high rare variant score with OR ≥ 3, 12.6% had high common variant score with OR ≥ 3 and 2.8% had high combined score with OR ≥ 3. b, For the 565 non-MODY individuals having a high combined variant score with OR ≥ 3, the contribution of rare variant score was higher at the higher end of the combined variant score. c, Individuals with monogenic diabetes (n = 72) had an earlier age of diagnosis, lower BMI z score and lower log10(C-peptide) level compared to cases without MODY variants (n = 2,933). The difference in means between the two groups was tested using a generalized linear model. Box-and-whisker plots represent the following: line, median; box, IQR; whiskers, 1.5 × IQR. d, In linear regression analysis, rare variant score was associated with earlier age at diagnosis and common variant score was associated with higher log10(C-peptide) level even after excluding MODY cases (n = 2,933). Error bars indicate 95% confidence interval.
Extended Data Fig. 1
Extended Data Fig. 1. Principle components based matching of ancestry.
Applying principal component analysis (PCs) and a singular-value decomposition-based method to match external controls with ProDiGY cases yielded seven clusters from three different ancestries. AFR, African; EUR, European; HIS, Hispanic.
Extended Data Fig. 2
Extended Data Fig. 2. Quantile-quantile plot of the single variant association test.
Quantile-quantile plot showing the distribution of the observed P values from the single variant association test against the expected distribution under the null hypothesis for all single nucleotide variants (A) and for variants with a minor allele count of 10 or more (B). The grey zone indicates the 95% confidence interval. GC, genomic inflation factor; MAC, minor allele count; SNV, single nucleotide variant.
Extended Data Fig. 3
Extended Data Fig. 3. Quantile-quantile plot of the gene-level rare coding variant association test.
Quantile-quantile plot showing the distribution of the observed P values from the gene-level rare coding variant association test against the expected distribution under the null hypothesis. The grey zone indicates the 95% confidence interval. GC, genomic inflation factor.
Extended Data Fig. 4
Extended Data Fig. 4. Quantile-quantile plot of the gene-level association test using synonymous variants.
Quantile-quantile plot showing the distribution of the observed P values from the gene-level association test using synonymous variants against the expected distribution under the null hypothesis. The grey zone indicates the 95% confidence interval. GC, genomic inflation factor.
Extended Data Fig. 5
Extended Data Fig. 5. Gene-level analysis of MC4R.
Shown is a dissection of the gene-level associations for MC4R. (A) Mask-level Firth’s logistic regression analysis results for all variants in the mask are shown in the left column (“Total”) and for variants unique to the mask are shown in the right column (“Unique”). The details of the mask definition is described in the Methods. (B) A graphical plot of variants observed in MC4R within the 1/5 1% mask. Variants are coloured blue (if individual OR < 1) or red (OR > 1). Case (red) and control (blue) frequencies are shown below for each variant. # Var, number of variants in the association test; CAF, combined allele frequency; OR, odds ratio.
Extended Data Fig. 6
Extended Data Fig. 6. Gene-level analysis of HNF1A.
Shown is a dissection of the gene-level associations for HNF1A. (A) Mask-level Firth’s logistic regression analysis results for all variants in the mask are shown in the left column (“Total”) and for variants unique to the mask are shown in the right column (“Unique”). The details of the mask definition is described in the Methods. (B) A graphical plot of variants observed in HNF1A within the 1/5 1% mask. Variants are coloured blue (if individual OR < 1) or red (OR > 1). Case (red) and control (blue) frequencies are shown below for each variant. # Var, number of variants in the association test; CAF, combined allele frequency; OR, odds ratio.
Extended Data Fig. 7
Extended Data Fig. 7. Gene-level analysis of ATXN2L.
Shown is a dissection of the gene-level associations for ATXN2L. (A) Mask-level Firth’s logistic regression analysis results for all variants in the mask are shown in the left column (“Total”) and for variants unique to the mask are shown in the right column (“Unique”). The details of the mask definition is described in the Methods. (B) A graphical plot of variants observed in ATXN2L within the 1/5 1% mask. Variants are colored blue (if individual OR < 1) or red (OR > 1). Case (red) and control (blue) frequencies are shown below for each variant. # Var, number of variants in the association test; CAF, combined allele frequency; OR, odds ratio.
Extended Data Fig. 8
Extended Data Fig. 8. Number of top genes of youth-onset T2D and their fraction of nominally significant associations in AMP-T2D-GENES.
To determine the cutoff for the number of top genes to be included in the gene set enrichment analysis, we examined the proportion of genes associated with T2D in the AMP-T2D-GENES database that reached nominal significance. The top 50 genes from our gene-level association study of youth-onset T2D demonstrated an enrichment of established T2D association signals.

Update of

References

    1. Lawrence JM, et al. Trends in prevalence of type 1 and type 2 diabetes in children and adolescents in the US, 2001-2017. J. Am. Med. Assoc. 2021;326:717–727. doi: 10.1001/jama.2021.11165. - DOI - PMC - PubMed
    1. Group TS, et al. Long-term complications in youth-onset type 2 diabetes. N. Engl. J. Med. 2021;385:416–426. doi: 10.1056/NEJMoa2100165. - DOI - PMC - PubMed
    1. Todd JN, Srinivasan S, Pollin TI. Advances in the genetics of youth-onset type 2 diabetes. Curr. Diab. Rep. 2018;18:57. doi: 10.1007/s11892-018-1025-1. - DOI - PMC - PubMed
    1. Srinivasan S, et al. The first genome-wide association study for type 2 diabetes in youth: the Progress in Diabetes Genetics in Youth (ProDiGY) Consortium. Diabetes. 2021;70:996–1005. doi: 10.2337/db20-0443. - DOI - PMC - PubMed
    1. Guey LT, et al. Power in the phenotypic extremes: a simulation study of power in discovery and replication of rare variants. Genet. Epidemiol. 2011;35:236–246. doi: 10.1002/gepi.20572. - DOI - PubMed

Grants and funding