. 2024 Feb;30(2):382-393.
doi: 10.1038/s41591-023-02788-5. Epub 2024 Jan 26.

A fluid biomarker reveals loss of TDP-43 splicing repression in presymptomatic ALS-FTD

Affiliations

A fluid biomarker reveals loss of TDP-43 splicing repression in presymptomatic ALS-FTD

Katherine E Irwin et al. Nat Med. 2024 Feb.

Erratum in

Abstract

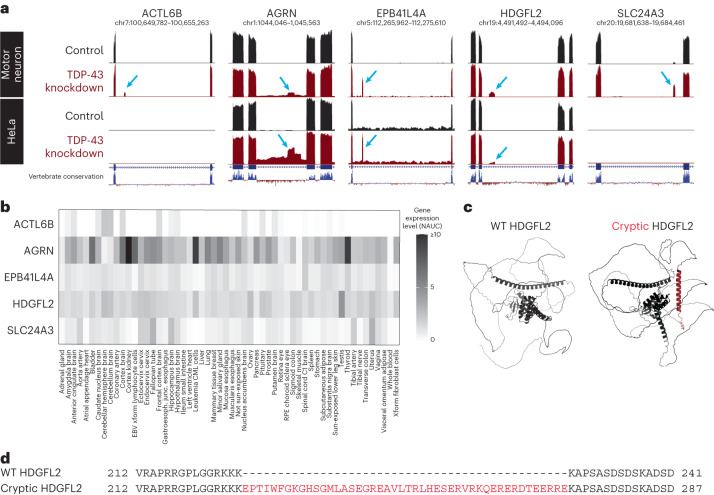
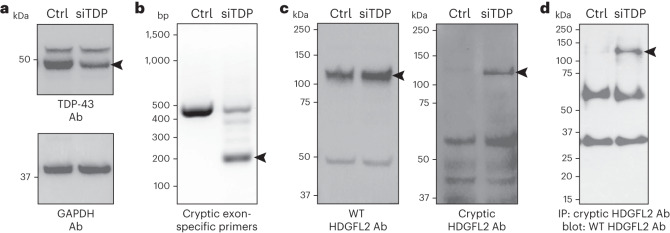
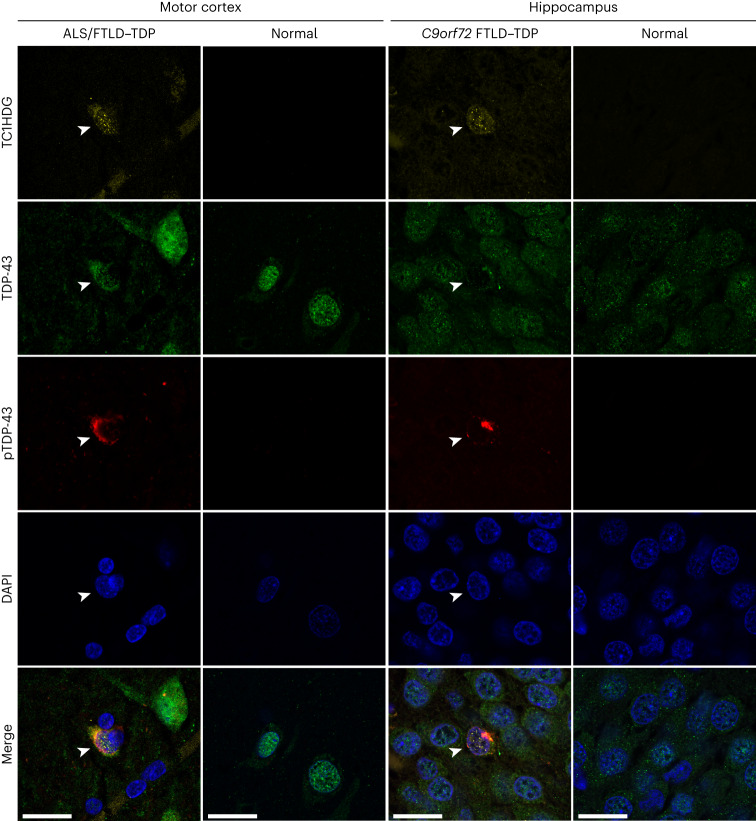
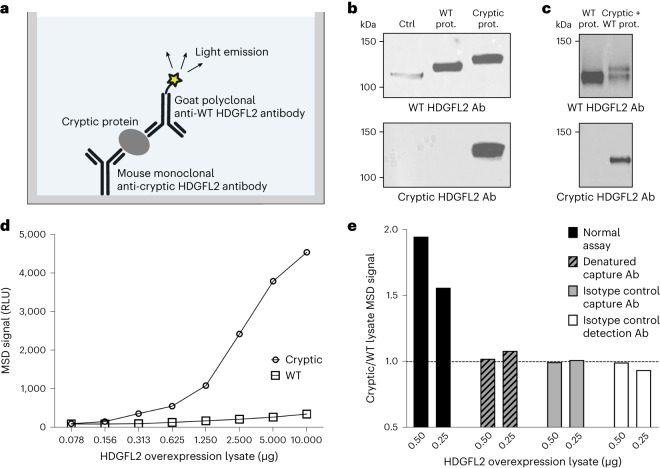
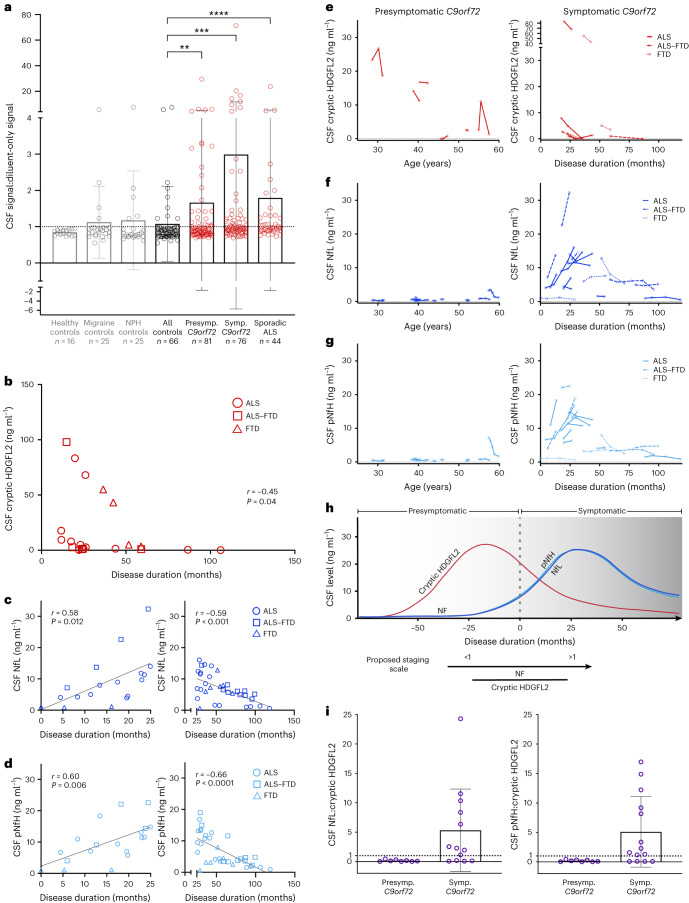
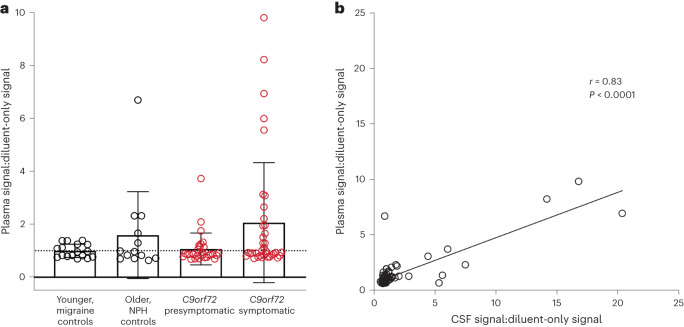
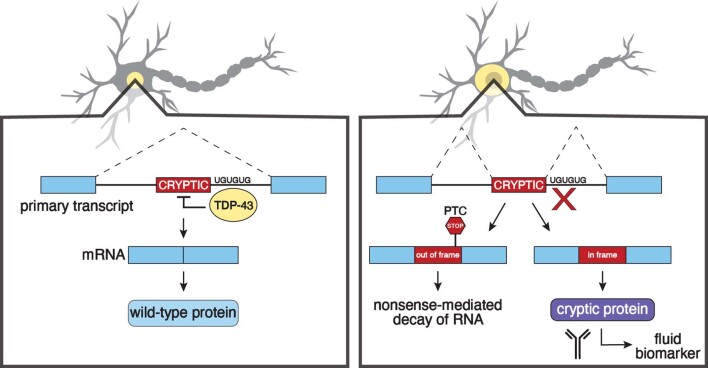
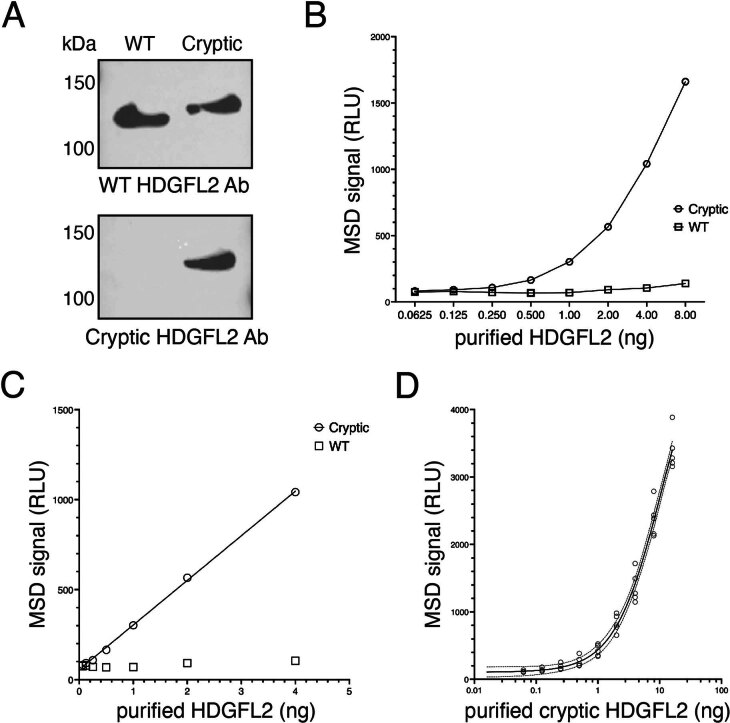
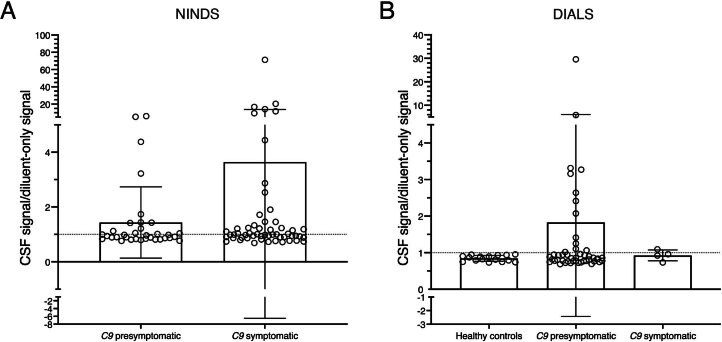
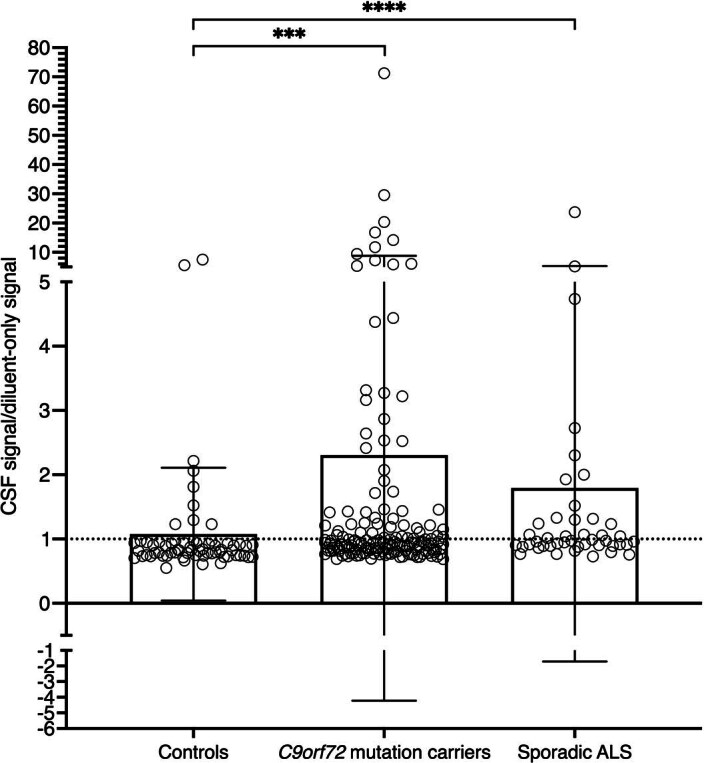
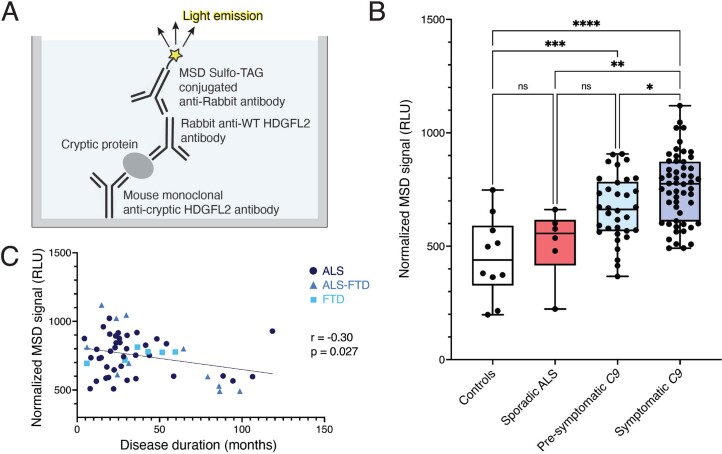
Although loss of TAR DNA-binding protein 43 kDa (TDP-43) splicing repression is well documented in postmortem tissues of amyotrophic lateral sclerosis (ALS) and frontotemporal dementia (FTD), whether this abnormality occurs during early-stage disease remains unresolved. Cryptic exon inclusion reflects loss of function of TDP-43, and thus detection of proteins containing cryptic exon-encoded neoepitopes in cerebrospinal fluid (CSF) or blood could reveal the earliest stages of TDP-43 dysregulation in patients. Here we use a newly characterized monoclonal antibody specific to a TDP-43-dependent cryptic epitope (encoded by the cryptic exon found in HDGFL2) to show that loss of TDP-43 splicing repression occurs in ALS-FTD, including in presymptomatic C9orf72 mutation carriers. Cryptic hepatoma-derived growth factor-like protein 2 (HDGFL2) accumulates in CSF at significantly higher levels in familial ALS-FTD and sporadic ALS compared with controls and is elevated earlier than neurofilament light and phosphorylated neurofilament heavy chain protein levels in familial disease. Cryptic HDGFL2 can also be detected in blood of individuals with ALS-FTD, including in presymptomatic C9orf72 mutation carriers, and accumulates at levels highly correlated with those in CSF. Our findings indicate that loss of TDP-43 cryptic splicing repression occurs early in disease progression, even presymptomatically, and that detection of the HDGFL2 cryptic neoepitope serves as a potential diagnostic biomarker for ALS, which should facilitate patient recruitment and measurement of target engagement in clinical trials.


Conflict of interest statement

The authors declare the following competing interests. J.P.L. and P.C.W. are inventors on a provisional patent application submitted by Johns Hopkins University that covers the usage of TDP-43-associated cryptic exon-derived neoepitopes as biomarkers. B.J.T. holds patents on the clinical testing and therapeutic intervention for the hexanucleotide repeat expansion of C9orf72. D.B. is an employee and shareholder of Biogen. At the time of the study, D.R. was an employee and shareholder of Biogen.

Figures

Fig. 1
Fig. 1. Identification of human in-frame, TDP-43-associated cryptic exons.
a, UCSC Genome Browser visualization of selected cryptic exons in human motor neurons and HeLa cells aligned to the GRCh38 assembly. Red tracks indicate TDP-43 knockdown, and blue arrows identify nonconserved cryptic exons. Gene annotations below RNA sequencing tracks indicate canonical exons (thick lines) and introns (thin lines). b, Visualization of tissue type-specific gene expression of ACTL6B, AGRN, EPB41L4A, HDGFL2 and SLC24A3. While AGRN and HDGFL2 RNA transcripts are ubiquitously expressed, ACTL6B, EPB41L4A and SLC24A3 are expressed in a more tissue-specific manner. NAUC values derived from ASCOT are used to approximate gene expression levels in different human tissue types. c, Comparison of WT (left) and cryptic (right) HDGFL2 protein structures. Inclusion of the cryptic exon in mRNA leads to the addition of 46 amino acids predicted to form an alpha-helix structure (red) between flanking unstructured regions. Both structures are generated using AlphaFold predictions derived from amino acid sequences. The WT HDGFL2 protein structure can be found on the AlphaFold protein structure database (UniProt: Q7Z4V5). d, Alignment of WT and cryptic HDGFL2 amino acid sequences. The cryptic inclusion is 46 amino acids long (red) and does not impact flanking amino acids. Source data
Fig. 2
Fig. 2. Novel antibody shows specificity for HDGFL2 with cryptic peptide.
a, TDP-43 is reduced (arrowhead) in HeLa treated with TDP-43 siRNA (siTDP) compared with nontransfected control HeLa (ctrl). Ab, antibody. b, Reverse transcription PCR using primers designed to amplify the cryptic exon sequence of HDGFL2 shows a product (arrowhead) found only in siTDP. c, Protein extracts as in a were subjected to protein blot analysis using either an antibody (rabbit polyclonal antibody against human CTB-50L17.10, HPA044208) against the native HDGFL2 protein (left) or the novel monoclonal antibody (TC1HDG) against the cryptic sequence in HDGFL2 (right). While WT HDGFL2 was detected in both control and siTDP lysates (left and right bands at level of left arrowhead), HDGFL2 harboring the neoepitope (right arrowhead) was detected only in siTDP. d, IP blot using TC1HDG cryptic antibody for pulldown and WT HDGFL2 antibody for blotting revealed a band of the expected size only in siTDP (arrowhead). Lower bands represent presumable IgG heavy and light chains.
Fig. 3
Fig. 3. TC1HDG antibody detects cryptic HDGFL2 in neurons of the ALS–FTD brain.
Cryptic HDGFL2 was detected by our TC1HDG cryptic antibody (first row, yellow) specifically in neurons (arrowheads) of the motor cortex (first column) or hippocampus (third column) that are depleted of nuclear TDP-43 (second row, green) and contain phosphorylated TDP-43 (pTDP-43) cytoplasmic aggregates (third row, red). Note that cryptic HDGFL2 immunoreactivity is largely restricted to the nuclear compartments. Neurons with intact nuclear TDP-43 did not show cryptic HDGFL2 immunoreactivity. Scale bars, 20 µm.
Fig. 4
Fig. 4. Development of an MSD assay specific for cryptic HDGFL2.
a, Sandwich ELISA using the MSD system. b, A band corresponding to WT HDGFL2 was detectable by gTEA1.2 in lysates of nontransfected HeLa (ctrl), HeLa transfected to overexpress WT HDGFL2 (WT prot.) and HeLa transfected to overexpress cryptic HDGFL2 (cryptic prot.). A band corresponding to cryptic HDGFL2 was detectable by the TC1HDG cryptic antibody only in HeLa transfected to overexpress cryptic HDGFL2. c, A double band of the expected sizes was seen in HeLa lysate cotransfected to overexpress both cryptic and WT HDGFL2 (cryptic + WT prot.) when probed with an antibody against WT HDGFL2 (gTEA1.2). Probing with the TC1HDG cryptic antibody revealed a single band of the expected size in only the cryptic and WT co-overexpression lysate. d, A dose-dependent increase of MSD signal in the lysate of HeLa overexpressing cryptic HDGFL2 (circles) was observed compared with HeLa lysate overexpressing WT HDGFL2 (squares). e, Elevated MSD signal of cryptic HDGFL2 overexpression lysate is specific to intact capture and detection antibodies. Denatured capture antibody was heated at 95 °C for 30 min, and mouse IgG and sulfo-tagged goat IgG were used as isotype controls for capture and detection antibodies, respectively. RLU, relative light units.
Fig. 5
Fig. 5. Cryptic HDGFL2 is elevated in CSF of sporadic ALS and of C9orf72 mutation carriers, including in the presymptomatic stage.
a, Cryptic HDGFL2 CSF:diluent MSD signal ratios measured in CSF of healthy controls (n = 16), migraine controls (n = 25), NPH controls (n = 25), presymptomatic (n = 81) and symptomatic (n = 76) C9orf72 mutation carriers, and sporadic ALS (n = 44). Values and statistics are shown in Extended Data Table 1. Ratios >1 indicate elevated signal. Data presented as mean ± s.d. Data points represent individuals with longitudinal CSF measurements averaged as applicable. Mann–Whitney U-test with Holm–Bonferroni correction, *P ≤ 0.05, **P ≤ 0.01, ***P ≤ 0.001, ****P ≤ 0.0001. b, Cryptic HDGFL2 concentrations are negatively correlated with disease duration in NINDS symptomatic C9orf72 mutation carriers (Spearman, two-tailed, r = −0.45, P = 0.040), suggesting that cryptic HDGFL2 levels tend to be higher earlier in disease. c,d, CSF NfL (c) and pNfH (d) concentrations are positively correlated with disease duration during the first 25 months of symptomatic disease (Pearson, two-tailed, r = 0.58, P = 0.012 (c); r = 0.60, P = 0.006 (d)) and negatively correlated with disease duration after 25 months (Pearson, two-tailed, r = −0.59, P = 0.0003 (c); r = −0.66, P = 1.7 × 10−5 (d). eg, Change in CSF cryptic HDGFL2 (e), NfL (f) and pNfH (g) levels (ng ml−1) in presymptomatic C9orf72 mutation carriers across age (left) and in symptomatic C9orf72 mutation carriers across disease progression (right). Each line represents one individual. h, Proposed ALS staging model (adapted from Benatar et al.) based on the dynamic of NF subunit and cryptic HDGFL2 accumulation in CSF of C9orf72 mutation carriers. While CSF NF levels rise during the prodromal phase and continue increasing during the first few years of symptomatic disease, CSF cryptic HDGFL2 may peak before symptom onset and decrease during symptomatic disease progression. Due to these temporal differences, we propose a staging scale whereby the ratio of CSF NfL:cryptic HDGFL2 or pNfH:cryptic HDGFL2 concentrations would be <1 during the presymptomatic stage of ALS–FTD and increase to >1 during symptomatic disease. i, Among presymptomatic C9orf72 mutation carriers with detectable cryptic HDGFL2 levels and available NF measurements (n = 8), eight of eight (100%) individuals had NfL:cryptic HDGFL2 and pNfH:cryptic HDGFL2 ratios <1. Of the symptomatic C9orf72 mutation carriers with detectable cryptic HDGFL2 levels and available NfL (n = 13) or pNfH (n = 14) measurements, nine of 13 (69.2%) and ten of 14 (71.4%) individuals had NfL:cryptic HDGFL2 and pNfH:cryptic HDGFL2 ratios >1, respectively. Data presented as mean ± s.d.
Fig. 6
Fig. 6. Cryptic HDGFL2 can be detected by MSD assay in plasma of both presymptomatic and symptomatic C9orf72 mutation carriers.
a, In the symptomatic group (mean 2.1, s.d. 2.3, range 0.71–9.80), 17 of 37 (45.9%) plasma samples had cryptic HDGFL2 plasma:diluent MSD signal ratios >1. In the presymptomatic group (mean 1.1, s.d. 0.60, range 0.68–3.70), nine of 29 (31.0%) plasma samples had plasma:diluent signal ratios >1. The difference between symptomatic and presymptomatic C9orf72 mutation carriers was not significant (z = −0.82, P = 0.42, Mann–Whitney U-test). Cryptic HDGFL2 levels were also measured in older controls with NPH (n = 13, mean 1.6, s.d. 1.6, range 0.64–6.70) and in younger controls with migraine (n = 17, mean 1.0, s.d. 0.25, range 0.69–1.40). Data presented as mean ± s.d. Data points represent individual plasma samples. b, Plasma:diluent signal ratios were significantly correlated with CSF:diluent signal ratios from matching CSF samples (r = 0.83, P < 1.0 × 10−15, Pearson, two-tailed).
Extended Data Fig. 1
Extended Data Fig. 1. Strategy for developing cryptic peptide fluid biomarkers.
TDP-43 normally binds to UG repeats flanking cryptic exons and prevents them from being incorporated into messenger RNA (mRNA). When TDP-43 is lost from the nucleus, it fails to repress the splicing of cryptic exons. As some cryptic exons are incorporated in-frame, antibodies can be developed against cryptic exon-encoded peptides to serve as fluid biomarkers. PTC: premature termination codon.
Extended Data Fig. 2
Extended Data Fig. 2. Standard curves used for quantification of cryptic HDGFL2.
(A) Cryptic and WT HDGFL2 proteins were purified. Bands of the expected sizes are detectable by a goat antibody against WT HDGFL2 (gTEA1.2) for both proteins (upper panel). Only cryptic HDGFL2 shows a band of the expected size when probed with our novel TC1HDG cryptic antibody (lower panel). (B) There is a dose-dependent increase in MSD signal of purified cryptic HDGFL2 (circles) compared to WT HDGFL2 (squares). (C) At lower concentrations, MSD signal for purified cryptic HDGFL2 falls in a linear range (circles). MSD signal for WT HDGFL2 shown in squares. (D) Five standard curves from different MSD plates are shown and fitted with a four-parameter logistic (4PL) curve used for calculation of cryptic HDGFL2 concentration. Solid line represents the mean, and dotted lines represent the 95% confidence interval. R2 = 0.98. RLU: relative light units.
Extended Data Fig. 3
Extended Data Fig. 3. Cryptic HDGFL2 levels measured by MSD in C9orf72 mutation carriers from NINDS and DIALS cohorts.
(A) NINDS cohort CSF signal/diluent-only signal ratios. Of the symptomatic group (mean = 3.6, SD = 10.1, range = 0.69–71.2), 27/55 (49.1%) CSF samples had CSF/diluent signal ratios greater than 1, indicating elevated cryptic HDGFL2 signal. Of the presymptomatic group (mean = 1.4, SD = 1.3, range = 0.76–6.0), 13/34 (38.2%) CSF samples had CSF/diluent signal ratios greater than 1. Data are presented as mean +/- SD. Data points represent individual CSF samples. (B) DIALS cohort CSF signal/diluent-only signal ratios. Of the control group, 0/16 (0%) CSF samples had CSF/diluent ratios greater than 1. Of the symptomatic group, 1/4 (25.0%) CSF samples had CSF/diluent ratios greater than 1, and of the presymptomatic group, 13/47 (27.7%) CSF samples had CSF/diluent ratios greater than 1. The presymptomatic group had the highest average CSF/diluent signal ratio (mean = 1.8, SD = 4.2, range = 0.69–29.6) while the symptomatic group had the second highest average CSF/diluent signal ratio (mean = 0.93, SD = 0.15, range = 0.73–1.1). The control group had the lowest CSF/diluent signal ratio (mean = 0.85, SD = 0.08, range = 0.73–0.95). Data are presented as mean +/- SD. Data points represent individual CSF samples.
Extended Data Fig. 4
Extended Data Fig. 4. Effect of freeze-thaw on CSF cryptic HDGFL2 MSD assay.
Twenty-three C9orf72 mutation carrier CSF samples were assayed both upon first thaw and after one freeze-thaw cycle. Normalized MSD signals were slightly decreased for the previously thawed samples, but relative signal levels were preserved (simple linear regression, y = 1.324x-0.2966, R2 = 0.97, p < 1.0×10⁻¹⁵).
Extended Data Fig. 5
Extended Data Fig. 5. CSF cryptic HDGFL2 levels measured by MSD in all CSF samples grouped into sporadic ALS, C9orf72 mutation carriers, and controls.
The CSF/diluent ratios in sporadic ALS (n = 44 individuals, mean = 1.79, SD = 3.50; z = −4.09, p = 6x10⁻⁵) and C9orf72 mutation carriers (n = 96 individuals for statistical analysis, data points show all n = 157 CSF samples, mean = 2.30, SD = 6.52, z = −3.71, p = 0.0002) were significantly higher than those in control CSF samples (n = 62 individuals for statistical analysis, data points show all n = 66 CSF samples, mean = 1.09, SD = 1.07). Where multiple CSF samples were available from one individual, CSF/diluent ratios for each sample were averaged for that individual for statistical analyses. Signal ratios were compared between disease groups and all controls with the Mann-Whitney U test (two-tailed). The Holm-Bonferroni correction was applied to all p-values. ***: p ≤ 0.001, ****: p ≤ 0.0001. Data are presented as mean +/- SD.
Extended Data Fig. 6
Extended Data Fig. 6. Cryptic HDGFL2 can be detected by a different MSD assay in CSF of both presymptomatic and symptomatic C9orf72 mutation carriers.
(A) Original sandwich ELISA using Meso Scale Discovery (MSD) system. (B) Elevated cryptic HDGFL2 levels are detected in presymptomatic (n = 34 CSF samples, mean = 665.4, SD = 142.5, p = 0.0009) and symptomatic (n = 54 CSF samples, mean = 758.4, SD = 152.2, p = 3.3x10⁻⁷) C9orf72 mutation carriers compared to controls (n = 10 CSF samples, mean = 451.4, SD = 178.8). Elevated cryptic HDGFL2 levels are not found in the small cohort of sporadic ALS (n = 6 CSF samples, mean = 513.0, SD = 154.7, p = 0.86). The box extends from the 25th to the 75th percentile, with the middle line at the median. The whiskers extend from the minimum to the maximum. Analysis performed with one-way ANOVA with Tukey’s multiple comparisons test. *: p ≤ 0.05, **: p ≤ 0.01, ***: p ≤ 0.001, ****: p ≤ 0.0001. (C) Cryptic HDGFL2 detection by our MSD assay in CSF of C9orf72 mutation carriers diagnosed with ALS, FTD, or ALS-FTD tends to be higher during the earlier stage of symptomatic disease. Pearson correlation (two-tailed), r = −0.30, p = 0.027.
Extended Data Fig. 7
Extended Data Fig. 7. Cryptic HDGFL2 signals in C9orf72 mutation carrier CSF samples analyzed with the current two-antibody MSD assay and a different three-antibody MSD assay are significantly correlated.
Pearson correlation (two-tailed), r = 0.36, p = 0.0005. Data points show the ratios of CSF signal normalized to signal of wells containing diluent only. The current two-antibody assay demonstrates reduced background signal.
Extended Data Fig. 8
Extended Data Fig. 8. Effect of freeze-thaw on plasma cryptic HDGFL2 MSD assay.
Six C9orf72 mutation carrier plasma samples were assayed both upon first thaw and after one freeze-thaw cycle. Normalized MSD signals were slightly decreased for the previously thawed samples, but relative signal levels were preserved (simple linear regression, y = 1. 366x-0.05577, R2 = 0.92, p = 0.002).
Extended Data Fig. 9
Extended Data Fig. 9. CSF and plasma cryptic HDGFL2 levels are highly correlated in C9orf72 mutation carriers.
(A) Pearson correlation (two-tailed) of plasma and CSF cryptic HDGFL2 signal ratios in C9orf72 mutation carriers (n = 57 matching plasma/CSF samples), r = 0.93, p < 1.0x10⁻¹⁵. One CSF ratio outlier removed. (B) Pearson correlation (two-tailed) of plasma and CSF cryptic HDGFL2 signal ratios in migraine and NPH disease controls (n = 30 individuals/matching plasma and CSF samples), r = 0.19, p = 0.30. CSF and plasma signals are not correlated in controls. (C) Non-zero CSF and plasma cryptic HDGFL2 concentrations are correlated in C9orf72 mutation carriers (n = 12 matching plasma/CSF samples). Pearson correlation (two-tailed), r = 0.93, p = 8.3x10⁻⁶. The equation for the line of best fit was y = 0.39x + 3.70 (linear regression, R2 = 0.87, p = 8.3x10⁻⁶). Higher concentrations of cryptic HDGFL2 can be found in CSF than in plasma.

Update of

References

    1. Neumann M, et al. Ubiquitinated TDP-43 infFrontotemporal lobar degeneration and amyotrophic lateral sclerosis. Science. 2006;314:130–133. doi: 10.1126/science.1134108. - DOI - PubMed
    1. Barmada SJ, et al. Cytoplasmic mislocalization of TDP-43 is toxic to neurons and enhanced by a mutation associated with familial amyotrophic lateral sclerosis. J. Neurosci. 2010;30:639–649. doi: 10.1523/JNEUROSCI.4988-09.2010. - DOI - PMC - PubMed
    1. Brettschneider J, et al. Stages of pTDP-43 pathology in amyotrophic lateral sclerosis. Ann. Neurol. 2013;74:20–38. doi: 10.1002/ana.23937. - DOI - PMC - PubMed
    1. Lee EB, Lee VMY, Trojanowski JQ. Gains or losses: molecular mechanisms of TDP43-mediated neurodegeneration. Nat. Rev. Neurosci. 2011;13:38–50. doi: 10.1038/nrn3121. - DOI - PMC - PubMed
    1. Taylor JP, Brown RH, Cleveland DW. Decoding ALS: from genes to mechanism. Nature. 2016;539:197–206. doi: 10.1038/nature20413. - DOI - PMC - PubMed

MeSH terms

Supplementary concepts