. 2024 Jan 27;14(1):2262.
doi: 10.1038/s41598-024-52628-w.

Response of the modified GAFCHROMIC EBT2 radiochromic film to DC glow discharge plasma

Affiliations

Response of the modified GAFCHROMIC EBT2 radiochromic film to DC glow discharge plasma

Omar F Farag et al. Sci Rep. .

Abstract

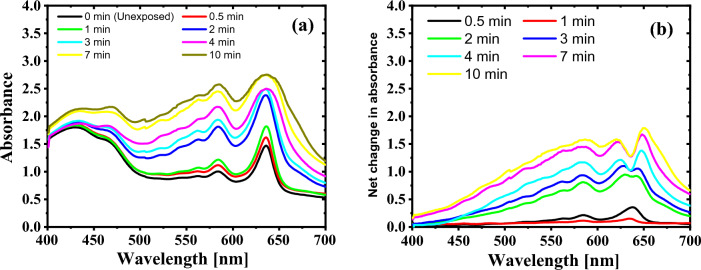
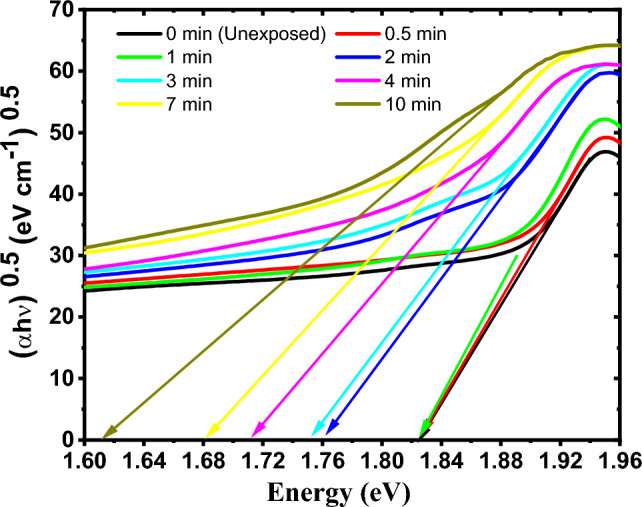
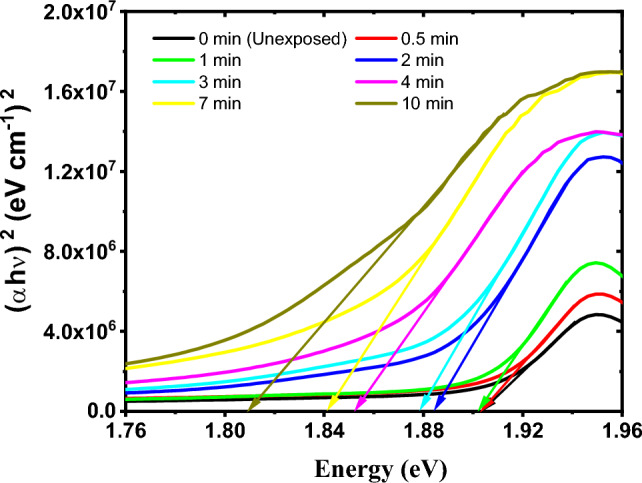
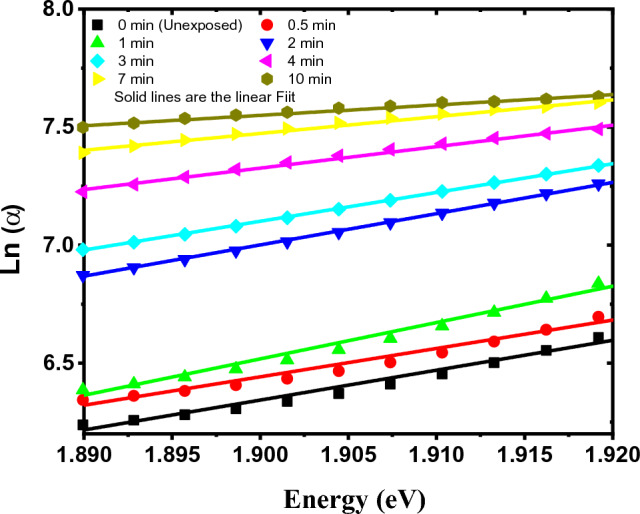
The response of the modified GAFCHROMIC EBT2 radiochromic film to DC Oxygen glow discharge plasma was investigated using a flatbed scanner and an UV-Vis spectrophotometer. The film was modified by removing the polyester overlaminate, adhesive, and topcoat layers with a total thickness of 80 µm, and is now referred to as EBT2-M. The EBT2-M films were exposed to DC Oxygen plasma for different durations: 0, 0.5, 1, 2, 3, 4, 7, and 10 min. The exposed films exhibit coloration homogeneity with an average variation of (1.6 ± 0.3) × 10-4 pixel values/µm, irrespective of the applied exposure time. The pixel values of the red-and-green channels and weighted grayscale images decreased exponentially with different sensitivity amounts to [Formula: see text] 39.67, 49.69, and 42.11 min-1, respectively, as the exposure time increased. The two absorption peaks at 580 ± 4 nm and 632 ± 4 nm in the UV-Vis absorption spectra of the exposed GAFCHROMIC EBT2-M radiochromic films are increasing with increasing exposure time up to 4 min, thereafter saturated for prolonged exposure time. The integrated absorbance in the range from 400 to 700 nm is linearly correlated with the exposure time. The indirect and direct optical energy band gaps and Urbach energy of the modified GAFCHROMIC EBT2 film are weakly correlated with the exposure time. These findings suggest the utilization of the modified GAFCHROMIC EBT2 radiochromic film as a novel and simple technique for plasma diagnostics.


Conflict of interest statement

The authors declare no competing interests.

Figures

Figure 1
Figure 1
(a) A block diagram of the DC glow discharge plasma unit. (b) Electrical circuit. The modified GAFCHROMIC EBT2 radiochromic film is located parallel to the two electrodes in front of the cathode.
Figure 2
Figure 2
(a) Structure of the GAFCHROMIC EBT2 film and the corresponding image scanned by Cannon CanoScan (Model LiDE 110) flatbed scanner. (b) Modified GAFCHROMIC film (EBT2-M) by removing the polyester overlaminate, adhesive, and topcoat layers with a total thickness of of 80 μm, and its corresponding scanned image. (c) GAFCHROMIC EBT2 films exposed to DC Oxygen plasma for 5 and 10 min. (d) The projected line profile intensities of each image in a, b, and c. (e) The corresponding UV–Vis absorption spectra.
Figure 3
Figure 3
(a) Images of the GAFCHROMIC EBT2-M radiochromic films exposed to DC Oxygen plasma for different durations ranging from 0 to 10 min that are scanned using Canon CanoScan (Model LiDE 110) flatbed scanner. The area of each image is 25,000 × 17,700 μm2. (b) The projected line profile intensities of each image.
Figure 4
Figure 4
Color channel levels of the GAFCHROMIC EBT2-M films that were exposed to DC Oxygen plasma for different durations ranging from 0 to 10 min.
Figure 5
Figure 5
(a) UV–Vis absorption spectra for the GAFCHROMIC EBT2-M films exposed to DC Oxygen plasma and (b) the net absorbance spectra as a function of wavelength, for different exposure time. The wavelength is ranging from 400 to 700 nm.
Figure 6
Figure 6
(a) The response curves of the GAFCHROMIC EBT2-M films a function of exposure time to DC Oxygen plasma at the two characteristic absorption peaks of wavelengths 580 ± 4 nm and 632 ± 4 nm. (b) The corresponding integrated absorbance in the range of wavelengths from 400 to 700 nm.
Figure 7
Figure 7
The indirect band gap in the GAFCHROMIC EBT2-M films exposed to DC Oxygen plasma for different exposure time.
Figure 8
Figure 8
The direct band gap in the GAFCHROMIC EBT2-M films exposed to DC Oxygen plasma for different exposure time.
Figure 9
Figure 9
The natural logarithm of the absorption coefficient (α) versus photon energy for the GAFCHROMIC EBT2-M films exposed to DC Oxygen plasma for different exposure time.

References

    1. Santos T, Ventura T, Ventura T, do Carmo Lopes M. A review on radiochromic film dosimetry for dose verification in high energy photon beams. Radiat. Phys. Chem. 2020;2021(179):109217. doi: 10.1016/j.radphyschem.2020.109217. - DOI
    1. Arjomandy B, Tailor R, Anand A, et al. Energy dependence and dose response of Gafchromic EBT2 film over a wide range of photon, electron, and proton beam energies. Med. Phys. 2010;37(5):1942–1947. doi: 10.1118/1.3373523. - DOI - PubMed
    1. Butson MJ, Yu PKN, Cheung T, Alnawaf H. Energy response of the new EBT2 radiochromic film to X-ray radiation. Radiat. Meas. 2010;45(7):836–839. doi: 10.1016/j.radmeas.2010.02.016. - DOI
    1. Butson MJ, Yu PKN, Cheung T, Metcalfe P. Radiochromic film for medical radiation dosimetry. Mater. Sci. Eng. R Rep. 2003;41(3–5):61–120. doi: 10.1016/S0927-796X(03)00034-2. - DOI
    1. Soares CG. Radiochromic film dosimetry. Radiat. Meas. 2006;41(1):100. doi: 10.1016/j.radmeas.2007.01.007. - DOI - PubMed