. 2024 Mar;21(3):531-540.
doi: 10.1038/s41592-023-02144-y. Epub 2024 Jan 26.

scPerturb: harmonized single-cell perturbation data

Affiliations

scPerturb: harmonized single-cell perturbation data

Stefan Peidli et al. Nat Methods. 2024 Mar.

Abstract

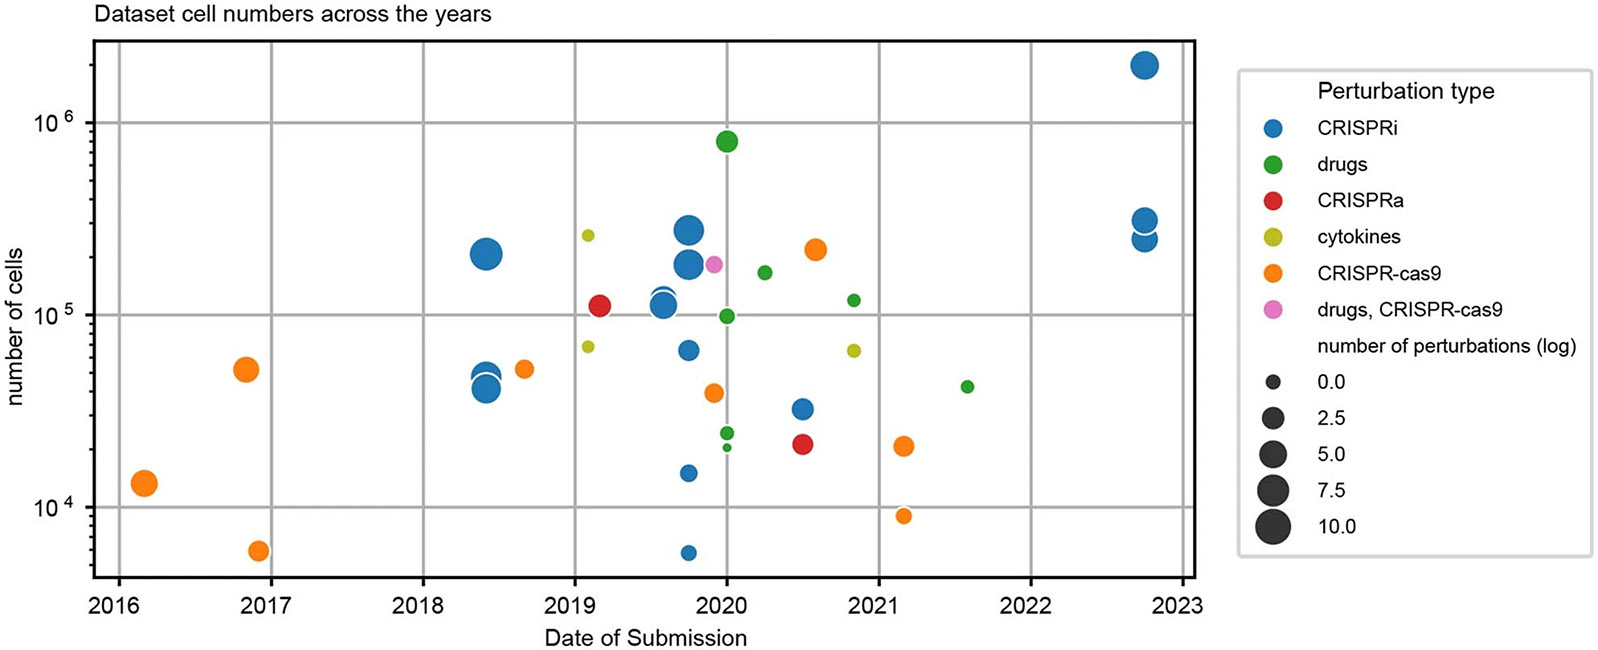
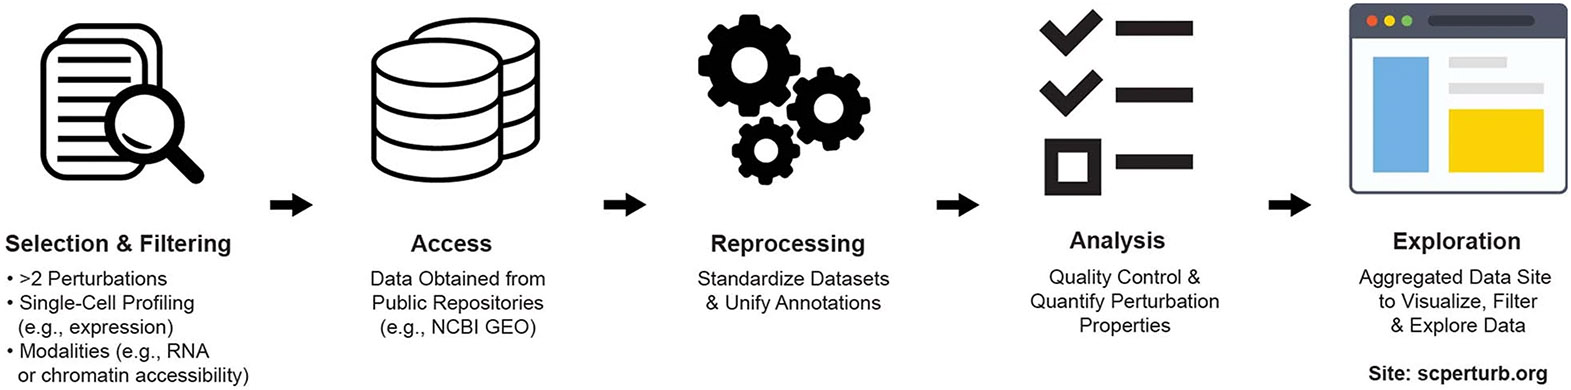
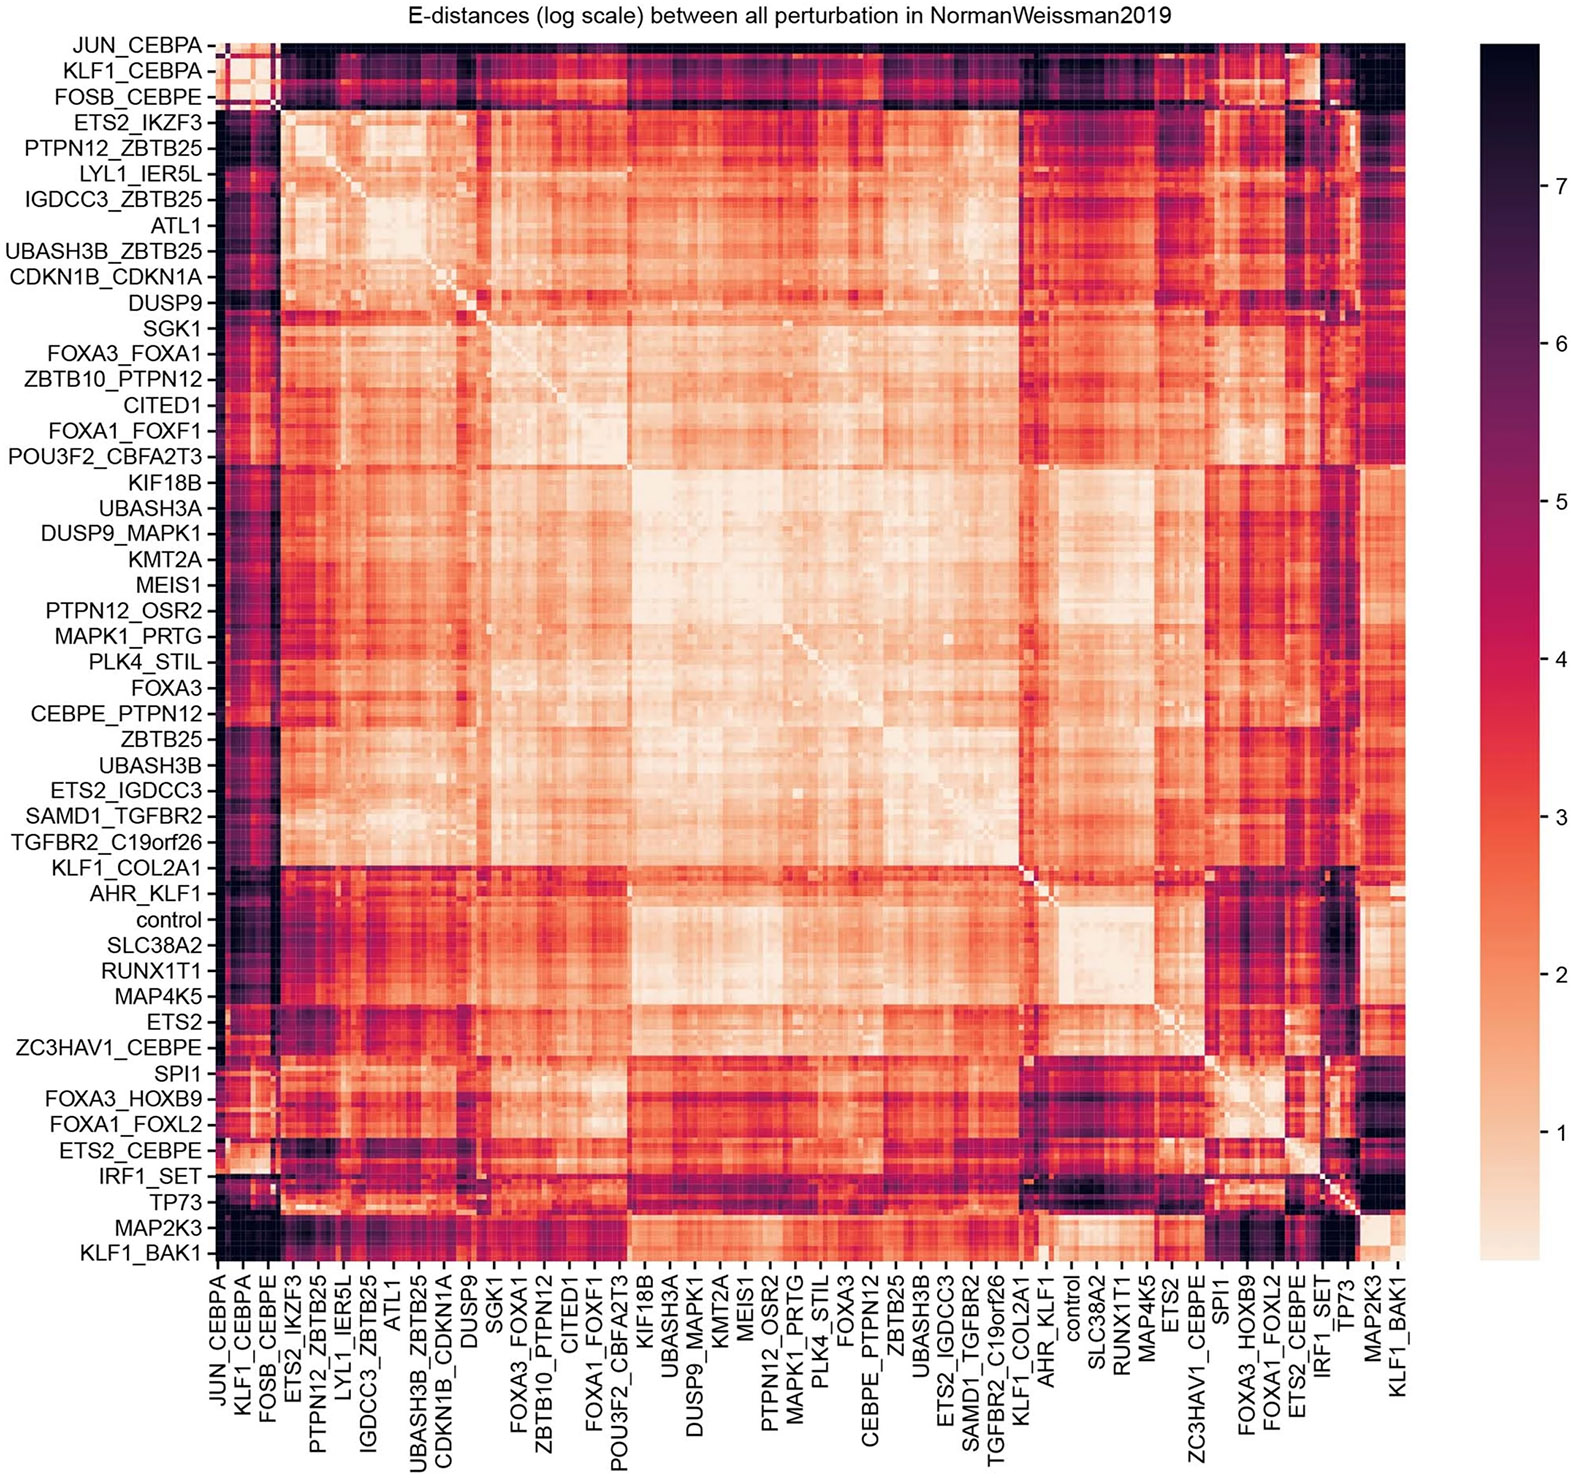
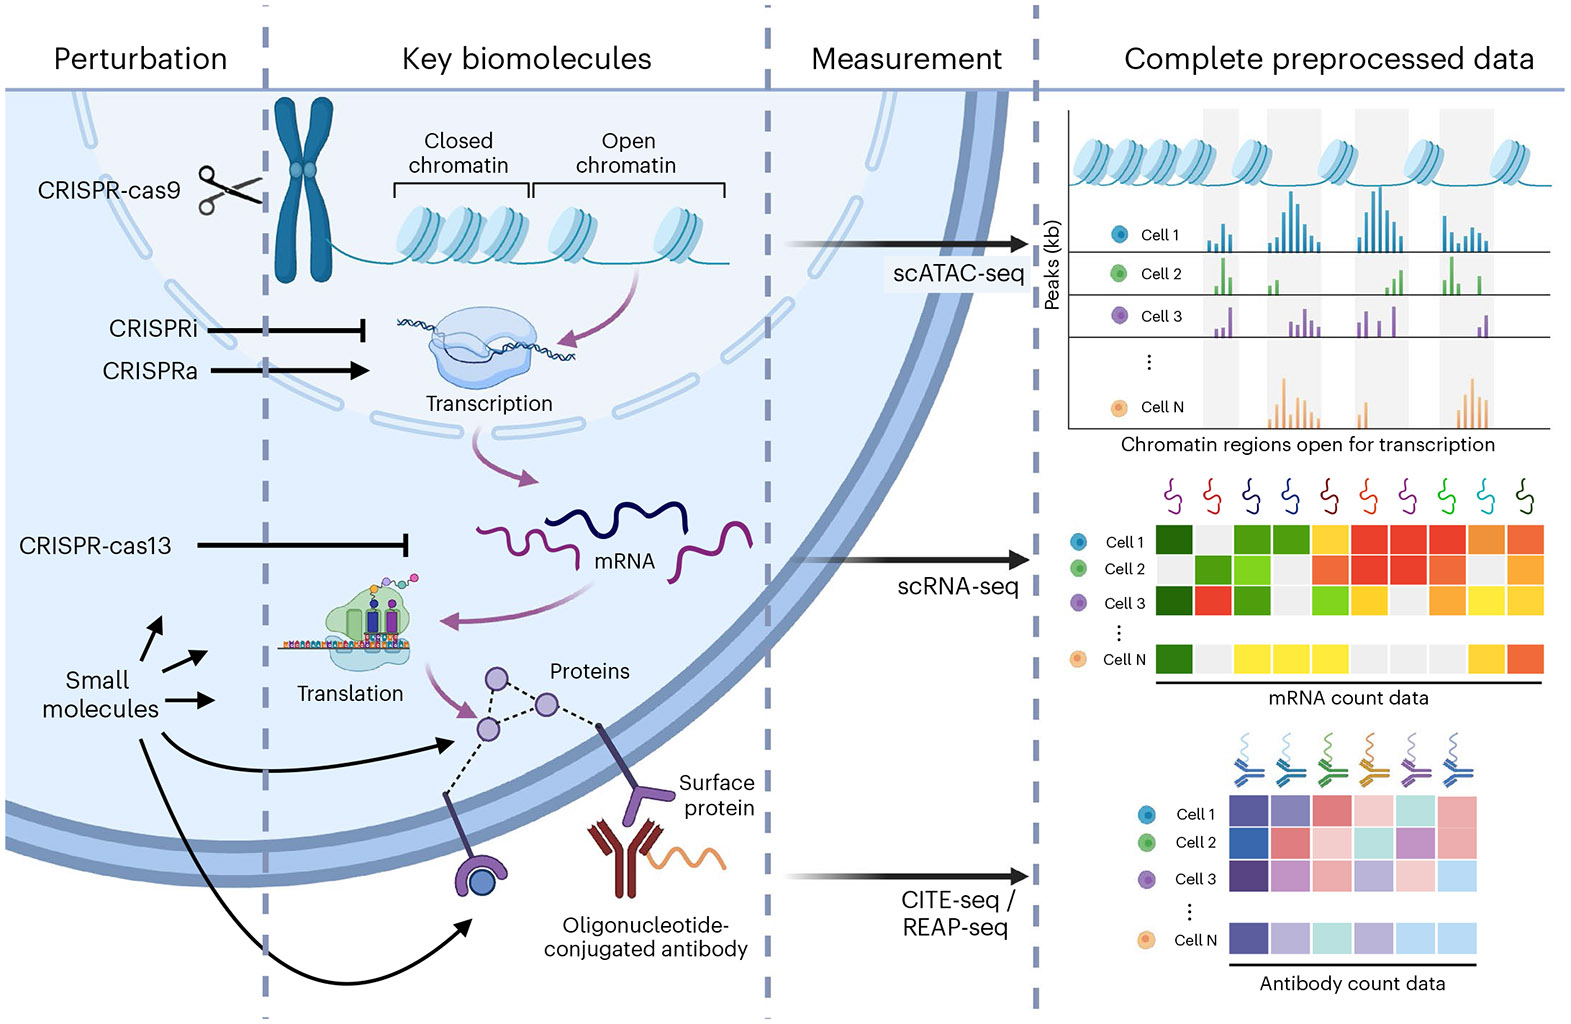
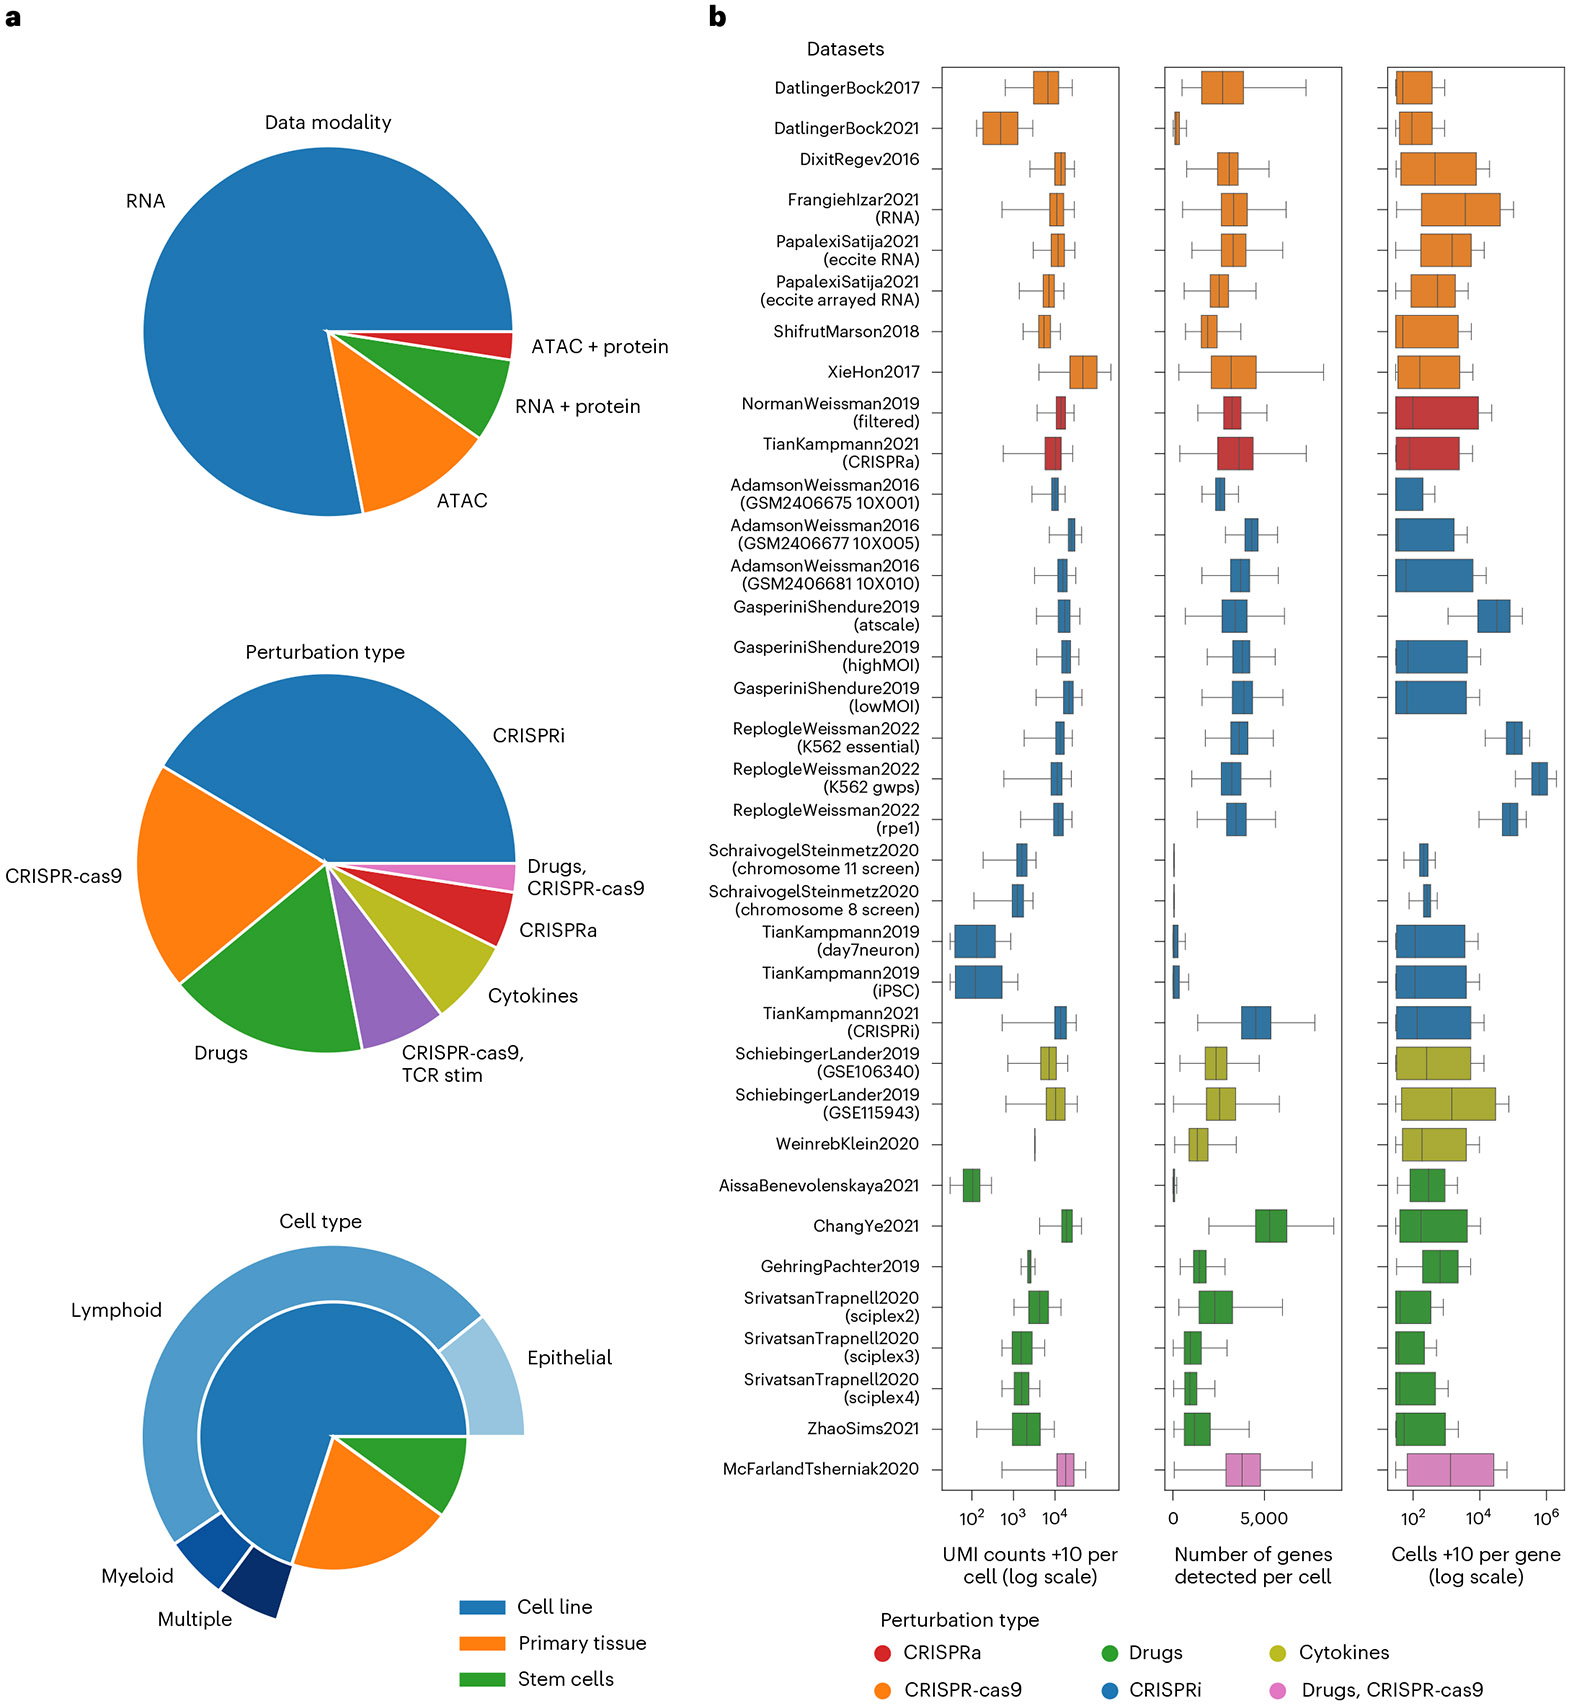
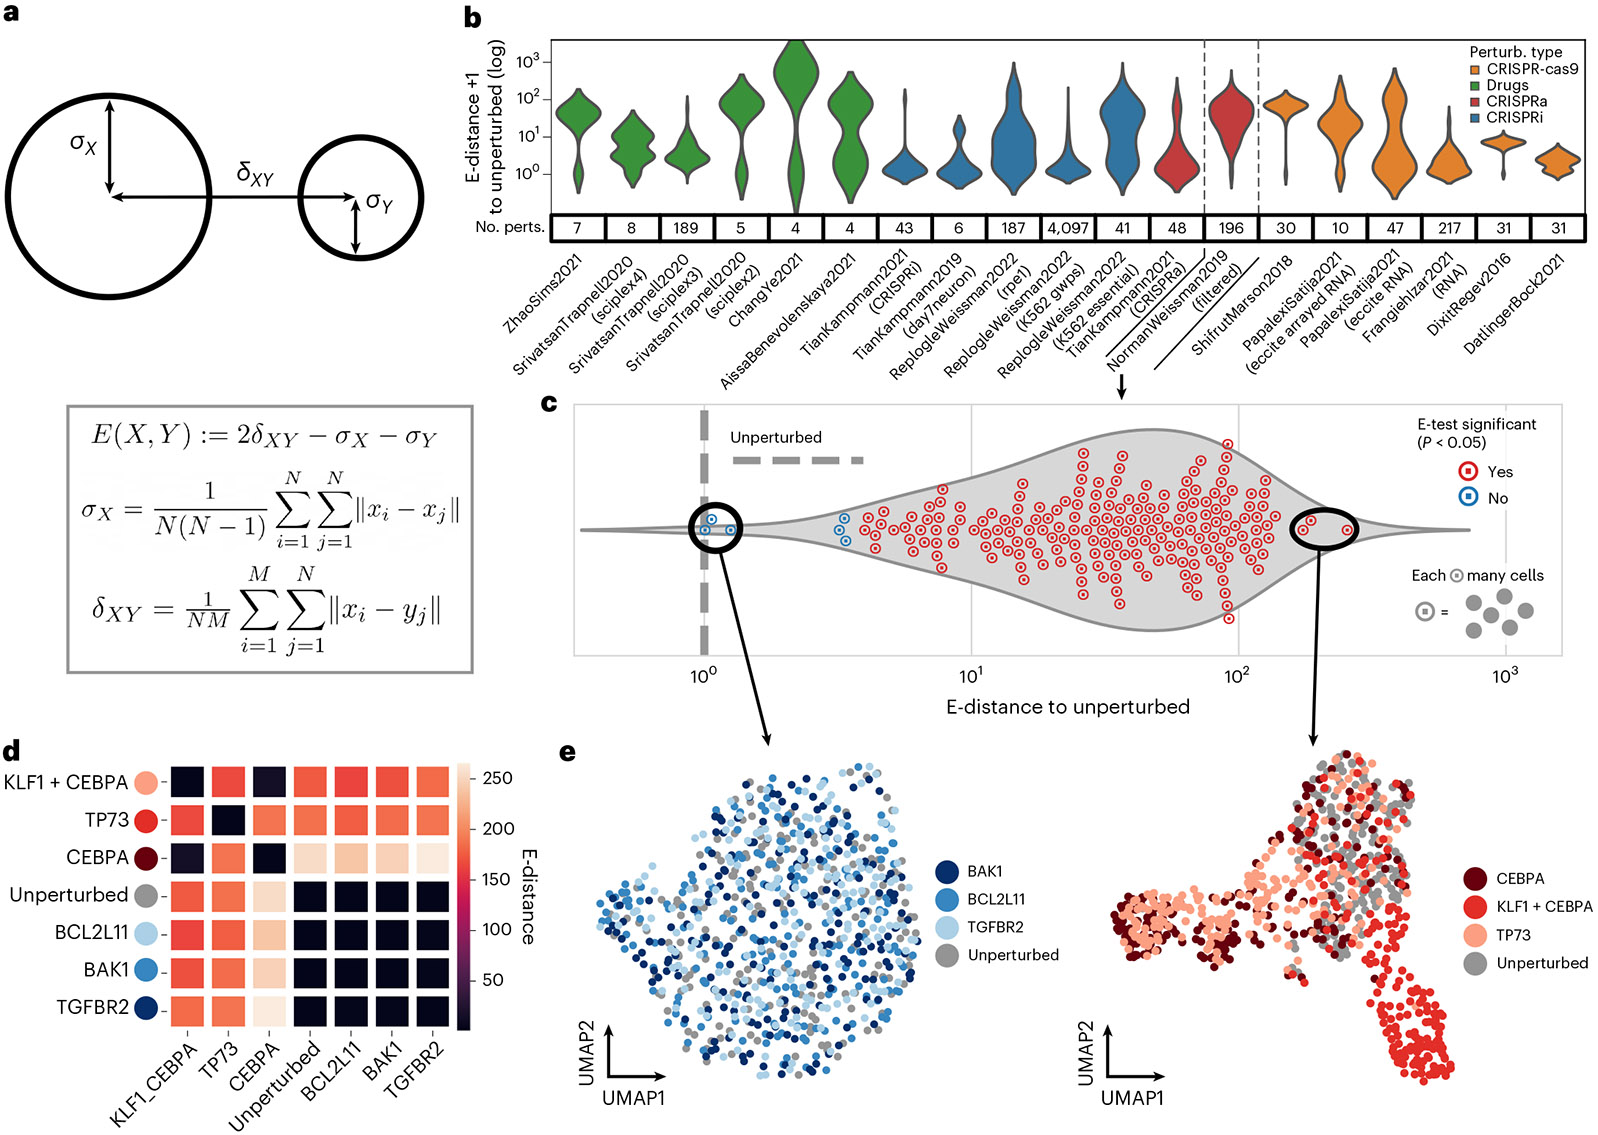
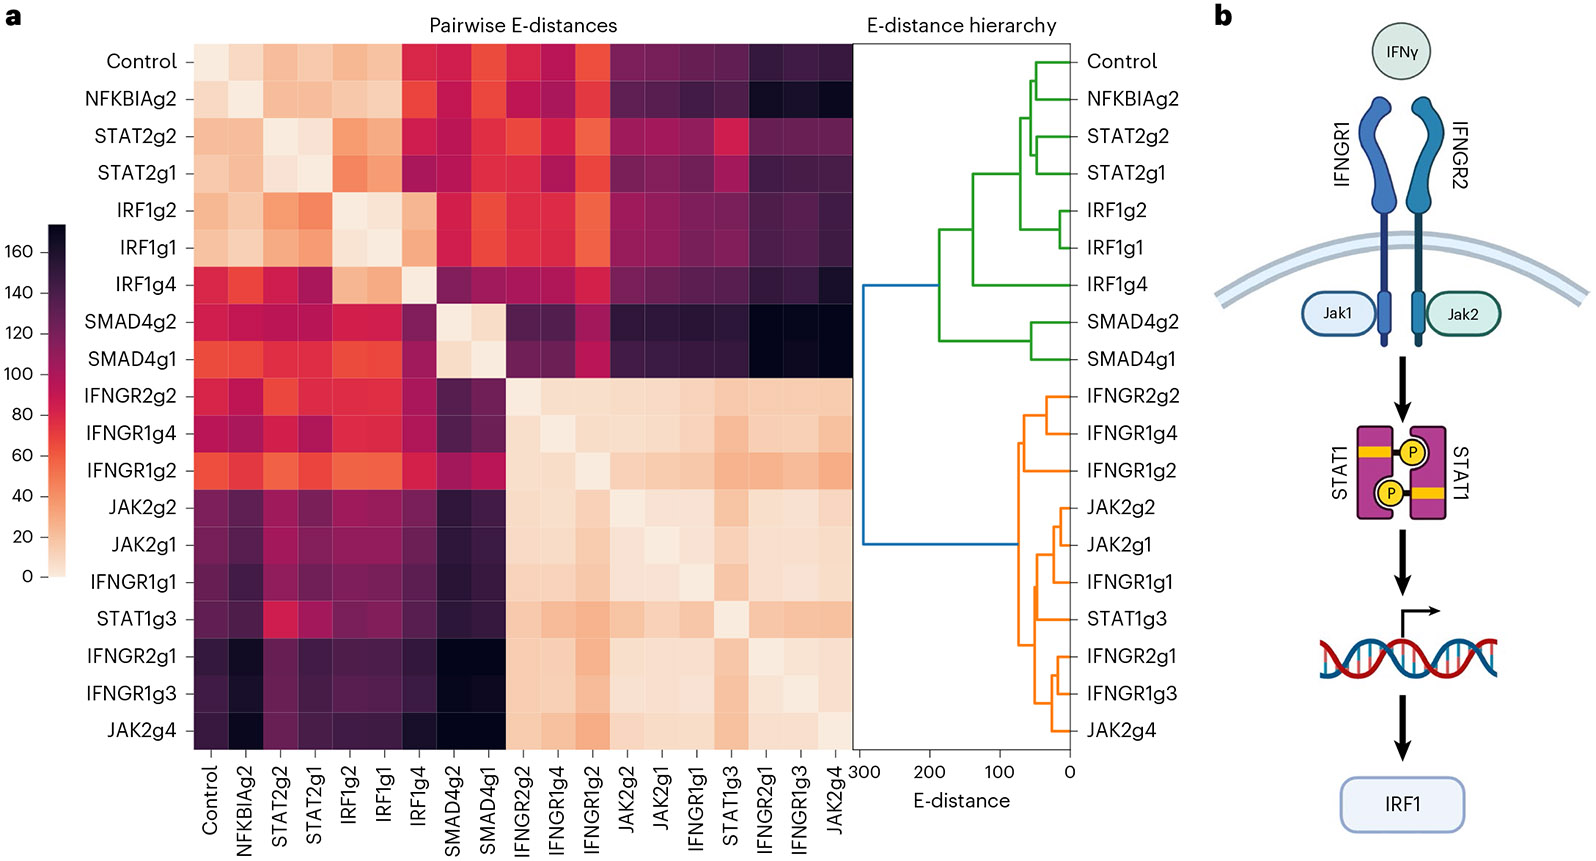
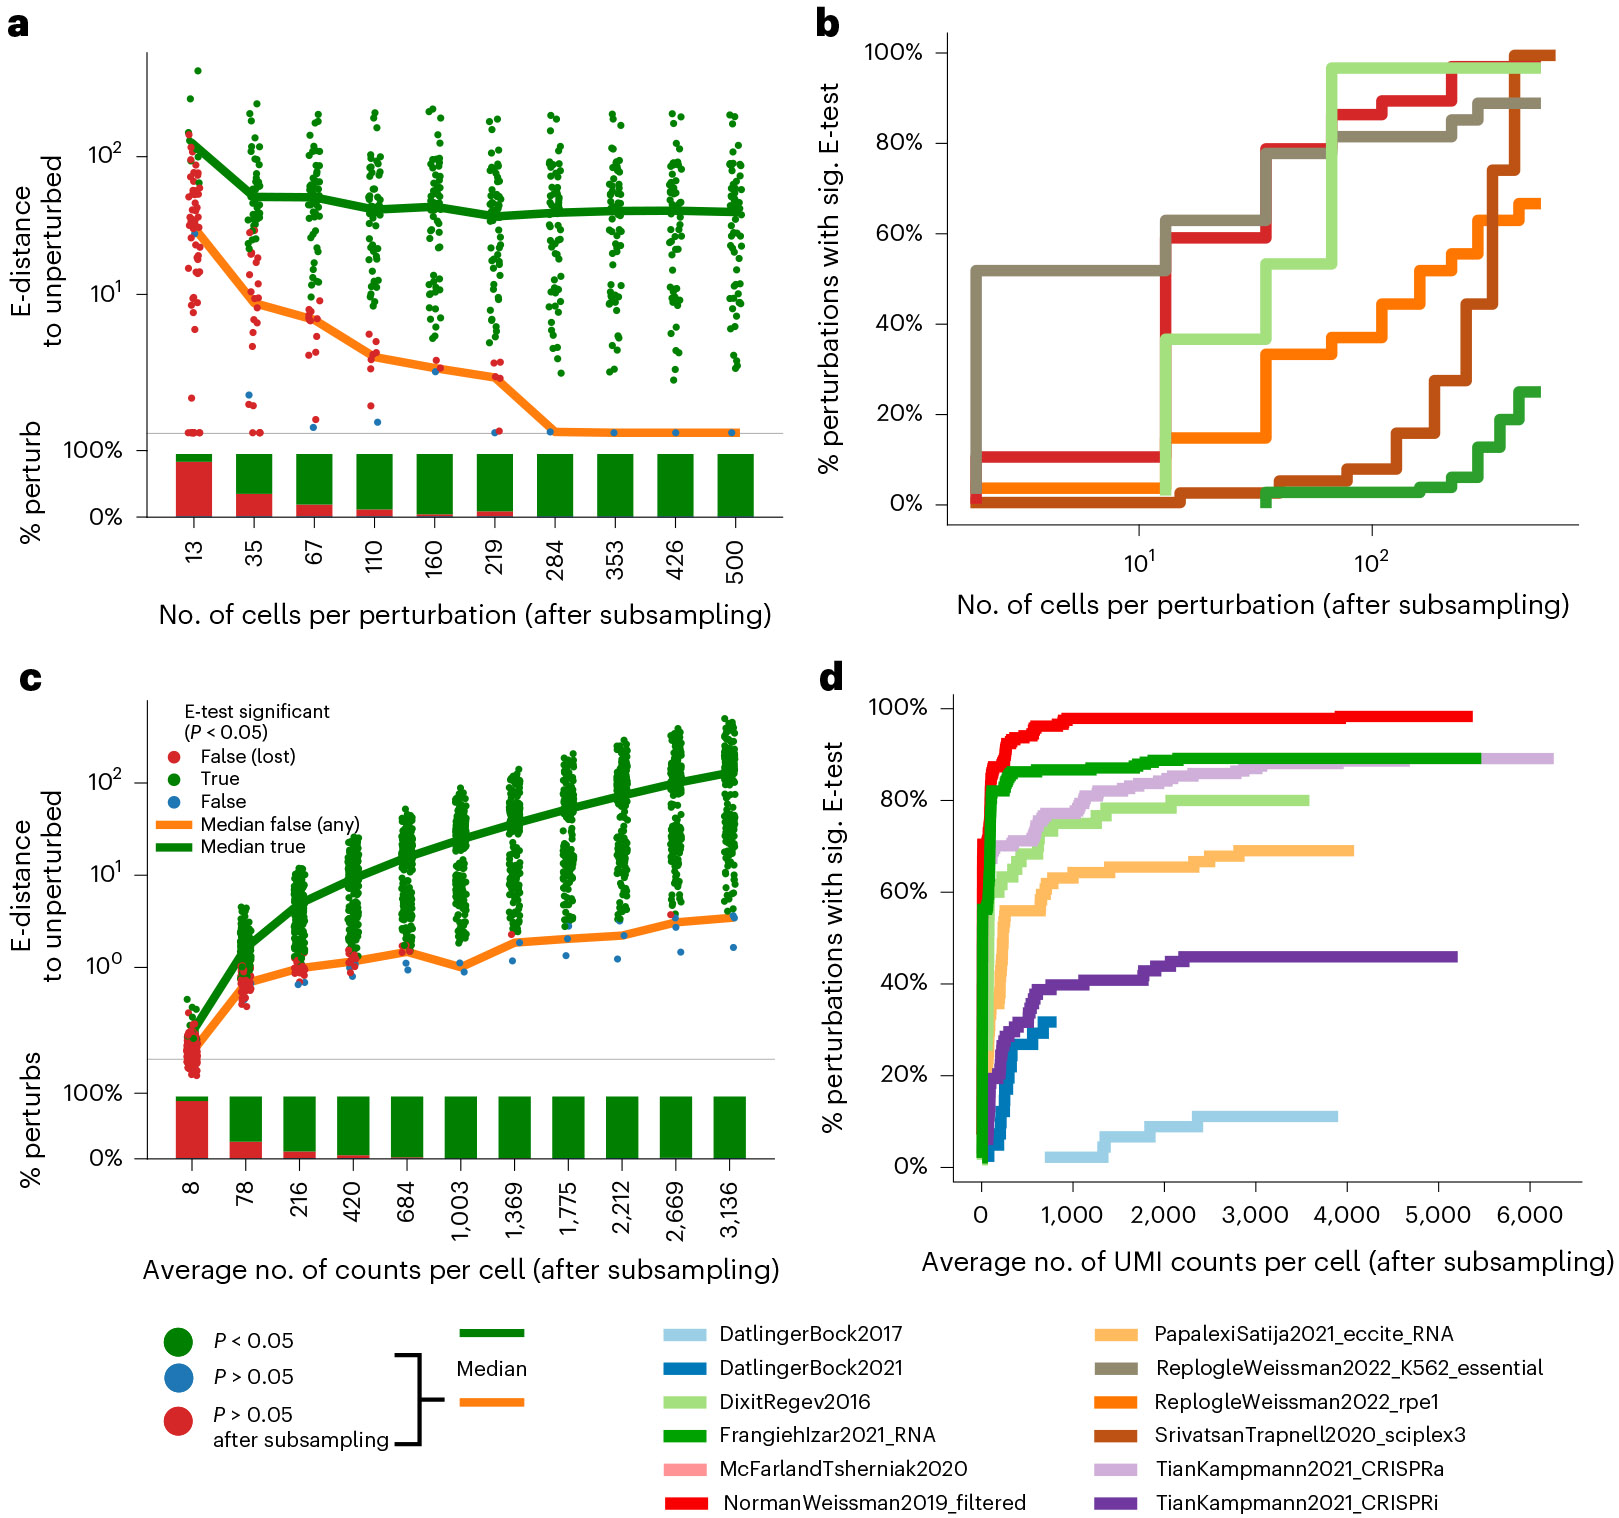
Analysis across a growing number of single-cell perturbation datasets is hampered by poor data interoperability. To facilitate development and benchmarking of computational methods, we collect a set of 44 publicly available single-cell perturbation-response datasets with molecular readouts, including transcriptomics, proteomics and epigenomics. We apply uniform quality control pipelines and harmonize feature annotations. The resulting information resource, scPerturb, enables development and testing of computational methods, and facilitates comparison and integration across datasets. We describe energy statistics (E-statistics) for quantification of perturbation effects and significance testing, and demonstrate E-distance as a general distance measure between sets of single-cell expression profiles. We illustrate the application of E-statistics for quantifying similarity and efficacy of perturbations. The perturbation-response datasets and E-statistics computation software are publicly available at scperturb.org. This work provides an information resource for researchers working with single-cell perturbation data and recommendations for experimental design, including optimal cell counts and read depth.


Figures

Extended Data Fig. 1
Extended Data Fig. 1. Number of cells per dataset by submission date.
There is a rapid increase in published single-cell perturbation datasets around 2019. We speculate that the slight decrease of dataset numbers after 2021 suggested by the plot is due to the ongoing impact of reduced research in the earlier phases of the COVID-19 pandemic.
Extended Data Fig. 2
Extended Data Fig. 2. Harmonization and analysis workflow.
Perturbation datasets with single-cell molecular profiles with at least two perturbations and one control condition (for example unperturbed) of various modality types were identified in a literature search. Data were obtained from public repositories, and metadata (such as guide identity) from paper supplements. Datasets were reprocessed to standardize annotations and analyzed in parallel. All datasets are now available for download from scperturb.org, along with visualizations and summarizing information.
Extended Data Fig. 3
Extended Data Fig. 3. Pairwise E-distances for NormanWeissman2019 dataset.
E-distances between all pairs of perturbations in the dataset NormanWeissman2019. The color scale is clipped at 5% highest and lowest percentiles. Clusters of similar perturbations are visible, for example a cluster of strongly acting perturbations targeting CEBPA at the top.
Fig. 1
Fig. 1. Perturbation–response profiling for single cells.
Different perturbations act at different layers in the hierarchy of gene expression and protein production (purple arrows). Perturbations included in scPerturb include CRISPR-cas9, which directly perturbs the genome; CRISPRa, which activates transcription of a target gene; CRISPRi, which blocks transcription of targeted genes; CRISPR-cas13, which cleaves targeted mRNAs and promotes their degradation; cytokines that bind cell surface receptors; and small molecules that perturb various cellular mechanisms. Single-cell measurements probe the response to perturbation, also at different layers of gene expression: scATAC-seq directly probes chromatin state; scRNA-seq measures mRNA; and protein count data currently is typically obtained via antibodies bound to proteins. REAP-seq, RNA expression and protein sequencing.
Fig. 2
Fig. 2. Single-cell perturbation–response datasets are diverse in type, size and quality.
a, Datasets span a multitude of tissues and perturbation types. The majority of included datasets result from CRISPR (DNA cut, inhibition or activation) perturbations using cell lines derived from various cancers. The studies performed on cells from primary tissues generally use drug perturbations. Primary tissue refers to samples taken directly from patients or mice, sometimes with multiple cell types. b, Sequencing and cell count metrics across scPerturb perturbation datasets (rows), colored by perturbation type. From left to right: total RNA counts per cell (left); number of genes with at least one count in a cell (middle); number of cells with at least one count of a gene per gene (right). Most datasets have on average approximately 3,000 genes measured per cell, although some outlier datasets have significantly sparser coverage of genes. Number of cells per experiment (n) is listed in Table 1; average is 160,000; median, 65,000. Center line, median; box limits, upper and lower quartiles; whiskers, 1.5-fold the interquartile range. iPSC, induced pluripotent stem cell; MOI, multiplicity of infection.
Fig. 3
Fig. 3. E-statistics describe distinctiveness of perturbations in single-cell data.
a, Definition of E-distance, relating the width of cell distributions of high-dimensional molecular profiles to their distance from each other (see Methods). A large E-distance of perturbed cells from unperturbed indicates a strong change in molecular profile induced by the perturbation. b, Distribution of E-distances (for log scale, same in c) between perturbed and unperturbed cells across datasets. No. perts, number of perturbations per dataset. Note that this plot is best used to compare the shape of the E-distance distribution rather than the magnitude; the mean E-distance will vary significantly with other dataset properties. ce, Analysis based on E-statistics for one selected dataset. c, Distribution of E-distances between perturbed and unperturbed cells as in b. Each circled point is a perturbation, that is, it represents a set of cell profiles. Each perturbation was tested for significant E-distance to unperturbed (E-test). Distances and P values for each perturbation are listed in Supplementary Table 3. d, Pairwise E-distance matrix across the top and bottom three perturbations in c and the unperturbed cells. e, UMAP of single cells of the weakest (left, bottom three) and strongest (right, top three) perturbations.
Fig. 4
Fig. 4. E-distance dissects perturbation hierarchy in data from Papalexi et al..
a, E-distance between cells of all pairs of perturbations in the Papalexi et al. dataset. Hierarchical clustering of this matrix produces two groups, one that is more similar to unperturbed cells (green) and one that has a stronger transcriptional change (orange). b, Signaling pathway downstream of the IFNγ receptor. Permutations of nodes upstream of IRF1 induce similar phenotypes.
Fig. 5
Fig. 5. Effect of subsampling UMI counts per cell and number of cells per perturbation on E-statistics.
a, E-distance of each perturbation to unperturbed in the Norman et al. dataset while subsampling the number of cells per perturbation. Color indicates E-test results; ‘significance lost’: perturbation significant when all cells are considered, but not significant after subsampling. The E-test loses significance with lower cell numbers while the E-distance actually increases. b, The overall number of perturbations with significant (sig.) E-test decreases when subsampling cells per perturbation. c, As in a but subsampling UMI counts per cell while keeping the number of cells constant. E-test significance was lost and E-distance to unperturbed dropped as the overall signal deteriorated with removal of UMI counts. d, As in b but subsampling UMI counts per cell while keeping the number of cells constant.

Similar articles

Cited by

References

    1. Datlinger P. et al. Pooled CRISPR screening with single-cell transcriptome readout. Nat. Methods 14, 297–301 (2017). - PMC - PubMed
    1. Dixit A, Parnas O, Li B & Chen J. Perturb-seq: dissecting molecular circuits with scalable single-cell RNA profiling of pooled genetic screens. Cell 167, 1853–1866 (2016). - PMC - PubMed
    1. Jaitin DA et al. Dissecting immune circuits by linking CRISPR-pooled screens with single-cell RNA-seq. Cell 167, 1883–1896 (2016). - PubMed
    1. Gilbert LA et al. Genome-scale CRISPR-mediated control of gene repression and activation. Cell 159, 647–661 (2014). - PMC - PubMed
    1. Wessels H-H et al. Efficient combinatorial targeting of RNA transcripts in single cells with Cas13 RNA Perturb-seq. Nat. Methods 20, 86–94 (2023). - PMC - PubMed

LinkOut - more resources