. 2024 Mar;43(5):666-694.
doi: 10.1038/s44318-024-00031-6. Epub 2024 Jan 26.

Weakened APC/C activity at mitotic exit drives cancer vulnerability to KIF18A inhibition

Affiliations

Weakened APC/C activity at mitotic exit drives cancer vulnerability to KIF18A inhibition

Colin R Gliech et al. EMBO J. 2024 Mar.

Abstract

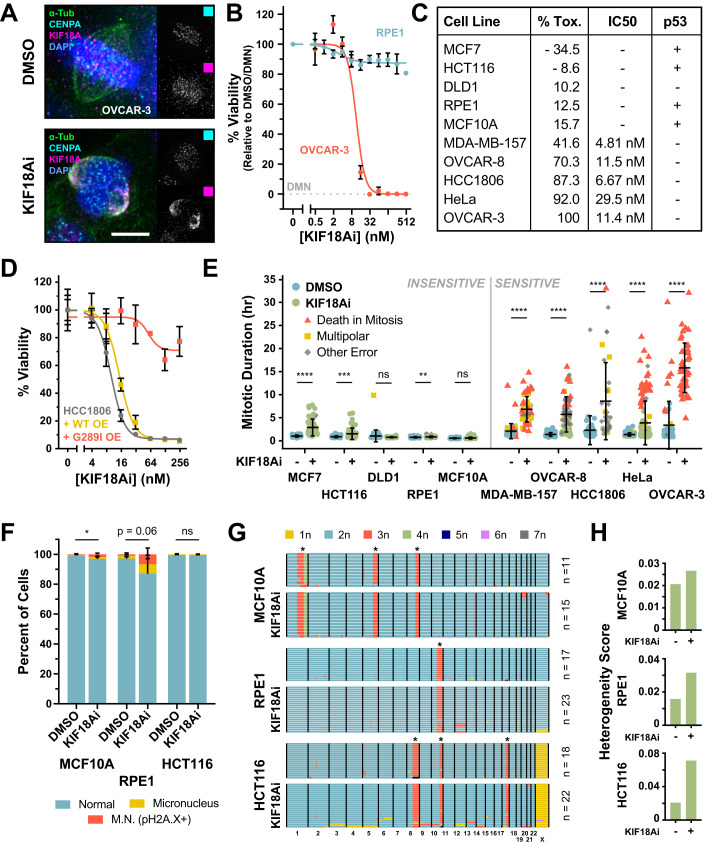
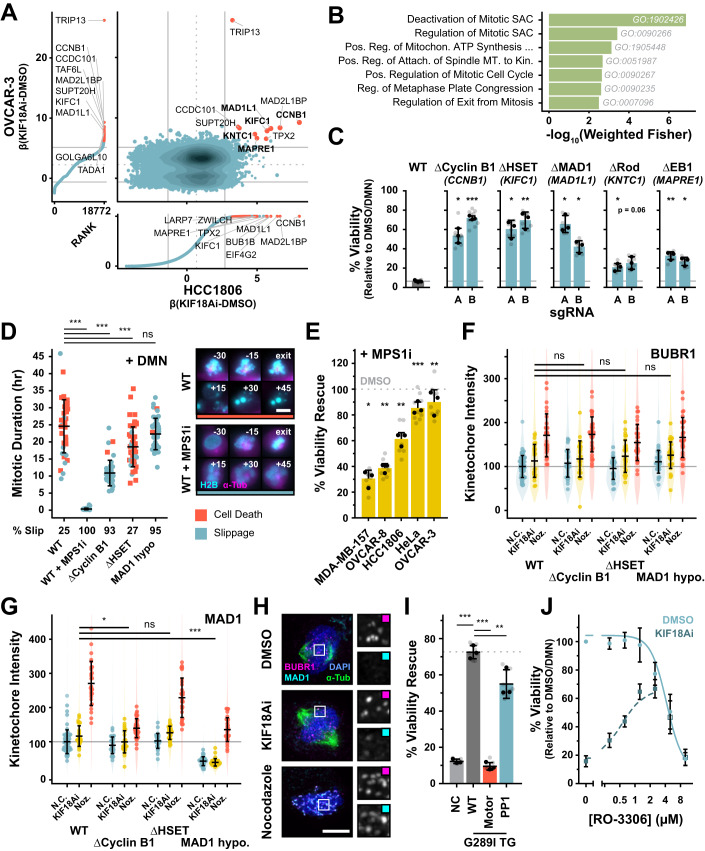
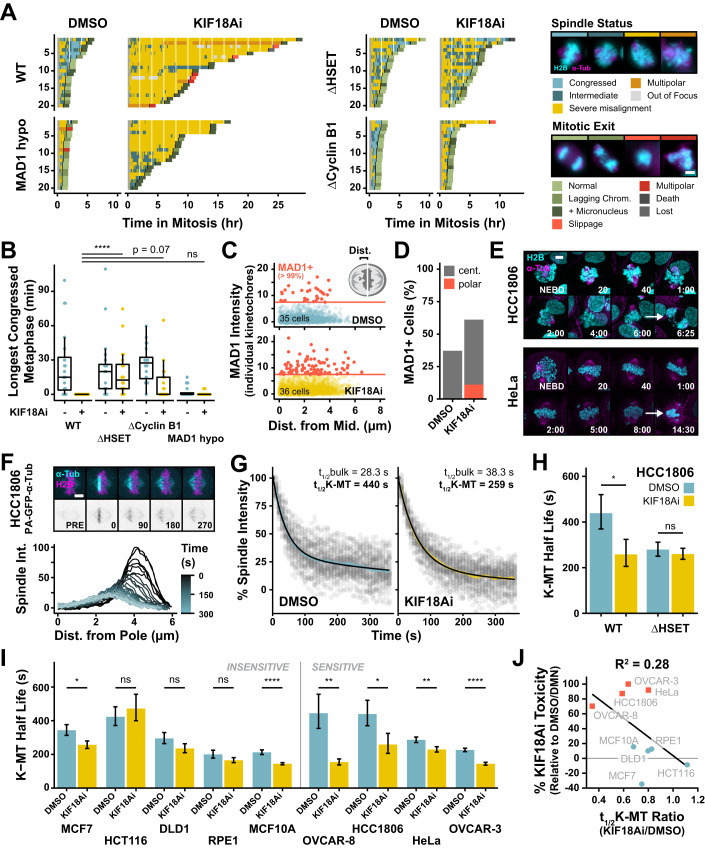
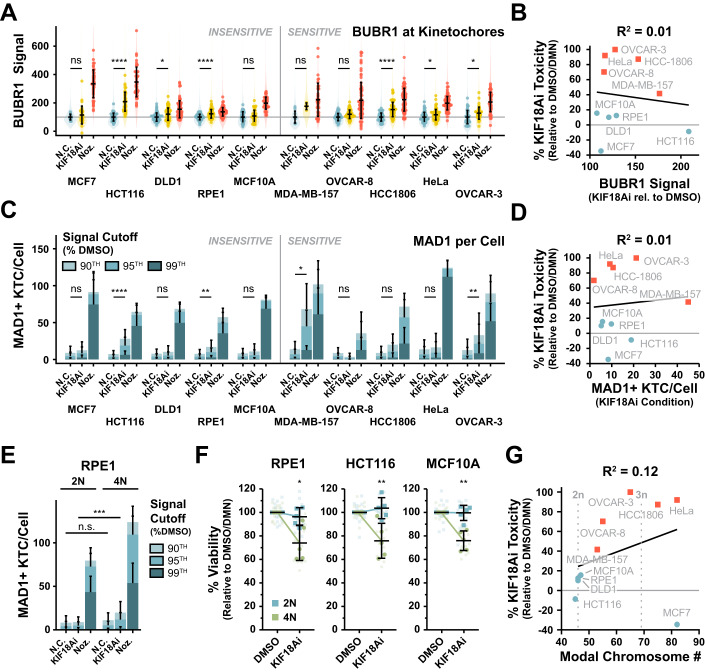
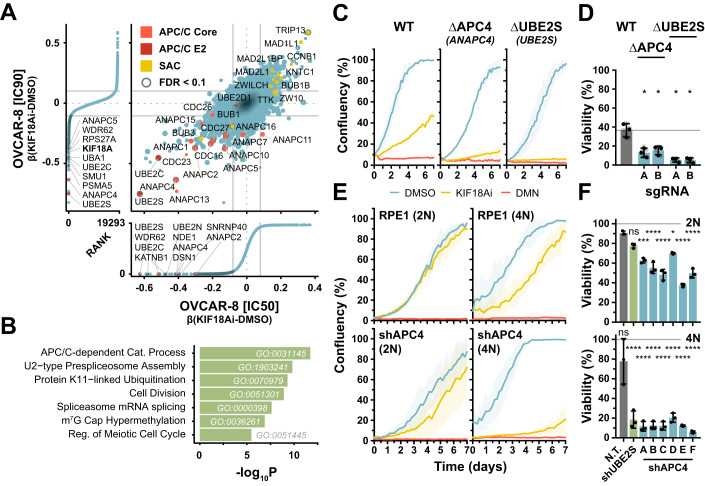
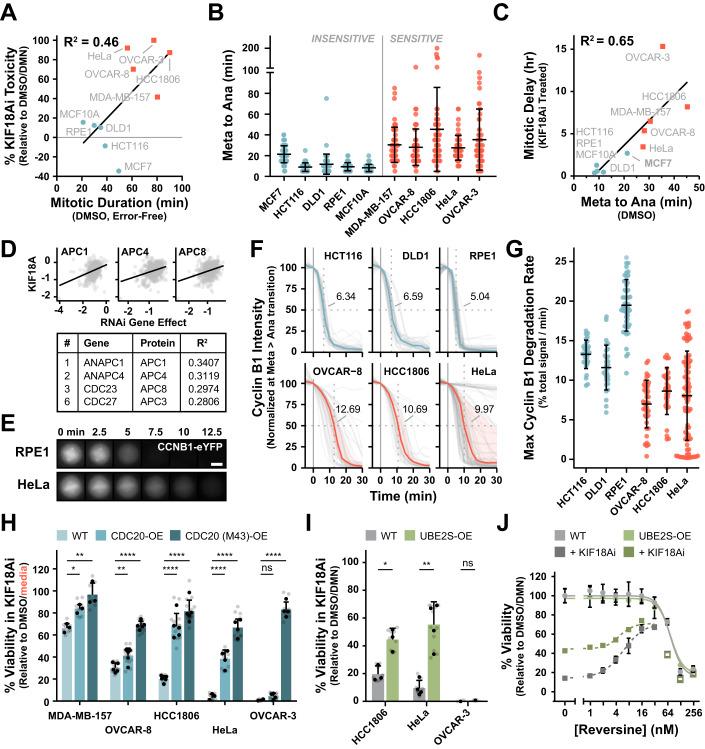
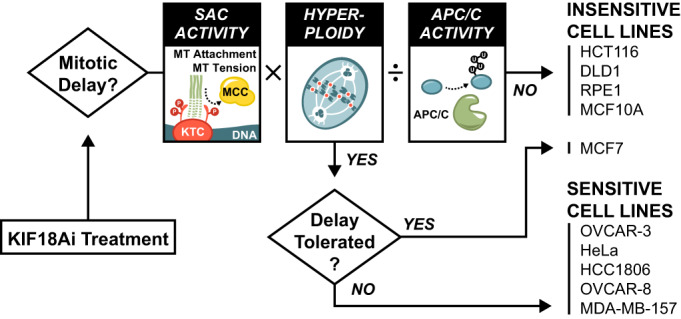
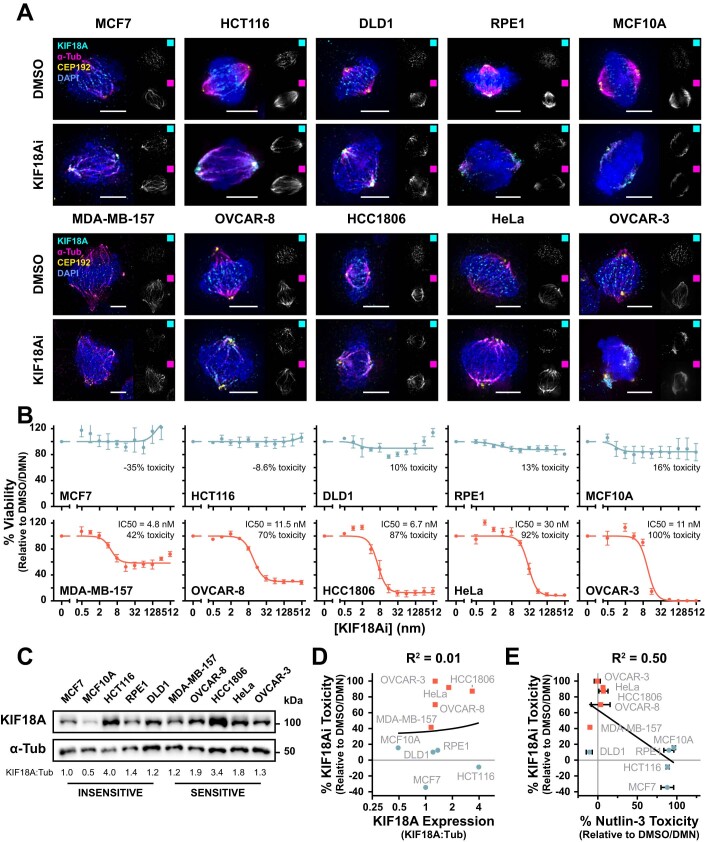
The efficacy of current antimitotic cancer drugs is limited by toxicity in highly proliferative healthy tissues. A cancer-specific dependency on the microtubule motor protein KIF18A therefore makes it an attractive therapeutic target. Not all cancers require KIF18A, however, and the determinants underlying this distinction remain unclear. Here, we show that KIF18A inhibition drives a modest and widespread increase in spindle assembly checkpoint (SAC) signaling from kinetochores which can result in lethal mitotic delays. Whether cells arrest in mitosis depends on the robustness of the metaphase-to-anaphase transition, and cells predisposed with weak basal anaphase-promoting complex/cyclosome (APC/C) activity and/or persistent SAC signaling through metaphase are uniquely sensitive to KIF18A inhibition. KIF18A-dependent cancer cells exhibit hallmarks of this SAC:APC/C imbalance, including a long metaphase-to-anaphase transition, and slow mitosis overall. Together, our data reveal vulnerabilities in the cell division apparatus of cancer cells that can be exploited for therapeutic benefit.

Keywords: Anaphase Promoting Complex (APC/C); Cancer; KIF18A; Mitosis; Spindle Assembly Checkpoint (SAC).


Conflict of interest statement

The authors declare no competing interests.

Figures

Figure 1
Figure 1. Sensitivity to KIF18A inhibition is defined by long mitotic delays that drive catastrophic errors.
(A) Wide-field immunofluorescence of KIF18A localization relative to kinetochores (CENP-A, cyan) and the mitotic spindle (α-Tubulin, green) in DMSO or KIF18Ai-treated OVCAR-3 cells. Scale bar = 5 µm. (B) Titration of KIF18Ai in 5-day MTT endpoint viability assay for RPE1 and OVCAR-3 cells. N = 4 independent experiments, n ≥ 2 technical replicates per experiment. Data are represented as mean ± SEM. (C) Summary table of KIF18Ai toxicity, IC50 values and p53 pathway functionality from MTT assays in Fig. EV1B,E. Toxicity values are derived from plateau measurements of the IC50 dose–response curves. (D) Titration of KIF18Ai in 5-day MTT endpoint viability assay for HCC1806 cells constitutively expressing a WT or drug-resistant (G289I) KIF18A-(3x)HA transgene. Data are represented as mean ± SD. N = 3 technical replicates from a single experiment. (E) Quantification of live-cell wide-field time-lapse microscopy of H2B/α-Tubulin fluorescently tagged cell lines colored by mitotic outcome. Data are represented as mean ± SD. n > 35 cells per condition. Statistical significance was determined using an unpaired two-tailed Student’s t test. Sample size and full statistical results are listed in Dataset EV2. (F) Quantification of micronucleus formation after 7 days of DMSO or KIF18Ai treatment in indicated cell lines. Phospho-histone H2A.X+ micronuclei denote DNA damage and likely micronucleus rupture. Data are represented as mean ± SD. N = 5 independent experiments, n ≥ 100 cells per condition per experiment. Statistical significance was determined using an unpaired two-tailed Student’s t test. Sample size and full statistical results are listed in Dataset EV2. (G) scDNAseq of indicated cell lines following 7 days of DMSO or KIF18Ai treatment. The asterisk indicates common karyotypic alterations in each cell line. (H) Heterogeneity score calculation for each sample in (F). Data Information: *P < 0.05, **P < 0.01, ***P < 0.001, and ****P < 0.0001 (E, F). Source data are available online for this figure.
Figure 2
Figure 2. SAC activation drives KIF18Ai toxicity.
(A) Comparison of OVCAR-3 and HCC1806 whole-genome CRISPR–Cas9 screens. Data is annotated with mean ± 1.5 × SD. Hits with an average FDR < 0.3 are highlighted in red. (B) Gene set enrichment analysis of genes from (A) with a β(KIF18Ai-DMSO) > 1.5 SD and an average FDR < 0.3. The significance of each GO term was evaluated with a Fisher’s exact test using the topGO R package. (C) 5-day MTT endpoint viability assay of HCC1806 polyclonal CRISPR–Cas9 KO cell lines in KIF18Ai. Data are represented as mean ± SD. N = 3 independent experiments, n = 3 technical replicates per experiment. Statistical significance was determined using a one-way ANOVA with post hoc Dunnett’s multiple comparisons test between each gene knockout pair and WT. Full statistical results are listed in Dataset EV2. (D) Quantification of mitotic duration and fate of mitotic HCC1806 monoclonal cell lines arrested with DMN. Data are represented as mean ± SD. n ≥ 40 cells per condition. Statistical significance was determined using a one-way-ANOVA with post hoc Dunnett’s multiple comparisons test between each sample and WT. Full statistical results are listed in Dataset EV2. Scale bar = 10 µm. (E) KIF18Ai viability rescue across sensitive cell line panel with sub-saturating Reversine treatment (30 nM) in a 5-day MTT endpoint assay. Data are represented as mean ± SD. N = 3 independent experiments, n = 3 technical replicates per experiment. Statistical significance was determined using a one-sample Student’s t test, H0: % rescue = 0. Full statistical results are listed in Dataset EV2. (F) Quantification of BUBR1 intensity at kinetochores across HCC1806 clonal rescue cell lines in DMSO, KIF18Ai, and Nocodazole. Violin plots summarize all individual kinetochores analyzed, points represent per-cell intensity averages, and error bars are mean ± SD of per-cell averages. N > 25 cells per condition, n > 2200 kinetochores per condition. Statistical significance was determined using a one-way-ANOVA with post hoc Dunnett’s multiple comparisons test between KIF18Ai intensity in edited cell lines and KIF18Ai intensity in WT. The sample size and full statistical results are listed in Dataset EV2. (G) Quantification of MAD1 intensity at kinetochores as in (F). N > 25 cells per condition, n > 2200 kinetochores per condition. Statistical significance was determined using a one-way ANOVA with post hoc Dunnett’s multiple comparisons test between KIF18Ai intensity in edited cell lines and KIF18Ai intensity in WT. The sample size and full statistical results are listed in Dataset EV2. (H) Wide-field immunofluorescence images of SAC proteins BUBR1 and MAD1 at kinetochores in DMSO, KIF18Ai, and Nocodazole treatments in mitotic HCC1806 cells. Scale bar = 5 µm. (I) 5-day MTT endpoint viability assay of HCC1806 G289I KIF18A mutant overexpression cell lines in KIF18Ai. Data are represented as mean ± SD. N = 3 independent experiments, n = 3 technical replicates per experiment. Statistical significance was determined using a one-way-ANOVA with post hoc Dunnett’s multiple comparisons test between each sample and G289I KIF18A (WT) overexpression. Full statistical results are listed in Dataset EV2. (J) Titration of CDK1 inhibitor RO-3306 in a 5-day MTT endpoint viability assay against DMSO or KIF18Ai-treated HCC1806 cells. N = 3 independent experiments, n = 3 technical replicates per experiment. Error bars represent mean ± SD. Data information: *P  <  0.05, **P  <  0.01, and ***P  <  0.001 (CE, G, I). Source data are available online for this figure.
Figure 3
Figure 3. KIF18Ai toxicity is relieved by stabilizing kinetochore–microtubule attachments and rescuing metaphase plate congression.
(A) Quantification of metaphase plate congression and mitotic outcome from live-cell time-lapse wide-field fluorescent microscopy of dividing HCC1806 monoclonal rescue cells in DMSO or KIF18Ai. n = 20 cells/condition. Scale bar = 10 µm. (B) Longest continuously congressed metaphase from movies in (A). Data are shown as box‐and‐whisker plots with minimum, first quartile (Q1), median, third quartile (Q3), and maximum. Outliers ( > Q3 + 1.5 × IQR) are excluded. N = 20 cells per condition. Statistical significance was determined using a one-way-ANOVA with post hoc Dunnett’s multiple comparisons test between WT and edited cell lines in KIF18Ai. Sample size and full statistical results are listed in Dataset EV2. (C) Quantification of MAD1 intensity at kinetochores relative to kinetochore position along the mitotic spindle axis in DMSO (N = 35 cells, n = 3104 kinetochores) or KIF18Ai (N = 36 cells, n = 3369 kinetochores) treated HCC1806 cells from wide-field immunofluorescence images dataset from Fig. 4C. MAD1+ is defined as >99th percentile signal intensity of DMSO condition. (D) Percent of cells containing at least one MAD1+ kinetochore in either the central (≤5 µm from midline) or polar (> 5 µm from midline) regions in DMSO or KIF18Ai conditions from (C). (E) Representative still images from live-cell confocal time-lapse movies of dividing H2B/α-Tubulin fluorescently tagged HCC1806 and HeLa cells in KIF18Ai. Scale bar = 5 µm. (F) Top: Representative stills from live-cell confocal time-lapse movies of HCC1806 PA-GFP-α-Tubulin cells. Scale bar = 5 µm. Bottom: Intensity distribution over time of photoactivated PA-GFP-α-Tubulin band. (G) Two-phase exponential decay fit of integrated intensity measurements for HCC1806 PA-GFP-α-Tubulin cells in DMSO or KIF18Ai. Shaded colored region represents mean ± SEM. Gray dots represent individual measurements. N > 50 cells/condition. (H) Second-order (K-MT) half-life measurements from WT or ∆HSET HCC1806 PA-GFP-α-Tubulin cells in DMSO or KIF18Ai. Data are represented as mean ± SEM. N > 50 cells/condition. Statistical significance was determined using an unpaired two-tailed Student’s t test between DMSO and KIF18Ai treatment for each cell line. Sample size and full statistical results are listed in Dataset EV2. (I) Second-order (K-MT) half-life measurements across the panel of cell lines as in (H). Data are represented as mean ± SEM. N ≥ 30 cells/condition. Statistical significance was determined using an unpaired two-tailed Student’s t test between DMSO and KIF18Ai treatment for each cell line. Sample size and full statistical results are listed in Dataset EV2. (J) Linear correlation between 5-day KIF18Ai toxicity and K-MT stability disruption by KIF18Ai across cell line panel. Red squares = sensitive, blue dots = insensitive cell lines. t1/2K-MT Ratio = t1/2K-MT[KIF18Ai]/t1/2K-MT[DMSO]. Data information: *P  <  0.05, **P  <  0.01, and ****P  <  0.0001 (B, H, I). Source data are available online for this figure.
Figure 4
Figure 4. KIF18Ai-driven SAC signaling occurs in both sensitive and insensitive cell lines and is amplified by whole-genome doubling.
(A) Intensity of BUBR1 at kinetochores in DMSO, KIF18Ai, and Nocodazole treatments across the full panel of cell lines from wide-field immunofluorescence images. Violin plots summarize all individual kinetochores analyzed, points represent per-cell intensity averages, and error bars are mean ± SD of per-cell averages. N ≥ 4 cells per condition, n ≥ 730 kinetochores. Statistical significance was determined using a one-way ANOVA with post hoc Dunnett’s multiple comparisons test between drug and DMSO conditions for each cell line. Sample size and full statistical results are listed in Dataset EV2. (B) Linear correlation between 5-day KIF18Ai toxicity and BuBR1 defect across cell line panel. Red squares = sensitive, blue dots = insensitive cell lines. BUBR1 defect = (Signal[KIF18Ai] − Signal[DMSO])/(Signal[Nocodazole] − Signal[DMSO]) × 100. (C) The average number of MAD1+ kinetochores per cell in DMSO, KIF18Ai, and Nocodazole treatments across the full panel of cell lines from wide-field immunofluorescence images. Data are represented as mean ± SD. N ≥ 4 cells per condition, n ≥ 730 kinetochores. MAD1+ kinetochores have MAD1 signal >nth percentile of signal in DMSO condition as indicated. Statistical significance was determined from >95% MAD1+ kinetochores using a one-way ANOVA with post hoc Dunnett’s multiple comparisons test between drug and DMSO conditions for each cell line. Sample size and full statistical results are listed in Dataset EV2. (D) Linear correlation between 5-day KIF18Ai toxicity and number of >95% MAD1+ kinetochores in KIF18Ai across cell line panel. (E) The average number of MAD1+ kinetochores per cell in DMSO, KIF18Ai, and Nocodazole treatments between diploid and WGD RPE1 cell lines from wide-field immunofluorescence images. Data are represented as mean ± SD. N ≥ 25 cells per condition, n > 2100 kinetochores. MAD1+ kinetochores have MAD1 signal >nth percentile of signal in DMSO condition as indicated. Statistical significance was determined from >95% MAD1+ kinetochores using an unpaired two-tailed Student’s t test for each condition between 2N and 4N cells. Sample size and full statistical results are listed in Dataset EV2. (F) Five-day MTT endpoint viability assay of diploid and WGD cell lines in KIF18Ai. Data are represented as mean ± SD. N = 5 independent experiments, n = 3 technical replicates per experiment. Statistical significance was determined using an unpaired two-tailed Student’s t test. Full statistical results are listed in Dataset EV2. (G) Linear correlation between 5-day KIF18Ai toxicity and modal chromosome number for each cell line taken from the ATCC. Data information: *P  <  0.05, **P  <  0.01, ***P  <  0.001 and ****P  <  0.0001 (A, C, E, F). Source data are available online for this figure.
Figure 5
Figure 5. Whole-genome doubling synergizes with APC/C defects to induce KIF18A dependency.
(A) Comparison of OVCAR-8 whole-genome CRISPR–Cas9 screens at IC90 and IC50 [KIF18Ai]. Data are annotated with mean ± 1.5 × SD. Hits with average FDR < 0.1 are circled in gray in the central plot and highlighted in dark blue in the exterior rank plots. (B) Gene set enrichment analysis of genes from (A) with β(KIF18Ai-DMSO) < 1.5 × SD and average FDR < 0.1. The significance of each GO term was evaluated with a Fisher’s exact test using the topGO R package. (C) Longitudinal confluency measurements of OVCAR-8 WT, ∆APC4 (polyclonal, sgRNA A), and ∆UBE2S (polyclonal, sgRNA A) in DMSO, KIF18Ai, and Nocodazole conditions. N = 3 technical replicates from a single experiment. Data are represented as mean ± SD. (D) Five-day MTT endpoint viability assay of OVCAR-8 polyclonal CRISPR–Cas9 KO cell lines in KIF18Ai. Data are represented as mean ± SD. N = 3 independent experiments, n = 3 technical replicates per experiment. Statistical significance was determined using a one-way ANOVA with post hoc Dunnett’s multiple comparisons test between each gene knockout pair and WT. Full statistical results are listed in Dataset EV2. (E) Longitudinal confluency measurements of shAPC4 and shUBE2S diploid and WGD RPE1 cells in DMSO, KIF18Ai, and Nocodazole conditions. N = 3 technical replicates from a single experiment. Data are represented as mean ± SD. (F) 5-day MTT endpoint viability assay of shAPC4 and shUBE2S diploid and WGD RPE1 cell lines in KIF18Ai. Data are represented as mean ± SD. N = 3 technical replicates from a single experiment. Statistical significance was determined using a one-way ANOVA with post hoc Dunnett’s multiple comparisons test between each 2N and 4N knockdown and 2 N non-targeting sgRNA cell lines. Full statistical results are listed in Dataset EV2. Data information: *P  <  0.05, ***P  <  0.001, and ****P  <  0.0001 (D, F). Source data are available online for this figure.
Figure 6
Figure 6. Low basal APC/C activity is a hallmark of KIF18A-dependent cell lines.
(A) Linear correlation between 5-day KIF18Ai toxicity and mitotic duration in cells without errors from live-cell wide-field time-lapse microscopy of H2B/α-Tubulin fluorescently tagged cell lines from Fig. 1D. (B) Metaphase-to- anaphase duration from live-cell wide-field time-lapse microscopy of H2B/α-Tubulin fluorescently tagged cell lines from Fig. 1D. Error bars represent mean ± SD. N ≥ 50 cells per condition. Full sample size information is listed in Dataset EV2. (C) Linear correlation between metaphase-to-anaphase duration in (B) and mitotic duration in KIF18Ai from live-cell wide-field time-lapse microscopy of H2B/α-Tubulin fluorescently tagged cell lines from Fig. 1D. (D) Top KIF18A co-dependency relationships from the DepMap RNAi dataset. N > 600 cell lines. (E) Live-cell wide-field time-lapse microscopy of endogenously tagged Cyclin B1-eYFP at the metaphase-to- anaphase transition for RPE1 and HeLa cells. Scale bar = 10 µm. (F) Quantification of Cyclin B1 degradation rates as in (E) for untreated endogenously tagged fluorescent cells. The median (colored line) of individual traces (gray lines) is plotted, with the shaded region encompassing the first and third quartile of each population. Cyclin B1 signal is normalized to the metaphase inflection point, and median t1/2 values are listed. Full sample size information is listed in Dataset EV2. (G) Maximum slope of Cyclin B1 degradation at metaphase for untreated endogenously tagged fluorescent cells in (F). Rates are calculated relative to the total Cyclin B1 signal at mitotic entry. Data are represented as mean ± SD. N ≥ 30 cells per condition. (H) Media normalized 5-day MTT endpoint viability assay of sensitive cell lines overexpressing either WT or M43 CDC20 in KIF18Ai. Data are represented as mean ± SD. N ≥ 3 independent experiments per cell line, n = 3 technical replicates per experiment. Media normalization was used rather than DMN normalization since CDC20 overexpression generated growth rescue in DMN. Statistical significance was determined using a one-way ANOVA with post hoc Dunnett’s multiple comparisons test between each overexpression pair and WT. Full statistical results are listed in Dataset EV2. (I) Five-day MTT endpoint viability assay of UBE2S-overexpressing cell lines in KIF18Ai. Data are represented as mean ± SD. N ≥ 1 independent experiment, n = 3 technical replicates per experiment. Statistical significance was determined using an unpaired two-tailed Student’s t test between WT and UBE2S-overexpressing cells. Full statistical results are listed in Dataset EV2. (J) Titration of the MPS1 inhibitor Reversine in a 5-day MTT endpoint viability assay in DMSO or KIF18Ai-treated HCC1806 WT or UBE2S-overexpressing cells. Open squares are omitted from the curve fit. N = 3 technical replicates from a single experiment. Data are represented as mean ± SD. Data information: *P  <  0.05, **P  <  0.01, and ****P  <  0.0001 (H, I). Source data are available online for this figure.
Figure 7
Figure 7. A model for KIF18A dependency.
Toxicity in KIF18Ai is the result of mitotic delays and errors. Whether a cell arrests in mitosis depends on three factors (i) the amount of elevated SAC activity at each kinetochore multiplied by (ii) the number of kinetochores and mitigated by (iii) the basal activity of the APC/C. Cells with mitotic delays resulting from these factors are generally sensitive to KIF18Ai. However, toxicity can be rescued by hyperstability of the mitotic spindle apparatus as it is with MCF7 cells.
Figure EV1
Figure EV1. Extended analysis of cellular response to KIF18Ai.
(A) Wide-field immunofluorescence of KIF18A localization relative to spindle poles (CEP192, yellow) and the mitotic spindle (α-Tubulin, magenta) in response to KIF18Ai treatment across full cell line panel. Scale bar = 5 µm. (B) Titration of KIF18Ai in a 5-day MTT endpoint viability assay for the panel of sensitive and insensitive cell lines. N ≥ 3 independent experiments, n ≥ 2 technical replicates per experiment. Data are represented as mean ± SEM. (C) Western blot of KIF18A expression levels across the full panel of sensitive and insensitive cell lines. (D) Linear correlation between 5-day KIF18Ai toxicity and normalized KIF18A expression (KIF18A/α-Tubulin) from (C). Expression is plotted on a log2 axis. (E) Linear correlation between 5-day KIF18Ai toxicity and Nutlin-3 toxicity from a 5-day MTT endpoint viability assay for the panel of sensitive and insensitive cell lines. N = 3 independent experiments, n = 3 technical replicates per experiment. Data are represented as mean ± SD.
Figure EV2
Figure EV2. Validation of drug-resistant KIF18A transgenic HCC1806 cells.
(A) Schematic of KIF18Ai drug binding site from EM structure (PDB: 5OAM). Blue: KIF18Ai motor domain with G289 highlighted in red. Gray: α-tubulin/β-tubulin. Highlighted circle represents drug binding pocket. Protein sequence alignment of drug binding pocket between KIF18A, KIF19, and KIF18B. (B) Schematic of KIF18A protein domains and mutations. (C) Western blot validation of HCC1806 cells constitutively expressing a WT, drug-resistant (G289I), drug-resistant and motor dead (G289I, R308A, K311A), or drug-resistant and PP1-binding deficient (G289I, V614A, W617A) KIF18A-(3x)HA transgene.
Figure EV3
Figure EV3. Live-cell analysis of mitotic outcomes from KIF18Ai Treatment.
(A) Proportion of mitotic fates across the panel of H2B/α-Tubulin fluorescently tagged cell lines in response to DMSO or KIF18Ai treatment from live-cell wide-field time-lapse microscopy in Fig. 1E. (B) Representation of mitotic error threshold across a panel of H2B/α-Tubulin fluorescently tagged cell lines in response to DMSO or KIF18Ai treatment from live-cell wide-field time-lapse microscopy in Fig. 1E. Bars represent individual mitotic events. Dotted line represents error threshold.
Figure EV4
Figure EV4. Extended chromosome alignment and SAC activation data in KIF18Ai.
(A) Representative live-cell time-lapse microscopy stills from HCC1806 cells used to evaluate mitotic chromosome congression. Scale bar = 5 µm. (B) Top: Kinetochore distribution probability along the spindle axis from Fig. 3C. Bottom: Probability of a kinetochore being MAD1+ relative to its position on the spindle axis in DMSO or KIF18Ai conditions. Polar kinetochores are defined as >5 µm from the spindle midline. (C) Top: Quantification of BUBR1 foci from live-cell confocal time-lapse microscopy of HeLa EGFP-BUBR1 BAC H2B-iRFP cell lines in DMSO, KIF18Ai, and Nocodazole conditions. Error bars represent mean ± SD. Statistical significance was determined using an unpaired two-tailed Student’s t test between DMSO and KIF18Ai conditions at 0, 10, 20, 30, and 40 min. Sample size and full statistical results are listed in Dataset EV2. Bottom: Representative still images from mitotic movies. *P  <  0.05, **P  <  0.01, ***P  <  0.001, and ****P  <  0.0001.
Figure EV5
Figure EV5. Extended analysis of APC/C activity relative to KIF18A dependency.
(A) Top 10 RNAi co-dependency relationships from DepMap dataset for KIF18A. Red and blue points represent sensitive and insensitive cell lines respectively from the panel in Fig. 1C. Bolded table entries are APC/C or SAC genes. (B) Quantification of Cyclin B1 degradation rates for endogenously tagged fluorescent cells treated with Reversine, KIF18Ai, or Nocodazole. The median (colored line) of individual traces (gray lines) is plotted, with the shaded region encompassing the first and third quartile of each population. Cyclin B1 signal is normalized to the metaphase inflection point and median t1/2 values are listed. Full sample size information is listed in Dataset EV3. (C) Maximum slope of Cyclin B1 degradation at metaphase for endogenously tagged fluorescent cells treated with Reversine, KIF18Ai, or Nocodazole in (B). Rates are calculated relative to the total Cyclin B1 signal at mitotic entry. Data are represented as mean ± SD. N ≥ 20 cells per condition (KIF18Ai, Reversine), N ≥ 5 cells per condition (nocodazole).

References

    1. Alexa A, Rahnenfuhrer J (2023) topGO: enrichment analysis for gene ontology. R package version 2.52.0
    1. Allan LA, Camacho Reis M, Ciossani G, Huis In ‘t Veld PJ, Wohlgemuth S, Kops GJ, Musacchio A, Saurin AT. Cyclin B1 scaffolds MAD1 at the kinetochore corona to activate the mitotic checkpoint. EMBO J. 2020;39:e103180. doi: 10.15252/embj.2019103180. - DOI - PMC - PubMed
    1. Bakker B, Taudt A, Belderbos ME, Porubsky D, Spierings DCJ, de Jong TV, Halsema N, Kazemier HG, Hoekstra-Wakker K, Bradley A, et al. Single-cell sequencing reveals karyotype heterogeneity in murine and human malignancies. Genome Biol. 2016;17:115. doi: 10.1186/s13059-016-0971-7. - DOI - PMC - PubMed
    1. Barisic M, Rajendraprasad G, Steblyanko Y. The metaphase spindle at steady state—mechanism and functions of microtubule poleward flux. Semin Cell Dev Biol. 2021;117:99–117. doi: 10.1016/j.semcdb.2021.05.016. - DOI - PubMed
    1. Bonaiuti P, Chiroli E, Gross F, Corno A, Vernieri C, Štefl M, Cosentino Lagomarsino M, Knop M, Ciliberto A. Cells escape an operational mitotic checkpoint through a stochastic process. Curr Biol. 2018;28:28–37.e27. doi: 10.1016/j.cub.2017.11.031. - DOI - PubMed