. 2024 Jan 27;19(1):4.
doi: 10.1186/s13015-024-00250-w.

Co-linear chaining on pangenome graphs

Affiliations

Co-linear chaining on pangenome graphs

Jyotshna Rajput et al. Algorithms Mol Biol. .

Abstract

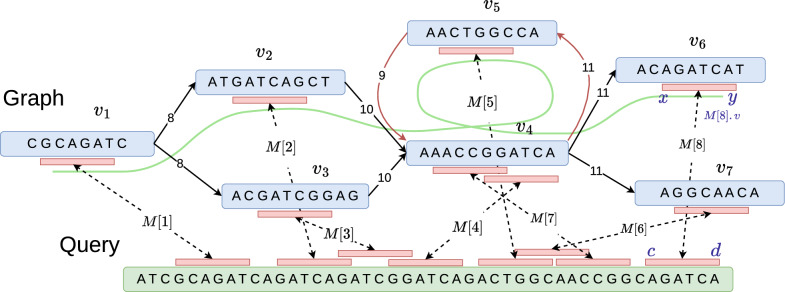
Pangenome reference graphs are useful in genomics because they compactly represent the genetic diversity within a species, a capability that linear references lack. However, efficiently aligning sequences to these graphs with complex topology and cycles can be challenging. The seed-chain-extend based alignment algorithms use co-linear chaining as a standard technique to identify a good cluster of exact seed matches that can be combined to form an alignment. Recent works show how the co-linear chaining problem can be efficiently solved for acyclic pangenome graphs by exploiting their small width and how incorporating gap cost in the scoring function improves alignment accuracy. However, it remains open on how to effectively generalize these techniques for general pangenome graphs which contain cycles. Here we present the first practical formulation and an exact algorithm for co-linear chaining on cyclic pangenome graphs. We rigorously prove the correctness and computational complexity of the proposed algorithm. We evaluate the empirical performance of our algorithm by aligning simulated long reads from the human genome to a cyclic pangenome graph constructed from 95 publicly available haplotype-resolved human genome assemblies. While the existing heuristic-based algorithms are faster, the proposed algorithm provides a significant advantage in terms of accuracy. Implementation ( https://github.com/at-cg/PanAligner ).

Keywords: Genome sequencing; Path cover; Sequence alignment; Variation graph.


Conflict of interest statement

The authors declare no competing interests.

Figures

Fig. 1
Fig. 1
An illustration of co-linear chaining for sequence-to-graph alignment. Assume that the vertices of the graph are labeled with nucleotide sequences. In panel a, short exact matches, i.e., anchors, are illustrated using red blocks joined by dotted lines. In panel b, the anchors corresponding to the best-scoring chain are retained, and the rest are removed. The retained anchors are combined to produce an alignment of the query sequence to the graph (illustrated using a green curved line)
Fig. 2
Fig. 2
An example illustrating a graph, a query sequence, and multiple anchors as input for co-linear chaining. The sequence of anchors (M[1], M[2], M[4], M[5], M[7], M[8]) forms a valid chain that visits vertex v4 twice due to a cycle in the graph. The coordinates associated with anchor M[8] are also highlighted as an example
Fig. 3
Fig. 3
An illustration of the proposed heuristic used to convert a cyclic graph into a DAG. Red-dotted edges represent the removed back edges in each strongly connected component (SCC)
Algorithm 1
Algorithm 1
O(Γl|P||E|) time algorithm to compute last2reach(vi) for all vV and i[1,|P|]
Algorithm 2
Algorithm 2
O(Γd|P||E|) time algorithm to compute D(last2reach(vi), v) for all vV and i[1,|P|]
Algorithm 3
Algorithm 3
O(ΓcN|P|logN+N|P|logN|P|) time chaining algorithm
Fig. 4
Fig. 4
A worst-case example for Algorithm 3 where it requires Ω(N) iterations to converge (Lemma 6). We show a step-by-step progress of the algorithm with each iteration. The table shows the values in array C after each iteration
Fig. 5
Fig. 5
A comparison of the size of the computed path cover and the lower bound on the size of the minimum path cover for each component of graphs (a) 10H and (b) 95H. Graph 10H has 30 weakly connected components. Graph 95H has 26 weakly connected components (Table 1)
Fig. 6
Fig. 6
The plots in panels (a), (b) and (c) show the fraction of aligned reads and the accuracy obtained by using all the aligners on graphs 10H, 40H, and 95H, respectively. These plots were generated by varying mapping quality cutoffs from 0 to 60. X-axis in these plots uses a logarithmic scale to indicate the percentage of incorrectly aligned reads

References

    1. Eggertsson HP, Jonsson H, Kristmundsdottir S, et al. Graphtyper enables population-scale genotyping using pangenome graphs. Nat Genet. 2017;49(11):1654–60. 10.1038/ng.3964 - DOI - PubMed
    1. Ekim B, Berger B, Chikhi R. Minimizer-space de bruijn graphs: whole-genome assembly of long reads in minutes on a personal computer. Cell Syst. 2021;12(10):958–68. 10.1016/j.cels.2021.08.009 - DOI - PMC - PubMed
    1. Garrison E, Sirén J, Novak AM, Hickey G, Eizenga JM, Dawson ET, Jones W, Garg S, Markello C, Lin MF, et al. Variation graph toolkit improves read mapping by representing genetic variation in the reference. Nat Biotechnol. 2018;36(9):875–9. 10.1038/nbt.4227. 10.1038/nbt.4227 - DOI - PMC - PubMed
    1. Liao W-W, Asri M, Ebler J, Doerr D, Haukness M, Hickey G, Lu S, Lucas JK, Monlong J, Abel HJ, et al. A draft human pangenome reference. Nature. 2023;617(7960):312–24. 10.1038/s41586-023-05896-x - DOI - PMC - PubMed
    1. Sirén J, Monlong J, Chang X, et al. Pangenomics enables genotyping of known structural variants in 5202 diverse genomes. Science. 2021;374(6574):8871.10.1126/science.abg8871 - DOI - PMC - PubMed

LinkOut - more resources