. 2024 Jan 19;25(2):0.
doi: 10.3390/ijms25021220.

The Dual Role of Sulforaphane-Induced Cellular Stress-A Systems Biological Study

Affiliations

The Dual Role of Sulforaphane-Induced Cellular Stress-A Systems Biological Study

Marianna Holczer et al. Int J Mol Sci. .

Abstract

The endoplasmic reticulum (ER) plays a crucial role in cellular homeostasis. When ER stress is generated, an autophagic self-digestive process is activated to promote cell survival; however, cell death is induced in the case of excessive levels of ER stress. The aim of the present study was to investigate the effect of a natural compound called sulforaphane (SFN) upon ER stress. Our goal was to investigate how SFN-dependent autophagy activation affects different stages of ER stress induction. We approached our scientific analysis from a systems biological perspective using both theoretical and molecular biological techniques. We found that SFN induced the various cell-death mechanisms in a concentration- and time-dependent manner. The short SFN treatment at low concentrations promoted autophagy, whereas the longer treatment at higher concentrations activated cell death. We proved that SFN activated autophagy in a mTORC1-dependent manner and that the presence of ULK1 was required for its function. A low concentration of SFN pre- or co-treatment combined with short and long ER stress was able to promote cell survival via autophagy induction in each treatment, suggesting the potential medical importance of SFN in ER stress-related diseases.

Keywords: autophagy; cellular stress; feedback loops; sulforaphane; systems biology.


Conflict of interest statement

The authors declare that there is no conflict of interest regarding the publication of this article.

Figures

Figure 1
Figure 1
The wiring diagram of endoplasmic reticulum (ER) stress-response mechanism. The ER stress sensor, the autophagy inducer (AUTA inducer), the mTORC1, the autophagy effector (AUTA effector), and the apoptosis effector (APOA effector) are denoted by isolated orange, blue, red, green, and black boxes, respectively. Dashed lines show how the components can influence each other, while blocked end lines denote inhibition. The green arrows show how sulforaphane acts in this system, according to data from the literature and a–i indicate connections between the components.
Figure 2
Figure 2
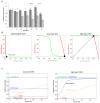
The time- and concentration-dependent effect of the sulforaphane on the viability of the cells. HEK293T cells were treated with 5, 10, 15, 20, 25, and 50 μ M SFN for 2 and 4 h meanwhile (A) the relative number of viable cells was denoted. Error bars represent standard deviation. Asterisks indicate statistically significant differences from the control: ns—non significant; *—p < 0.05. (B) Phase plane diagram of endoplasmic reticulum (ER) stress-response mechanism under physiological state (left panel), at low (middle panel) (parameter setting for the simulation: SFN = 1, stress = 10) and at high (right panel) (parameter setting for the simulation: SFN = 80, stress = 10) level of SFN. The balance curves of AUTA effector (green curve) and APOA effector (red curve) are plotted. Stable steady states are visualized with black dots. (C) The computational simulations are determined upon low (left panel) (parameter setting for the simulation: SFN = 1, stress = 10) and high (right panel) (parameter setting for the simulation: SFN = 80, stress = 10) SFN treatments. The relative activity of mTORC1, AUTA inducer, ER stress sensor, APOA effector, and AUTA effector is shown.
Figure 3
Figure 3
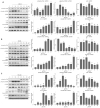
The time- and concentration-dependent effect of the sulforaphane on the members of the control network. HEK293T cells were treated with 5, 10, 15, 20, 25, and 50 μ M SFN for (A) 2, (B) 4, and (C) 24 h. The markers of ER stress (phospho-eIF2 α ), the markers of mTORC1 (phospho-p70S6K), the markers of autophagy (p62, LC3 II) and apoptosis (cleaved PARP, proCasp3) were followed by immunoblotting. GAPDH was used as a loading control (left panels). Densitometry data represent the intensity of (phospho-p70S6K) normalized for the total level of p70S6K, (phospho-eIF2 α ), p62, LC3 II, cleaved PARP and proCasp3 normalized for GAPDH (right panel). Error bars represent standard deviation. Asterisks indicate statistically significant differences from the control: ns—non significant; *—p < 0.05; **—p < 0.01.
Figure 4
Figure 4
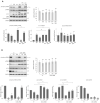
Sulforaphane induces autophagy through mTORC1 pathway with the help of ULK1. HEK293T cells were treated with 15 μ M SFN for 2 h, 100 nM rapamycin (rap) for 2 h, and 2.5 nm H89 for 2 h. ULK1 was silenced with siRNA in the cells and scrambled siRNA (scr) was used as a negative control. (A) The combined treatment with rap and H89. The markers of mTORC1 (phospho-p70S6K), autophagy (LC3 II), and apoptosis (cleaved PARP) were followed by immunoblotting. GAPDH was used as a loading control (left panel). The relative number of viable cells was denoted (right panel). Densitometry data represent the intensity of phospho-p70S6K normalized for the total level of p70S6K, LC3 II, and cleaved PARP normalized for GAPDH (lower panel). (B) The combined treatment with ULK1 silencing. The markers of mTORC1 (phospho-p70S6K), autophagy (p62, LC3 II) and ULK1 were followed by immunoblotting. GAPDH was used as a loading control (left panel). The relative number of viable cells was denoted (right panel). Densitometry data represent the intensity of phospho-p70S6K normalized for the total level of p70S6K, p62, LC3 II, and ULK1 normalized for GAPDH (lower panel). Error bars represent standard deviation. Asterisks indicate statistically significant differences from the control: ns—non significant; *—p < 0.05; **—p < 0.01.
Figure 5
Figure 5
The effect of prolonged ER stress combined with sulforaphane treatment. HEK293T cells were treated with 15 μ M SFN for 2 h, 100 nM TG for 24 h in the following combinations: pre-treatment without washout of SFN (pre(+)) and with washout of SFN (pre(−)) and co-treatment (co). By the pre-treatment, the SFN was added 2 h before the TG treatment, and by the co-treatment, SFN and TG were added at the same time point. (A) The markers of ER stress (phospho-eIF2 α ), autophagy (p62, LC3 II), and apoptosis (cleaved PARP, proCasp3) were followed by immunoblotting. GAPDH was used as a loading control. (B) The caspase 3/7 activity (left panel) and the number of viable cells (right panel) were denoted. (C) Densitometry data represent the intensity of phospho-eIF2 α , p62, LC3 II, cleaved PARP, and proCasp3 normalized for GAPDH. Error bars represent standard deviation. Asterisks indicate statistically significant differences from the control: ns—non significant; *—p < 0.05; **—p < 0.01.
Figure 6
Figure 6
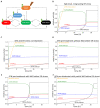
The computer simulations of the prolonged combined treatment in time. (A) The wiring diagram of endoplasmic reticulum (ER) stress-response mechanism. (B) The high-level, long-lasting ER stress (parameter setting for the simulation: stress = 100). (C) SFN (parameter setting for the simulation: SFN = 1, stress = 10) and high-level, long-lasting ER stress (parameter setting for the simulation: stress = 100) co-treatment. (D) SFN pre-treatment (parameter setting for the simulation: SFN = 1, stress = 10) without washout (WO) before high-level, long-lasting ER stress (parameter setting for the simulation: stress = 100). (E) SFN pre-treatment (parameter setting for the simulation: SFN = 1, stress = 10) with washout (WO) before high-level, long-lasting ER stress (parameter setting for the simulation: stress = 100). (F) SFN pre-treatment (parameter setting for the simulation: SFN = 1, stress = 10) with partial washout (WO) parameter setting for the simulation after the wash SFN = 0.5, stress = 5 by the SFN treatment) before high-level, long-lasting ER stress (parameter setting for the simulation: stress = 100). The relative activity of the ER stress sensor, AUTA inducer, mTORC1, APOA effector, and AUTA effector are plotted in time.
Figure 7
Figure 7
The effect of acute ER stress combined with sulforaphane treatment. HEK293T cells were treated with 25 μ M SFN for 2 h and 10 μ M TG for 2 h. In the pre-treatment, the SFN was added 2 h before the TG treatment. (A) The markers of ER stress (phospho-eIF2 α ), autophagy (LC3 II), and apoptosis (cleaved PARP) were followed by immunoblotting. GAPDH was used as a loading control (left panel). The number of viable cells was denoted (right panel). Densitometry data represent the intensity of (phospho-eIF2 α ), LC3 II, and cleaved PARP normalized for GAPDH (lower panel). Error bars represent standard deviation. Asterisks indicate statistically significant differences from the control: ns—non significant; *—p < 0.05; **—p < 0.01. (B) The computer simulations of the acute ER stress (parameter setting for the simulation: stress = 1500) (left panel) and SFN pre-treatment (parameter setting for the simulation: SFN = 1, stress = 10) before the acute ER stress parameter setting for the simulation: stress = 1500) (right panel) in time. The relative activity of the ER stress sensor, AUTA inducer, mTORC1, APOA effector, and AUTA effector are plotted in time.

References

    1. Galluzzi L., Yamazaki T., Kroemer G. Linking cellular stress responses to systemic homeostasis. Nat. Rev. Mol. Cell Biol. 2018;19:731–745. doi: 10.1038/s41580-018-0068-0. - DOI - PubMed
    1. Fulda S., Gorman A.M., Hori O., Samali A. Cellular stress responses: Cell survival and cell death. Int. J. Cell Biol. 2010;2010:214074. doi: 10.1155/2010/214074. - DOI - PMC - PubMed
    1. Poljsak B., Milisav I. Clinical implications of cellular stress responses. Bosn. J. Basic Med. Sci. 2012;12:122–126. doi: 10.17305/bjbms.2012.2510. - DOI - PMC - PubMed
    1. Doherty J., Baehrecke E.H. Life, death and autophagy. Nat. Cell Biol. 2018;20:1110–1117. doi: 10.1038/s41556-018-0201-5. - DOI - PMC - PubMed
    1. Ravanan P., Srikumar I.F., Talwar P. Autophagy: The spotlight for cellular stress responses. Life Sci. 2017;188:53–67. doi: 10.1016/j.lfs.2017.08.029. - DOI - PubMed