. 2024 Jan 27;73(2):24.
doi: 10.1007/s00262-023-03615-z.

Characterization of T cell receptor repertoire in penile cancer

Affiliations

Characterization of T cell receptor repertoire in penile cancer

Junying Zhang et al. Cancer Immunol Immunother. .

Abstract

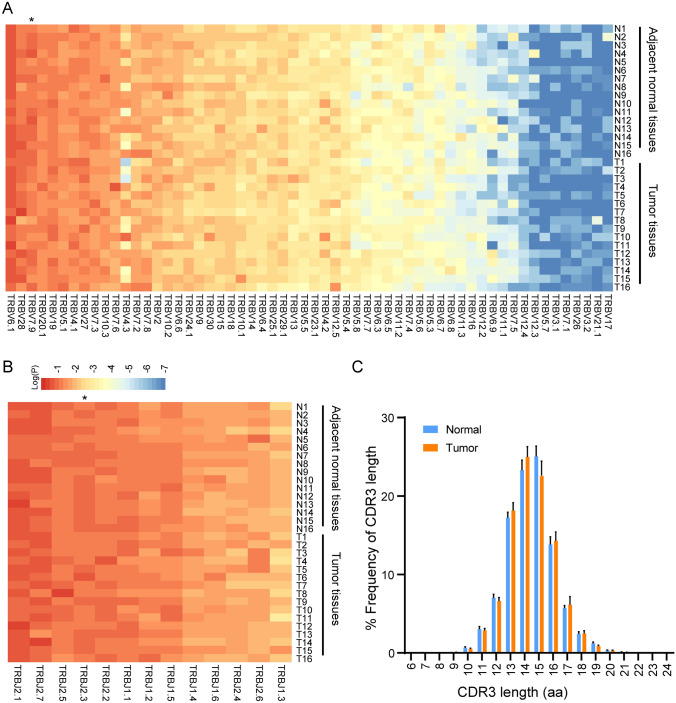
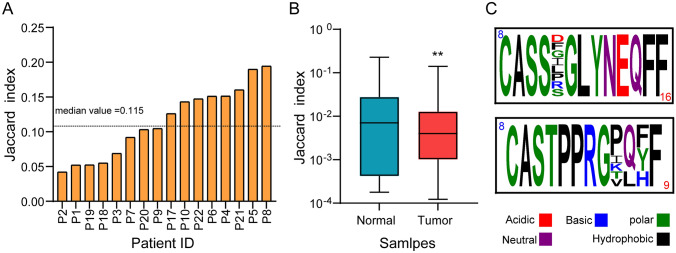
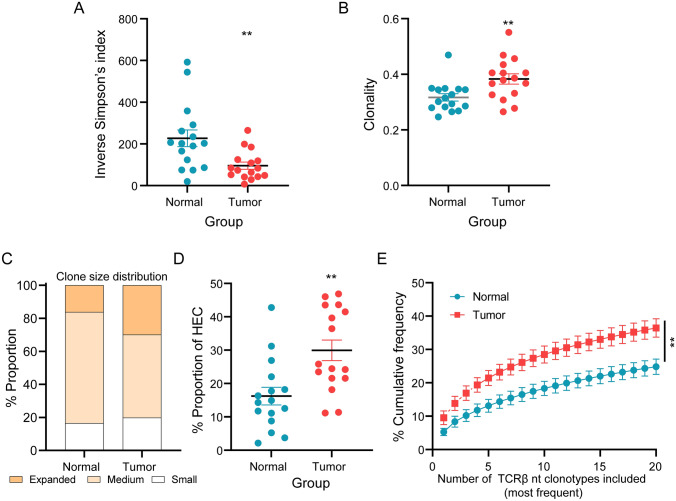
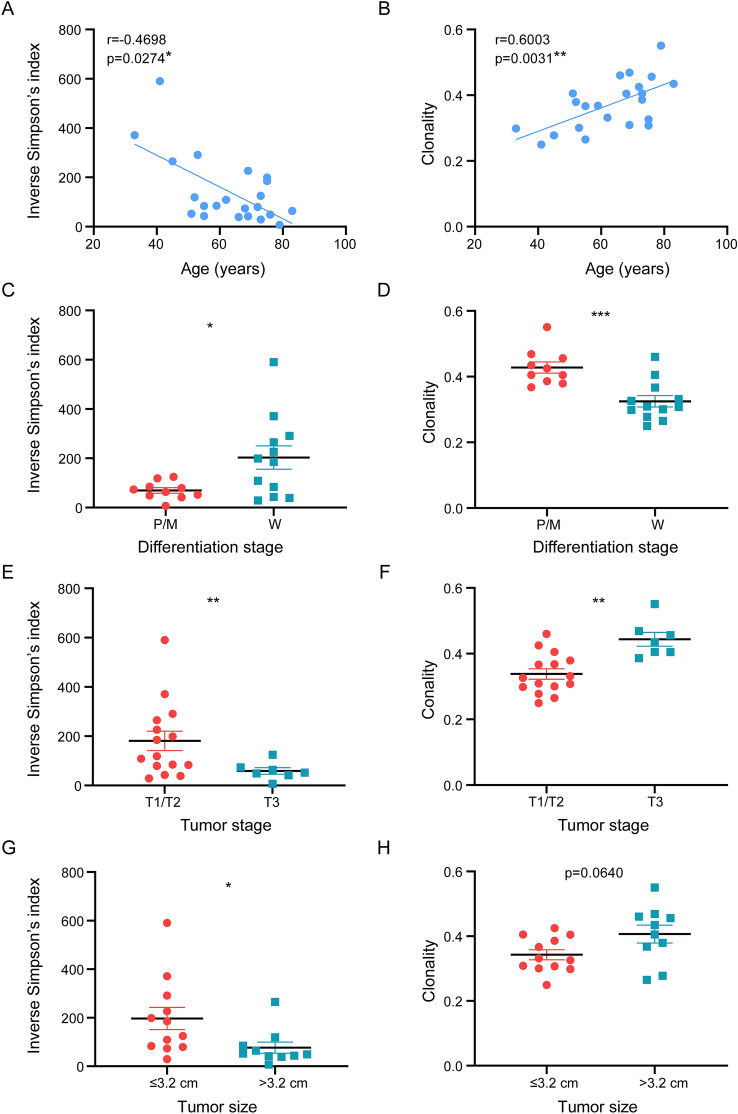
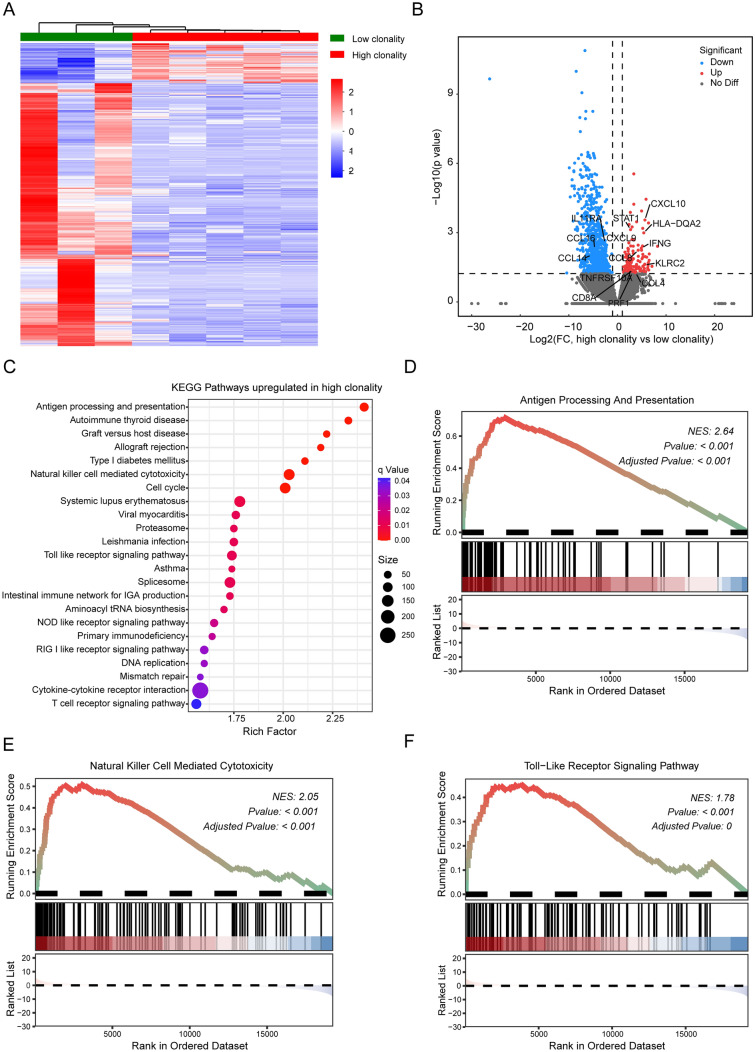
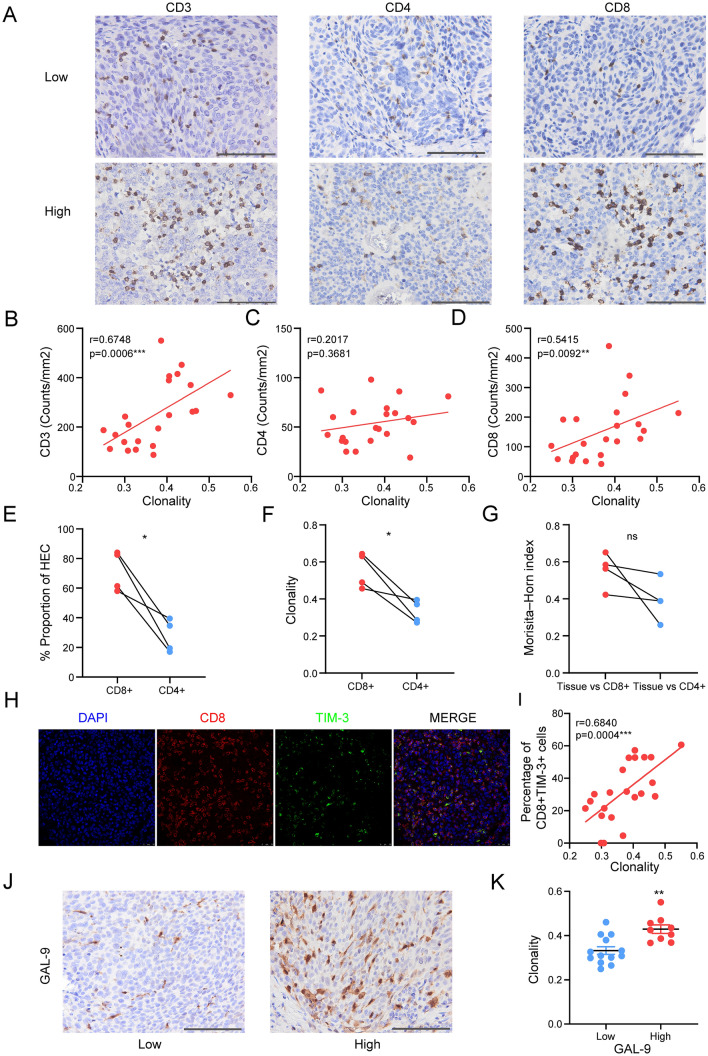
Tumor-infiltrating lymphocytes (TILs) play a key role in regulating the host immune response and shaping tumor microenvironment. It has been previously shown that T cell infiltration in penile tumors was associated with clinical outcomes. However, few studies have reported the T cell receptor (TCR) repertoire in patients with penile cancer. In the present study, we evaluated the TCR repertoires in tumor and adjacent normal tissues from 22 patients with penile squamous cell carcinoma (PSCC). Analysis of the T cell receptor beta-variable (TRBV) and joining (TRBJ) genes usage and analysis of complementarity determining region 3 (CDR3) length distribution did not show significant differences between tumor and matched normal tissues. Moreover, analysis of the median Jaccard index indicated a limited overlap of TCR repertoire between these groups. Compared with normal tissues, a significantly lower diversity and higher clonality of TCR repertoire was observed in tumor samples, which was associated with clinical characteristics. Further analysis of transcriptional profiles demonstrated that tumor samples with high clonality showed increased expression of genes associated with CD8 + T cells. In addition, we analyzed the TCR repertoire of CD4 + T cells and CD8 + T cells isolated from tumor tissues. We identified that expanded clonotypes were predominantly in the CD8 + T cell compartment, which presented with an exhausted phenotype. Overall, we comprehensively compared TCR repertoire between penile tumor and normal tissues and demonstrated the presence of distinct T cell immune microenvironments in patients with PSCC.

Keywords: High-throughput sequencing; Penile cancer; TCR clonality; TCR repertoire; Tumor microenvironment.


Conflict of interest statement

The authors declare no conflict of interest.

Figures

Fig. 1
Fig. 1
Comparing the usage of TRBV and TRBJ genes and length distribution of CDR3 sequences between tumor tissues and paired adjacent normal tissues. Heat map of the usage frequency of A TRBV gene and B TRBJ gene between tumor tissues and normal tissues. Statistics are based on the paired Student t test. *P < 0.05. TRBV gene or TRBJ gene frequencies were significantly lower (black star) in tumor tissues than in paired adjacent normal tissues. C Comparison of CDR3 aa sequence length distribution between tumor and normal tissues. Data represent the mean ± SEM of frequencies. T, tumor tissue; N, normal tissue
Fig. 2
Fig. 2
Inter-tissue and intra-tissue overlap of TCR repertoires. A TCR repertoire overlap between tumor and paired adjacent normal tissue for each patient with PSCC was calculated using the Jaccard index. B TCR repertoire overlap between tissues of different individuals was calculated by the Jaccard index. C Representative motifs found in the 18,800 clonally expanded specificity groups. Graphics were generated with Weblogo. The red number on top left of the box reveals the total number of patients who have convergent TCRs. Blue number on bottom right of box shows the total number of different TCRs that contain that motif. Statistics were based on the Wilcoxon matched pairs test. ** P < 0.001
Fig. 3
Fig. 3
Clonal expansion and diversity of T cell repertoire in tumor and normal tissues. A, B Comparison of the A inverse Simpson’s diversity index and B clonality index between tumor tissues and paired adjacent normal tissues. C Distribution of TCR clonotypes of different sizes. Small, 0 < x ≤ 0.1%, medium 0.1% < x ≤ 1%, and expanded, x > 1%. TCR clonal size was normalized by the total number of TCR nt sequences. D Comparison of the percentage of highly expanded clonotypes between tumor and normal tissues. E Cumulative frequencies occupied by the 20 most frequent clonotypes for each tissue type. Data were calculated for sequences from 16 samples per tissue type. Data in the bar graphs represent means ± SEM. Statistics were based on the Wilcoxon matched pairs test. ** P < 0.001; HEC, highly expanded clonotypes; nt, nucleotide
Fig. 4
Fig. 4
Relationship between TCR repertoire and individual characteristics. A, B Correlation between age and A TCR diversity or B clonality. C, D Comparison of C TCR diversity or D clonality between different pathological stages of PSCC. E, F Comparison of E TCR diversity or F clonality index based on tumor stages of patients with PSCC. G, H. Comparison of G TCR diversity or H clonality between patients with a primary tumor diameter greater than 3.2 cm and patients with a primary tumor diameter less than 3.2 cm (median tumor size). Data in the bar graphs represent means ± SEM. The Spearman’s rank test and unpaired two-sided Student t test with Welch’s correction were used for analysis. *P < 0.05, ** P < 0.001, *** P < 0.0001. P, poorly; M, moderately; W, well
Fig. 5
Fig. 5
Transcriptomic analyses revealed immune activation signatures in patients with high clonality. A Comparing hierarchical clustering of DEGs between patients with “high-clonality” (red) and “low-clonality” (blue). B Volcano plot of significant DEGs between high- and low-clonality groups. C KEGG pathway analysis of upregulated genes in the high-clonality group. The vertical axis represents the pathway category, and the horizontal axis represents the enrichment score [− log(q-value)] of the pathway. Significantly enriched KEGG pathways (q value < 0.05) are presented. DF Gene set enrichment analyses revealed that D antigen processing and presentation, E natural killer cell-mediated cytotoxicity, and F toll-like receptor signaling pathway were significantly enriched in the high-clonality group
Fig. 6
Fig. 6
TCR clonality was associated with exhausted CD8 + T cells. A Representative IHC images of different subsets of T lymphocytes from penile tumor tissues (from left to right): CD3 + T cells, CD4 + T cells, and CD8 + T cells between the low-clonality (up) and high-clonality (bottom) groups. Scale bar = 200 μm. Magnification, 400X. BD Correlation between TCR clonality and B CD3 density (n = 22), C CD4 density (n = 22), and D CD8 density (n = 22) measured by IHC. E Percentage of high-frequency clonotypes within the sorted CD4 + T cells and CD8 + T cells. F Clonality index of sorted CD4 + T cells and CD8 + T cells. G Similarities of TCR repertoire for each patient analyzed by the Morisita–Horn index between repertoire of the whole tissue and the CD4 + or CD8 + population. H Immunofluorescence staining of CD8 and TIM-3 in one patient. Scale bar = 25 μm. I Correlation between TCR clonality and the percentage of TIM-3 + CD8 + cells among total CD8 + cells. J Representative cases were showing GAL-9 expression. Left, low GAL-9 expression; right, high GAL-9 expression. Scale bar = 200 μm. Magnification, 400X. (K) TCR clonality in GAL-9hi tumors and GAL-9lo tumors. Data represent means ± SEM. The Spearman’s rank test, paired Student t test, and unpaired two-sided Student t test with Welch’s correction were used for analysis. ns, not significant; * P < 0.05, ** P < 0.001, *** P < 0.0001

Similar articles

Cited by

References

    1. Douglawi A, Masterson TA. Penile cancer epidemiology and risk factors: a contemporary review. Curr Opin Urol. 2019;29:145–149. doi: 10.1097/mou.0000000000000581. - DOI - PubMed
    1. Hu C, Bai Y, Li J, et al. Prognostic value of systemic inflammatory factors NLR, LMR, PLR and LDH in penile cancer. BMC Urol. 2020;20:57. doi: 10.1186/s12894-020-00628-z. - DOI - PMC - PubMed
    1. Clark PE, Spiess PE, Agarwal N, et al. Penile cancer: clinical practice guidelines in oncology. J Natl Compreh Cancer Netw JNCCN. 2013;11:594–615. doi: 10.6004/jnccn.2013.0075. - DOI - PMC - PubMed
    1. Bleeker MC, Heideman DA, Snijders PJ, Horenblas S, Dillner J, Meijer CJ. Penile cancer: epidemiology, pathogenesis and prevention. World J Urol. 2009;27:141–150. doi: 10.1007/s00345-008-0302-z. - DOI - PubMed
    1. Huang T, Cheng X, Chahoud J, et al. Effective combinatorial immunotherapy for penile squamous cell carcinoma. Nat Commun. 2020;11:2124. doi: 10.1038/s41467-020-15980-9. - DOI - PMC - PubMed

MeSH terms

Substances