. 2024 Feb 15;187(4):897-913.e18.
doi: 10.1016/j.cell.2023.12.036. Epub 2024 Jan 26.

Gut complement induced by the microbiota combats pathogens and spares commensals

Affiliations

Gut complement induced by the microbiota combats pathogens and spares commensals

Meng Wu et al. Cell. .

Abstract

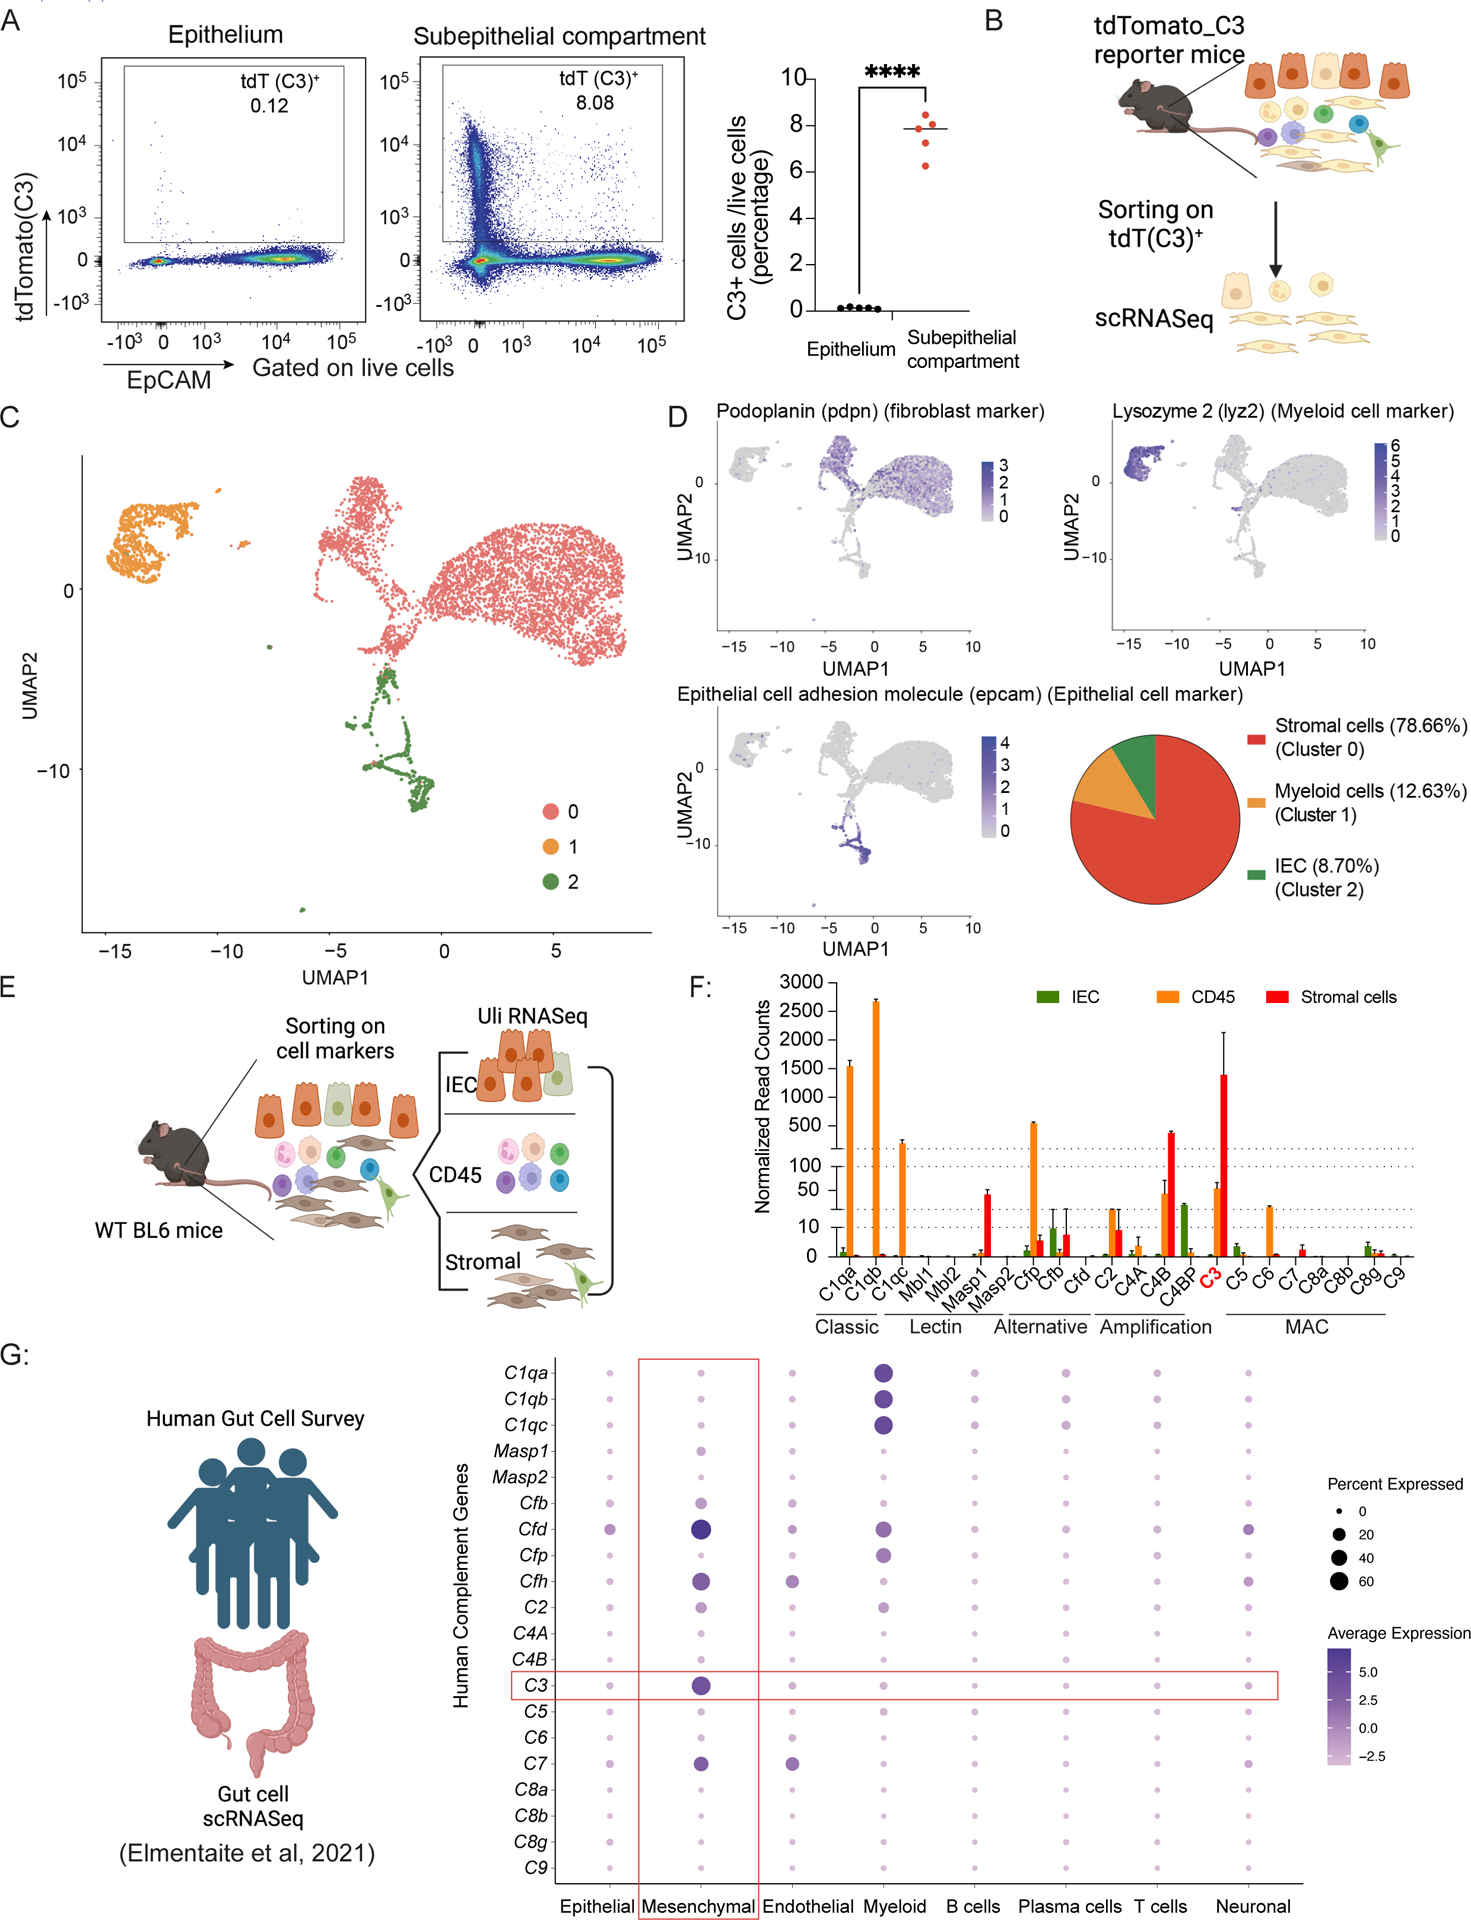
Canonically, the complement system is known for its rapid response to remove microbes in the bloodstream. However, relatively little is known about a functioning complement system on intestinal mucosal surfaces. Herein, we report the local synthesis of complement component 3 (C3) in the gut, primarily by stromal cells. C3 is expressed upon commensal colonization and is regulated by the composition of the microbiota in healthy humans and mice, leading to an individual host's specific luminal C3 levels. The absence of membrane attack complex (MAC) components in the gut ensures that C3 deposition does not result in the lysis of commensals. Pathogen infection triggers the immune system to recruit neutrophils to the infection site for pathogen clearance. Basal C3 levels directly correlate with protection against enteric infection. Our study reveals the gut complement system as an innate immune mechanism acting as a vigilant sentinel that combats pathogens and spares commensals.

Keywords: complement C3; gut complement system; innate immunity; isolated lymphoid follicles; microbiome; microbiota; stromal cells.


Conflict of interest statement

Declaration of interests J.R.M. is a co-founder, stakeholder, and advisor for Vizgen, Inc.

Figures

Figure 1:
Figure 1:. Gut complement factor C3 is regulated by the host microbiota.
(A) Mouse models used to evaluate fecal C3 levels in (B). GF: C57BL/6 germ-free mice; SPF: specific-pathogen free C57BL/6 mice harbor a conventional murine microbiota; SPFABX: SPF mice treated with antibiotics for two weeks; GFSPF: germ-free (GF) mice colonized with SPF microbiota. (B) Fecal C3 levels in GF, SPFABX, SPF, and GFSPF. (C) C3 levels in serum of GF and SPF mice. (D) Principal Coordinate Analysis (PCoA) of unweighted UniFrac distance measurements based on the 16S rRNA gene sequencing data of the composition of bacterial communities in fecal samples collected from C57BL/6 mice from three commercial vendors: JAX, Tac, and CR, or GF mice colonized with JAX (GFJAX) or CR microbiota (GFCR) ((q-values=0.001, PERMANOVA). (E) Family level abundance analysis of fecal microbiota from the mice in Figure 1D. (F) Fecal C3 levels in C57BL/6 mice from JAX, Tac; and CR. (G) Fecal C3 levels of gnotobiotic mice colonized for two weeks with fecal samples from the indicated commercial sources. (H) Experimental scheme to evaluate fecal C3 levels in a healthy human cohort and their relationship to the gut microbiota. (I) Fecal C3 levels in 31 healthy adult human donors. (J) Fecal C3 levels in gnotobiotic mice monocolonized with fecal microbiota from either human donor 1 or donor 8. ns: not-significant,*p<0.05, **p<0.01, *** p<0.001, **** p<0.0001, unpaired student’s t-test.
Figure 2:
Figure 2:. Prevotella spp. induce production of high luminal C3 levels in a complex host microbiota.
(A) Fecal C3 levels of JAX or CR mice by themselves or co-housed for two weeks with mice from the other vendor (JAXcoh_CR: JAX mice co-housed with CR mice, CRcoh_JAX: CR mice co-housed with JAX mice). Statistical analyses were performed comparing treated mice to their untreated control. (B) Family level abundance analysis of fecal microbiota from the mice in (A) and (C). (C)Fecal C3 levels in JAX or CR mice co-housed for either one or three days, also in JAX mice gavaged with CR microbiota (JAXgav). Statistical analyses were performed comparing treated mice to their untreated control. (D) Microbiome alterations at the species level in JAX mice cohoused with CR mice for one day (JAXcoh_1d) compared to JAX controls. Colored dots indicate the bacterial abundance differences; lines indicate the 95% confidence interval (CI) calculated using the bootstrap method. Bacterial species were identified by 16S rRNA gene sequencing and analyzed using the Wilcoxon rank-sum test. Red: Increase; Blue: Decrease. Significance was determined by W-value calculated using Analysis of Composition of Microbiomes (ANCOM) and * indicated the species with significant alterations. Species with a W-value above 20 are shown. (E) Relative abundance of Prevotella spp. in JAX or CR mice, as well as in JAXcoh_1d, or in JAXgav. (F) Fecal C3 levels in JAX mice compared to JAX mice colonized with either Proteus mirabilis, Prevotella spp., or CR microbiota. (G) Fecal C3 levels in gnotobiotic mice monocolonized with either Proteus mirabilis CR2 or Prevotella spp. CR1. (H) Fecal C3 levels in gnotobiotic mice monocolonized with 50 distinct human-derived bacterial strains and the mouse-derived bacterial strain segmented filamentous bacteria (SFB). ns: not-significant,*p<0.05, **p<0.01, *** p<0.001, **** p<0.0001, unpaired student’s t-test.
Figure 3:
Figure 3:. Stromal cells are the predominant cell population expressing C3 during homeostasis.
(A) Representative plots of the live colonic epithelial and subepithelial compartment of C3IRES-tdTomato reporter mice showing the frequency of C3-tdTomato+ cells and the statistics. (B) Overall experimental scheme using C3IRES-tdTomato reporter mice to identify cellular sources for C3 in the colon. (C) UMAP shows scRNASeq profiles of tdTomato positive mouse colonic cells (dots) from C3IRES-tdTomato reporter mice, clustered into three cell types as indicated by the colors. (D) UMAP with cells organized by cell type and colored by pdpn, lyz2, and epcam expression levels. (E) Overall experimental scheme using WT C57BL/6 mice to verify cellular sources for C3 in the colon. (F) Complement system gene expression levels in WT C57BL/6 mice of the three indicated populations by Ultra Low input (Uli)-RNASeq. (G) Dot plot showing average expression levels (color) of genes in the human complement system (rows) in several colonic cell populations (columns) from human adult colon samples; dot size represents the percent of cells within each parent population (column) that express these genes (row). **** p<0.0001, unpaired student’s t-test.
Figure 4:
Figure 4:. Location and function of C3-expressing intestinal stromal cells.
(A). RNAscope in situ hybridization of C3-specific anti-sense mRNA probe (red) in mouse colon samples from WT C57BL/6 mice. (B). Immunofluorescence microscopy of colonic sections from C3IRES-tdTomato reporter mice stained against tdTomato (red), PDPN (green), or DNA (blue). (C). Overall experimental scheme for the isolation of colonic C3+ stromal cells from C3IRES-tdTomato reporter mice, which are subsequently stimulated by fixed bacteria or molecules and tested for C3 transcript expression and protein production. (D–G). Transcriptional expression levels of C3 (D and F) and C3 protein concentration in the culture medium (E and G) of colonic stromal cells stimulated in vitro by fixed bacterial strains individually or in combination. (H). Correlation of C3 transcriptional expression levels and C3 protein levels in the culture media from 4D–G. (I, J). Transcriptional expression levels of tlr4(I) and nod2(J) in the three indicated cell types from scRNASeq of C3-expressing colonic cells. (K) C3 concentration in the culture medium of colonic stromal cells from WT, TLR4−/−, or MyD88−/− mice stimulated by LPS (1ug/ml) or medium-only as control. * p<0.05; ** p<0.01,****p<0.0001, unpaired student’s t-test.
Figure 5:
Figure 5:. Complement factor C3 is critical for protection against Citrobacter rodentium infection.
(A) Survival of ~4-week-old C57BL/6 WT and C3-deficient mice following challenge with C. rodentium (5×10⁸ CFUs/mouse). (B). Weight loss following challenge with C. rodentium (5×10⁸ CFUs/mouse) in three groups of ~8-week-old mice: WT, C3-deficient (C3−/−), and WT depleted of serum complement with cobra venom factor (WTCVF). (C). Fecal CFU counts of C. rodentium at day 11 post-infection in untreated WT, WT treated with cobra venom factor (CVF) (WTCVF), or C3-deficient mice (C3−/−). (D, E). Images of cross-section of colons containing fecal matter from C. rodentium-infected mice that are C3-deficient (D) or WT (E). Samples were stained with C. rodentium specific rRNA FISH probes (red), Eub338 rRNA FISH probes (green), and DAPI (blue). (F). C. rodentium density under the epithelial layer of C3-deficient or WT mice, normalized by colon length (n = 8). (G). Flow cytometry histogram and quantification of C3 protein on GFP+ C. rodentium at day 7 post-infection. (H). Fecal C3 levels of gnotobiotic mice two weeks after colonization with JAX or CR microbiota. (I). Weight loss of gnotobiotic mice colonized with JAX or CR microbiota following challenge with C. rodentium (2×10¹⁰ CFUs/mouse). (J). Fecal CFU enumeration of C. rodentium on day eleven post-infection in gnotobiotic mice colonized prior to challenge with JAX or CR microbiota. ns=not significant, *<0.05; ** p<0.01,***p<0.001,Student’s t-test
Figure 6:
Figure 6:. Fecal levels of Complement C3 increase significantly during infection.
(A). Overall experimental timeline of flow cytometric analysis of C3-expressing cells in C3IRES-tdTomato reporter mice after C. rodentium infection. (B). Fecal C3 protein levels at 1, 4, 7, 11 and 15 days post-infection (dpi). (C). Percentage of live cells isolated from the colonic lamina propria of C3IRES-tdTomato reporter mice transcriptionally expressing C3 on days 0, 5, 8 and 14 post-infection. (D). Percentage of cells transcribing C3 among stromal, CD45+ cells and IECs. (E). Percentage of stromal, CD45+ cells or IEC transcribing C3 amongst the total live cell population isolated from colonic lamina propria at indicated days post-infection. (F). Overall experimental timeline of RNASeq analysis of sorted cell populations in WT C57BL/6 mice after C. rodentium infection. (G). RNA-seq analysis of C3 gene expression levels in the three indicated cell populations in WT C57BL/6 mice. (H). Heatmap of complement system gene expression levels in the three indicated cell populations of WT C57BL/6 mice. ns: not-significant ,** p<0.01, *** p<0.001, **** p<0.0001 Student’s t-test
Figure 7:
Figure 7:. C3-mediated neutrophil phagocytosis is crucial for clearing Citrobacter rodentium during enteric infection.
(A–B). Representative gating (A) and frequencies (B) of the high-C3-expressing subset in colonic subepithelial CD45+C3+ cells during homeostasis (D0) and at 5, 8 and 14 days post C. rodentium infection. (C). Percentage of neutrophils, macrophages, Ly6C-intermediate and Ly6C-high monocytes in the high-C3-expressing CD45+ cells at 14 days post C. rodentium infection. (D). Representative histograms of C3 gene expression in neutrophils at 0, 5, 8, and 14 days post-infection (dpi) in C3IRES-tdTomato reporter mice. (E). Percentage of the C3-expressing neutrophils amongst total neutrophils from colonic lamina propria at indicated days post-infection. (F). Percentage of neutrophils in CD45+ cells in epithelium (F) or colonic lamina propria (G) at day 0, 5, 8, and 14 post-infection. (H–I). Representative gating and frequency of GFP+ C. rodentium uptake in neutrophils in the colonic intraepithelial (H) and lamina propria (I) layers at seven days post-infection. Left panels are the mice infected with WT C. rodentium as control for GFP+ gating. Right panels are the mice infected with GFP+ isogenic C. rodentium. * p<0.05,** p<0.01, *** p<0.001, Student’s t-test

Comment in

References

    1. . Kunz N, and Kemper C (2021). Complement Has Brains—Do Intracellular Complement and Immunometabolism Cooperate in Tissue Homeostasis and Behavior? Front. Immunol 12. 10.3389/fimmu.2021.629986. - DOI - PMC - PubMed
    1. Pratt JR, Abe K, Miyazaki M, Zhou W, and Sacks SH (2000). In situ localization of C3 synthesis in experimental acute renal allograft rejection. Am J Pathol 157, 825–831. 10.1016/S0002-9440(10)64596-8. - DOI - PMC - PubMed
    1. Liszewski MK, Kolev M, Le Friec G, Leung M, Bertram PG, Fara AF, Subias M, Pickering MC, Drouet C, Meri S, et al. (2013). Intracellular Complement Activation Sustains T Cell Homeostasis and Mediates Effector Differentiation. Immunity 39, 1143–1157. 10.1016/j.immuni.2013.10.018. - DOI - PMC - PubMed
    1. Lubbers R, van Essen MF, van Kooten C, and Trouw LA (2017). Production of complement components by cells of the immune system. Clin Exp Immunol 188, 183–194. 10.1111/cei.12952. - DOI - PMC - PubMed
    1. Kulkarni HS, Elvington ML, Perng Y-C, Liszewski MK, Byers DE, Farkouh C, Yusen RD, Lenschow DJ, Brody SL, and Atkinson JP (2019). Intracellular C3 Protects Human Airway Epithelial Cells from Stress-associated Cell Death. Am J Respir Cell Mol Biol 60, 144–157. 10.1165/rcmb.2017-0405OC. - DOI - PMC - PubMed