. 2024 Feb 20;5(2):101394.
doi: 10.1016/j.xcrm.2024.101394. Epub 2024 Jan 26.

Lineage and ecology define liver tumor evolution in response to treatment

Affiliations

Lineage and ecology define liver tumor evolution in response to treatment

Mahler Revsine et al. Cell Rep Med. .

Abstract

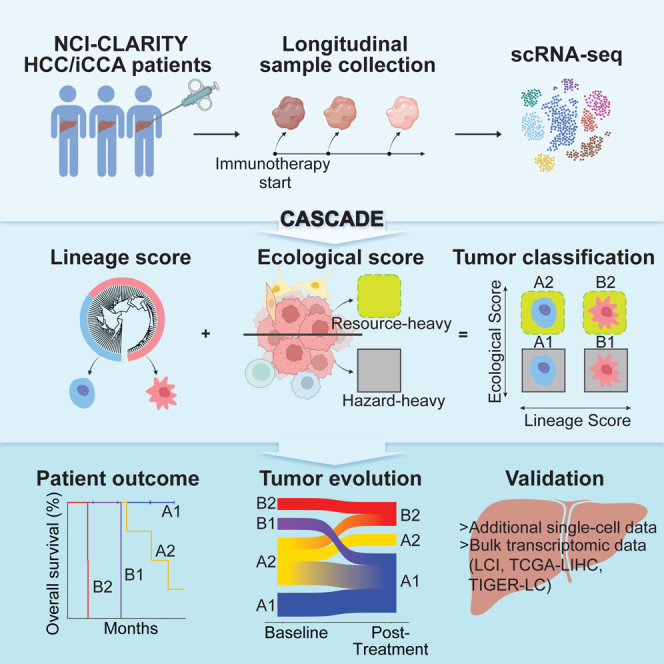
A tumor ecosystem constantly evolves over time in the face of immune predation or therapeutic intervention, resulting in treatment failure and tumor progression. Here, we present a single-cell transcriptome-based strategy to determine the evolution of longitudinal tumor biopsies from liver cancer patients by measuring cellular lineage and ecology. We construct a lineage and ecological score as joint dynamics of tumor cells and their microenvironments. Tumors may be classified into four main states in the lineage-ecological space, which are associated with clinical outcomes. Analysis of longitudinal samples reveals the evolutionary trajectory of tumors in response to treatment. We validate the lineage-ecology-based scoring system in predicting clinical outcomes using bulk transcriptomic data of additional cohorts of 716 liver cancer patients. Our study provides a framework for monitoring tumor evolution in response to therapeutic intervention.

Keywords: cholangiocarcinoma; hepatocellular carcinoma; immunotherapy; liver cancer; single cell; tumor ecology; tumor evolution; tumor heterogeneity; tumor lineage; tumor microenvironment.


Conflict of interest statement

Declaration of interests The authors declare no competing interests.

Figures

None
Graphical abstract
Figure 1
Figure 1
Determination of malignant cell groups (A) t-SNE plot of all 13,042 malignant cells. Cells are assigned a general color by patient and a shade of that color by sample, with the lightest shade at baseline and successively darker hues for post-treatment samples. Patient IDs start with H and C to denote the clinical diagnosis of HCC and iCCA, respectively. (B) Hierarchical relationship of all malignant cells. Inner section shows the hierarchical relationship among all cells, with colors showing the top 20 clades. Outer ring denotes the top four clades of the hierarchical tree as tumor lineages. The four interior rings indicate with matched colors the expression of the differentially expressed genes for each of the four major lineages. (C) Violin plots of the expression of the top five differentially expressed genes by log fold change for each tumor lineage. (D) Average expression of representative genes specific to cholangiocytes (CC), hepatocytes (HC), inflammation, or epithelial-mesenchymal transition (EMT) in malignant cells of each tumor lineage. The p values were calculated using a two-sided t test. (E) Enriched pathways of each tumor lineage. Normalized enrichment score (NES) is shown for each pathway. (F) Tumor lineage composition in each tumor sample with at least 15 malignant cells detected. Bars are colored by lineage: CLTC in red, HLTC in blue, MCTC in green, and MLTC in purple. See also Figures S1 and S2 and Tables S1 and S2.
Figure 2
Figure 2
The landscape of the TME (A‒F) t-SNE plots of all non-malignant cells (A) (n = 44,525), B and plasma cells (B) (n = 1,914), T and NK cells (C) (n = 30,020), CAFs (D) (n = 1,029), TAMs (E) (n = 4,702), and TECs (F) (n = 2,762). (G) Hierarchical relationship of the TME composition in each tumor sample with at least 15 non-malignant cells detected. The two major clades are colored, with clade 1 in blue and clade 2 in red. (H) Relative abundance of each non-malignant cell subtype in each clade of the TME in (G). (I) Composition of immune and stromal cells in each clade of the TME in (G). See also Figures S3 and S4 and Table S3.
Figure 3
Figure 3
Modeling a tumor ecosystem using lineage and ecological scores (A) Graphical representation of using lineage and ecological scores to model a tumor ecosystem. (B) Projection of the baseline samples from each of the 11 patients in the discovery single-cell cohort to the lineage-ecological space. (C) Biological features of the tumors in each quadrant of the lineage-ecological space. The heatmap on the left shows the average expression of the top positive and negative differentially expressed genes in a quadrant. Each section of the heatmap, denoting differentially expressed genes for a quadrant (from top to bottom A1, A2, B1, and B2), has a corresponding plot on the right showing the top significantly enriched hallmark pathways for those genes. Pathways are ordered by high to low normalized enrichment score (NES). Only upregulated pathways are shown here. (D and E) Kaplan-Meier plots of the 11 liver cancer patients (D) or only HCC patients (E) from the quadrants in (B). The p value was calculated using the log rank test for trend. (F) Forest plot of hazard ratio in an additional HCC/iCCA single-cell cohort (sc) (n = 20) and three bulk HCC cohorts of LCI (n = 239), TCGA (n = 363), and TIGER-LC (n = 62). Quadrant B2 was used as the reference group for hazard ratio calculation. Bars show 95% confidence interval. See also Figures S5 and S6 and Tables S4 and S5.
Figure 4
Figure 4
The evolutionary landscape of the tumor and the TME (A‒K) The composition of tumor cells and the TME during tumor evolution for patients H73 (A), H85 (B), H77 (C), H68 (D), C26 (E), C46 (F), H08 (G), H58 (H), H01 (I), H49 (J), and H34 (K). Levels of alpha-fetoprotein (AFP) or cancer antigen 19-9 (CA 19-9) are indicated for HCC and iCCA patients, respectively. Not every sample has both detectable malignant and non-malignant single cells. The baseline sample for patient C46 only has five malignant cells and is excluded from our analyses but is shown here for reference.
Figure 5
Figure 5
Application of CASCADE in modeling tumor evolution (A) Projection of longitudinal samples (n = 23) from the 11 patients in the single-cell discovery cohort into the lineage-ecological space. Only samples with both detectable malignant and non-malignant cells were included in this plot. (B) Sankey plot of transitions in the lineage-ecological space between the baseline and the final post-treatment sample of each patient in the single-cell discovery cohort (n = 8). Patients with only one sample in (A) are not included in this plot. (C) Projection of longitudinal samples (n = 75) from liver cancer patients in the NCI CLARITY retrospective cohort into the lineage-ecological space. Patients may have more than one baseline or post-treatment sample. (D) Sankey plot of transitions in the lineage-ecological space between the baseline and the final post-treatment sample of each patient in the NCI CLARITY retrospective cohort (n = 32 patients). Only patients with at least two samples are included here. (E) Kaplan-Meier plot of the patients in the NCI CLARITY retrospective cohort based on quadrants of the baseline samples (A1, n = 13 patients; A2, n = 5; B1, n = 6; B2, n = 8). The p value was calculated using the log rank test for trend. (F) Forest plot of the hazard ratio in all patients from the NCI CLARITY retrospective cohort (n = 32). Patients are grouped by their lineage-ecological quadrant at baseline (left) (A1, n = 13 patients; A2, n = 5; B1, n = 6; B2, n = 8) and their final follow-up time point (right) (A1, n = 13 patients; A2, n = 6; B1, n = 5; B2, n = 8). Quadrant B2 was used as the reference group for hazard ratio calculation. Bars show 95% confidence interval. ∗p < 0.05 for baseline A1 or A2 compared with baseline B2; p < 0.05 for follow-up A2 compared with follow-up B2; p > 0.05 for follow-up A1 or B2 compared with follow-up B2. (G) Forest plot of the hazard ratio in HCC patients from the NCI CLARITY retrospective cohort (n = 18). Patients are grouped by their lineage-ecological quadrant at baseline (left) (A1, n = 11 patients; A2, n = 5; B1, n = 1; B2, n = 1) and their final follow-up time point (right) (A1, n = 9 patients; A2, n = 6; B1, n = 1; B2, n = 2). Quadrant B2 was used as the reference group for hazard ratio calculation. Bars show 95% confidence interval. p < 0.05 for baseline A1 or A2 compared with B2; p > 0.05 for baseline B1 compared with baseline B2; p < 0.05 for follow-up A2 compared with follow-up B2; p > 0.05 for follow-up A1 or B1 compared with follow-up B2. See also Figures S7 and S8 and Table S5.
Figure 6
Figure 6
MAIT cells drive survival differences between CASCADE quadrants (A) Heatmap of the abundance of each cell subtype in the TME in each CASCADE quadrant from our discovery single-cell cohort. (B) Overall survival of liver cancer patients by MAIT cell level in the discovery single-cell cohort (n = 11). Samples were divided by whether they had any detectable MAIT cells or not. The p value was calculated using the log rank test. (C) t-SNE plot of all T cells (n = 30,020). (D) Volcano plot of differentially expressed genes between MAIT cells and all other T cells. Red lines denote thresholds for significance; the horizontal line is located at an adjusted p value of 0.05 and the two vertical lines are located at a log2 fold change of ±0.5. Red dots, highly upregulated genes; blue dots, downregulated genes. Genes that overlap with MAIT markers are labeled. (E‒H) Kaplan-Meier plots of hazard ratio by MAIT levels in four cohorts of bulk transcriptomic data: CLARITY-retrospective (E) (n = 92), LCI (F) (n = 239), TCGA (G) (n = 363), and TIGER-LC (H) (n = 62). Each cohort is dichotomized by high/low MAIT levels based on gene expression. The p values were calculated using the log rank test. (I) Scatterplot of MAIT signature gene expression and TNF-α in all samples of the CLARITY retrospective cohort (n = 141 samples). The blue line shows a trend line fit using a linear model; the R and p values for correlation trend are indicated.

References

    1. Hanahan D., Weinberg R.A. Hallmarks of cancer: the next generation. Cell. 2011;144:646–674. - PubMed
    1. Andor N., Graham T.A., Jansen M., Xia L.C., Aktipis C.A., Petritsch C., Ji H.P., Maley C.C. Pan-cancer analysis of the extent and consequences of intratumor heterogeneity. Nat. Med. 2016;22:105–113. - PMC - PubMed
    1. Polyak K., Haviv I., Campbell I.G. Co-evolution of tumor cells and their microenvironment. Trends Genet. 2009;25:30–38. - PubMed
    1. Merlo L.M.F., Pepper J.W., Reid B.J., Maley C.C. Cancer as an evolutionary and ecological process. Nat. Rev. Cancer. 2006;6:924–935. - PubMed
    1. Huang D.Q., Singal A.G., Kono Y., Tan D.J.H., El-Serag H.B., Loomba R. Changing global epidemiology of liver cancer from 2010 to 2019: NASH is the fastest growing cause of liver cancer. Cell Metab. 2022;34:969–977.e2. - PMC - PubMed

Publication types

Associated data