. 2024 Jan 27;15(1):830.
doi: 10.1038/s41467-024-45044-1.

Mitophagy curtails cytosolic mtDNA-dependent activation of cGAS/STING inflammation during aging

Affiliations

Mitophagy curtails cytosolic mtDNA-dependent activation of cGAS/STING inflammation during aging

Juan Ignacio Jiménez-Loygorri et al. Nat Commun. .

Erratum in

Abstract

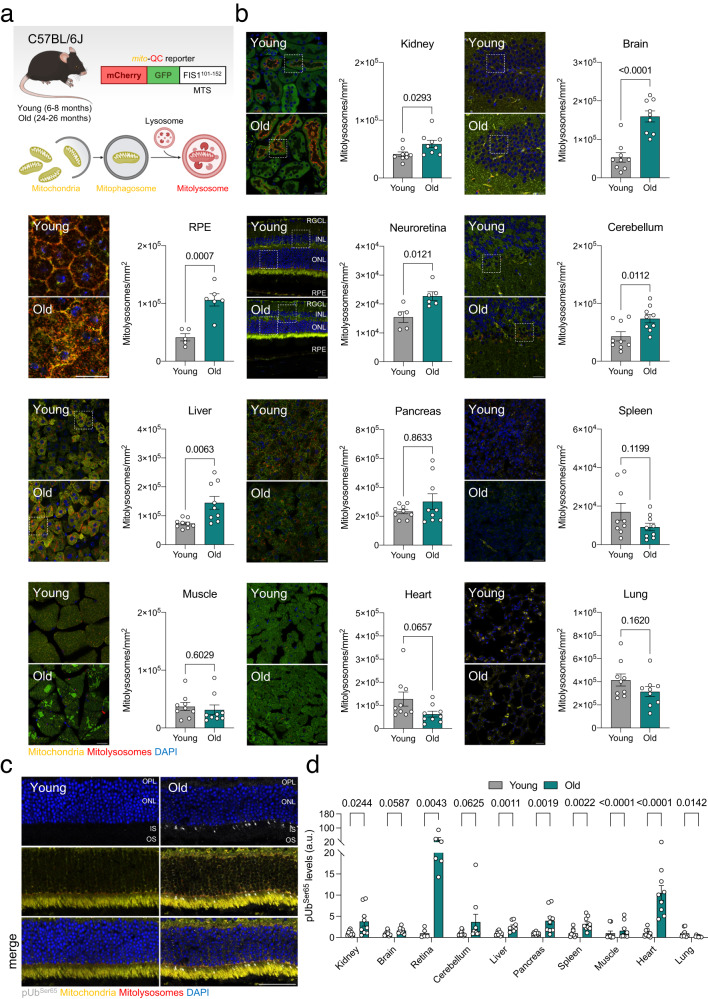
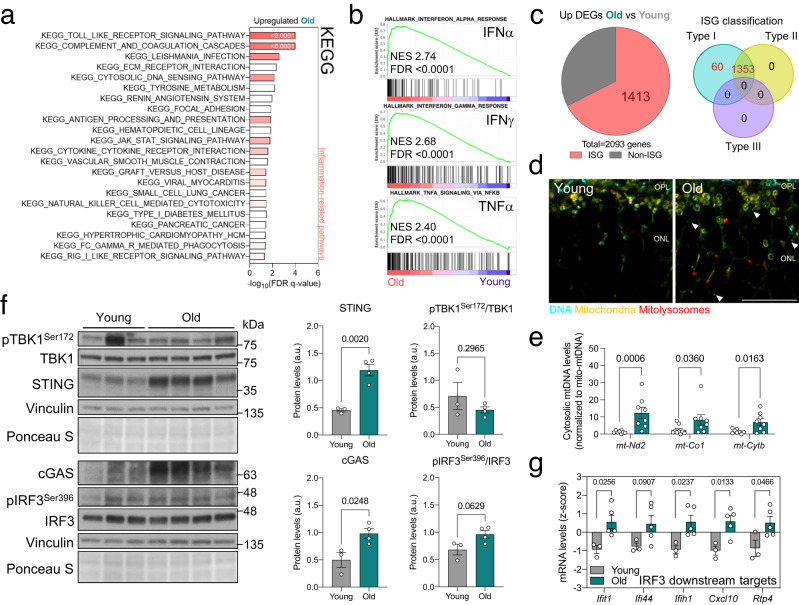
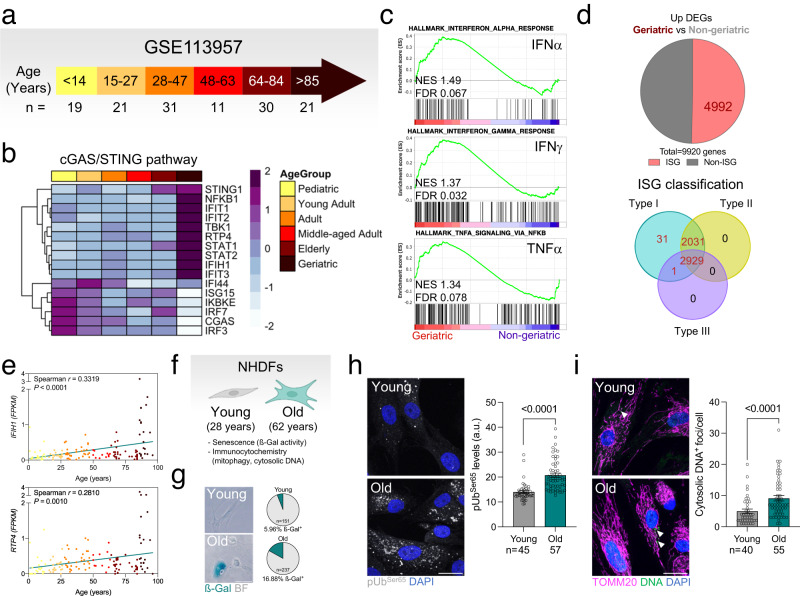
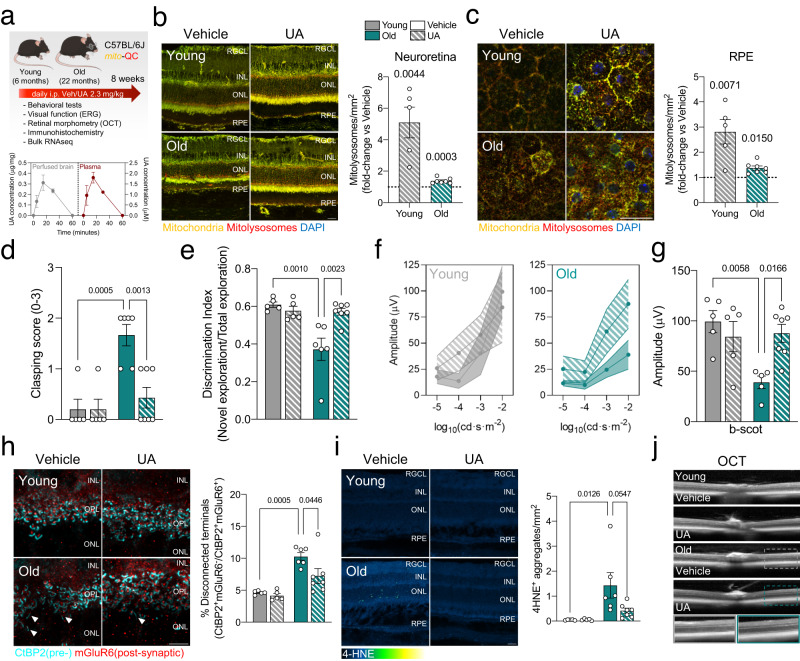
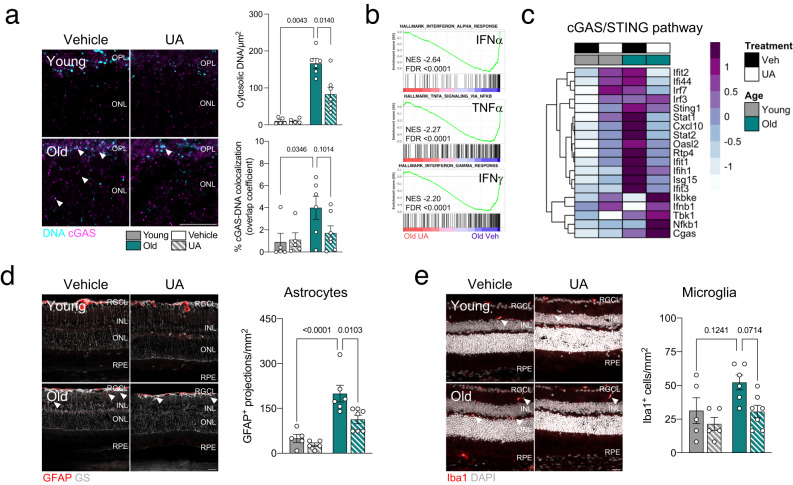
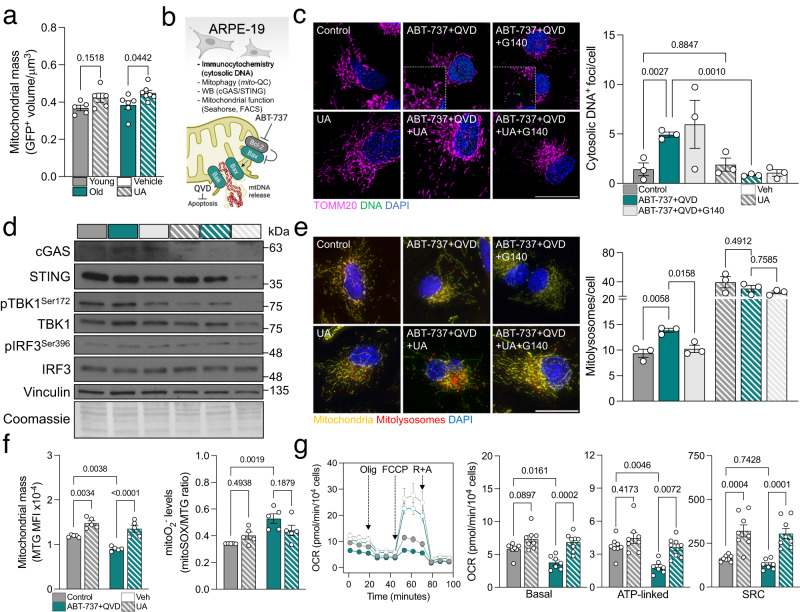
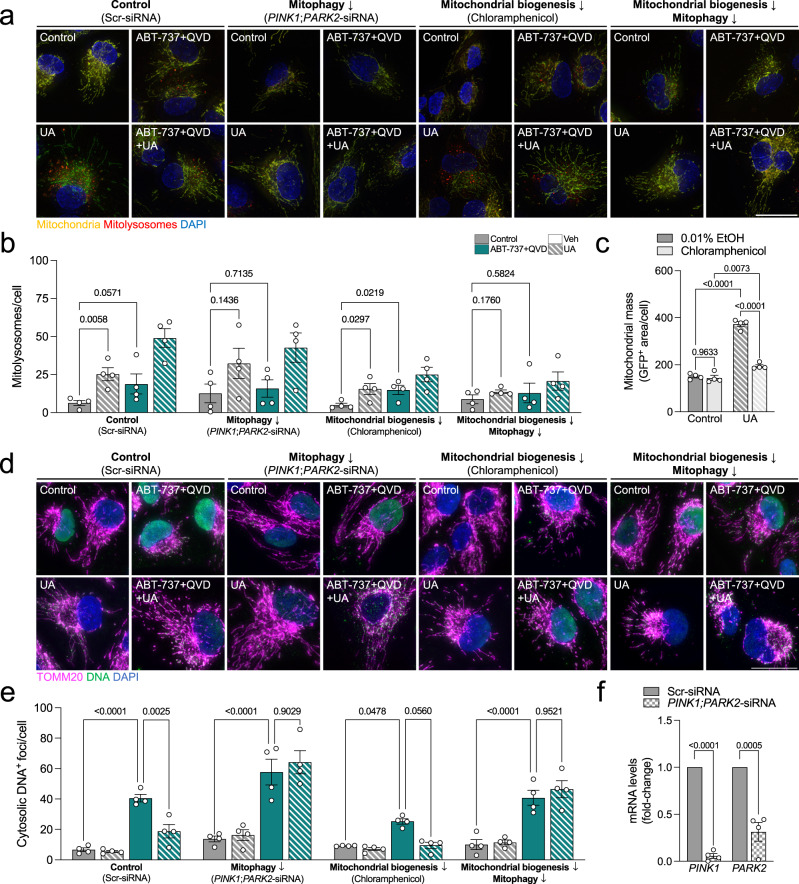
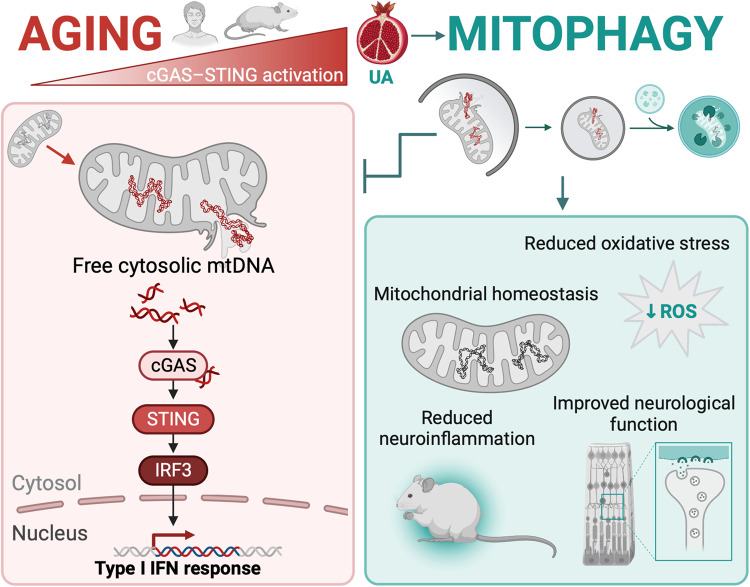
Macroautophagy decreases with age, and this change is considered a hallmark of the aging process. It remains unknown whether mitophagy, the essential selective autophagic degradation of mitochondria, also decreases with age. In our analysis of mitophagy in multiple organs in the mito-QC reporter mouse, mitophagy is either increased or unchanged in old versus young mice. Transcriptomic analysis shows marked upregulation of the type I interferon response in the retina of old mice, which correlates with increased levels of cytosolic mtDNA and activation of the cGAS/STING pathway. Crucially, these same alterations are replicated in primary human fibroblasts from elderly donors. In old mice, pharmacological induction of mitophagy with urolithin A attenuates cGAS/STING activation and ameliorates deterioration of neurological function. These findings point to mitophagy induction as a strategy to decrease age-associated inflammation and increase healthspan.


Conflict of interest statement

The authors declare no competing interests.

Figures

Fig. 1
Fig. 1. Physiological aging in mice is associated with stable or increased mitophagy in multiple organs.
a Young (6–8 months) and old (24–26 months) mito-QC reporter mice bred on a C57BL/6J background were sacrificed and processed for confocal analysis. Created with BioRender.com. b Representative images and quantification of mitolysosome number (mCherry+GFP puncta) in the kidney (renal cortex), brain (hippocampus), RPE, neuroretina, cerebellum, liver, pancreas (exocrine), spleen, muscle (gastrocnemius), heart, and lungs (n = 5–9 mice). Higher magnification insets are provided in Supplementary Fig. 1. c Representative images of whole eye cryosections from young and old mito-QC mice immunostained for phospho-UbiquitinSer65 (gray). d Quantification of phospho-UbiquitinSer65+ area in organs from young and old mito-QC mice (n = 5–9 mice). Scale bars, 25 μm (b) and 50 μm (c). All data are expressed as the mean ± s.e.m. Dots represent individual mice. P values were calculated using a two-tailed Student’s t test (b, Kidney, brain, RPE, neuroretina, cerebellum, liver, spleen, muscle, heart. d Brain, liver, spleen, muscle) or two-tailed Mann–Whitney U-test (b Pancreas. d Kidney, neuroretina, cerebellum, pancreas, heart, lung). Source data are provided as a Source Data file.
Fig. 2
Fig. 2. Increased mtDNA release in old mice triggers cGAS/STING-mediated inflammation.
a Bulk RNA-seq data showing the top enriched KEGG pathways in old versus young retinas. Most correspond to inflammation-related signaling (color intensity corresponds to FDR q-value). b Top three enriched Hallmarks in old retinas: IFNα and IFNγ responses and TNFα signaling. c Interferome analysis (left) of upregulated DEGs in old retinas, showing the proportion of interferon-stimulated genes (ISG, 67.51%) and corresponding ISG classification (right). d Anti-DNA (cyan) immunostaining of whole eye cryosections from young and old mito-QC mice. Arrowheads indicate cytoplasmic DNA (GFPDNA+) and the outer nuclear layer is shown. e qPCR measurement of retinal cytosolic mtDNA in young and old mice (mt-Nd2, mt-Co1, mt-Cytb), normalized to mtDNA content in the mitochondrial fraction (n = 8–9 mice). f Western blot analysis of cGAS/STING mediators (TBK1, IRF3, cGAS, STING) in young and old retinas (n = 3–4 mice). Protein levels are normalized to the loading control (Vinculin). g mRNA levels of downstream targets of the transcription factor IRF3 obtained from retina bulk RNA-seq data (n = 3–5 mice). Scale bar, 15 μm (d). All data are expressed as the mean ± s.e.m. Dots represent individual mice. P values were calculated using a two-tailed Student’s t test (e (mt-Nd2), f, g) or two-tailed Mann–Whitney U-test (e (mt-Co1, mt-Cytb). Source data are provided as a Source Data file.
Fig. 3
Fig. 3. cGAS/STING activation by cytoplasmic DNA is also observed in primary human dermal fibroblasts from elderly donors.
a Age group stratification of primary fibroblast bulk RNAseq data (GSE113957; Fleischer et al.). b Heatmap depicting the expression of cGAS/STING pathway modulators across different age groups. c Enrichment of IFNα and IFNγ responses and TNFα signaling Hallmarks in geriatric fibroblasts. d Interferome analysis (top) showing DEGs that were upregulated in Geriatric fibroblasts, including the proportion of interferon-stimulated genes (ISG, 50.32%); and ISG classification (bottom). e Linear regression analysis of mRNA levels of downstream targets of IRF3 (IFIH1, RTP4) in human fibroblasts during physiological aging (n = 133 samples). f Experimental design: primary culture of normal human dermal fibroblasts (NHDF) from young (28) and old (62 years) donors. Created with BioRender.com. g Senescence-associated ß-galactosidase activity in young and old fibroblasts (n = 151–237 cells). h Representative images showing phospho-UbiquitinSer65 immunostaining (gray) in young and old NHDFs, and corresponding quantification (n = 45–57 cells). i Representative images showing immunostaining of young and old NHDFs for DNA (green) and TOMM20 (magenta, mitochondria), and corresponding quantification (n = 40–55 cells). Scale bars, 25 μm (g, h, i). All data are expressed as the mean ± s.e.m. Dots represent individual samples (e) or cells (h, i). P values were calculated using the Spearman rank correlation (e) or two-tailed Mann–Whitney U-test (h, i). Created with BioRender.com. Source data are provided as a Source Data file.
Fig. 4
Fig. 4. Boosting mitophagy ameliorates age-associated neurological decline.
a Urolithin A (UA, 2.3 mg/kg/day during 8 weeks i.p.) treatment of young and old C57BL/6J mito-QC mice: experimental design and readouts (top) and UPLC-ESI-QTOF-MS quantification of the UA levels in perfused brain and plasma (bottom) (n = 2–3 mice). Created with BioRender.com. b Mitophagy analysis in whole eye cryosections from young and old mice. Representative images (left) and corresponding quantification (right). Dotted line indicates mean in respective vehicle-treated controls (n = 5–7 mice). c Mitophagy analysis in RPE flatmounts from young and old mice. Dotted line indicates mean in respective vehicle-treated controls (n = 5–7 mice). d Hindlimb clasping score in young and old mice treated with vehicle or UA (n = 5–7 mice). A lower score indicates greater neurological functionality. e Discrimination index in the novel object recognition (NOR) test for young and old mice treated with vehicle or UA (n = 5–7 mice). f Electroretinogram (ERG) assessment of visual function in scotopic (dark) conditions in young and old mice treated with vehicle or UA (n = 5–7 mice). g Quantification of b-wave amplitude (μV) at 0.01 cd·s·m−2 from f (n = 5–7 mice). h Synaptic integrity analysis using immunostaining for pre- (CtBP2, cyan) and post- (mGluR6, red) synaptic terminal markers in young and old mouse retinas: representative images and corresponding quantification (n = 5–7 mice). i Detection of lipid peroxidation aggregates using anti-4-HNE immunostaining: representative images and quantification (n = 5–7 mice). j Retinal morphometric assessment by optical coherence tomography (OCT): representative images (n = 5–7 mice). Scale bars, 25 μm (b, c, i) and 15 μm (h). All data are expressed as the mean ± s.e.m. Dots represent individual mice. P values were calculated using a two-tailed Student’s t test (b, c) or 2-way ANOVA with Tukey’s post-hoc test (d, e, g, h, i). Source data are provided as a Source Data file.
Fig. 5
Fig. 5. UA treatment attenuates the increased cGAS/STING response observed in old mice.
a Immunostaining for cGAS (magenta) and DNA (cyan): representative images and colocalization analysis (n = 5–7 mice). b Top three negatively enriched Hallmarks in old retinas treated with UA (2.3 mg/kg/day) versus vehicle: IFNα and IFNγ responses and TNFα signaling. c Heatmap showing expression levels of cGAS/STING pathway modulators in old retinas treated with UA or vehicle. d Representative images and quantification of GFAP+ astrocytic gliosis (red) analysis by immunostaining (n = 5–7 mice). Müller glia and astrocytes were counterstained using Glutamine Synthetase (GS). e Immunostaining for Iba1+ microglial infiltration (red): representative images and corresponding quantification (n = 5–7 mice). Scale bar, 25 μm (a, d, e). All data are expressed as the mean ± s.e.m. Dots represent individual mice. P values were calculated using the two-tailed Mann–Whitney U-test (a) or 2-way ANOVA with Tukey’s post-hoc test (d, e). Source data are provided as a Source Data file.
Fig. 6
Fig. 6. UA induces mitochondrial biogenesis and improves mitochondrial function.
a Analysis of mitochondrial mass (GFP+ volume) in the retina of young or old mito-QC mice treated with UA or vehicle as shown in Fig. 4a, b (n = 5–7 mice). b Experimental design and readouts for the in vitro model of mtDNA release using the ARPE-19 cell line and the Bcl-2 inhibitor ABT-737 (10 μM). Pan-caspase inhibitor Q-VD-OPh (QVD, 10 μM) was added to inhibit apoptosis. Created with BioRender.com. c Representative images showing immunostaining of ARPE-19 cells for DNA (green) and TOMM20 (magenta, mitochondria), and corresponding quantification. UA (100 μM) was used as a mitophagy inducer and human cGAS inhibitor G140 (10 μM) was added as a control. (n = 3 independent experiments) d Western blot analysis of cGAS/STING mediators (TBK1, IRF3, cGAS, STING) in ARPE-19 cells (n = representative of 3 independent experiments). Protein levels are normalized to the loading control (Vinculin). e Representative images of mitophagy analysis in ARPE-19 cells using mito-QC reporter and corresponding analysis (n = 3 independent experiments). f Analysis of mitochondrial mass (MitoTracker Green; MTG) and mitochondrial superoxide production (MitoSOX Red/MTG ratio) by flow cytometry in ARPE-19 cells (n = 5 independent experiments). g Mitochondrial respirometry analysis in ARPE-19 cells using Seahorse XFe24 after sequential injection of Oligomycin, FCCP and Rotenone+Antimycin (n = 7–8 biological replicates from two independent assays). Oxygen consumption rate was normalized to cell number and graphs show basal respiration, ATP-linked respiration and spare respiratory capacity (SRC). Scale bars, 25 μm. All data are expressed as the mean ± s.e.m. Dots represent individual mice (a), independent experiments (c, e, f) or biological replicates from two independent assays (g). P values were calculated using 2-way ANOVA (a) or 1-way ANOVA with Šídák’s (c, e) or Tukey’s (f, g) post-hoc test (c, e). Source data are provided as a Source Data file.
Fig. 7
Fig. 7. PINK1/Parkin-dependent mitophagy stimulation by UA mediates cytosolic ABT-737-induced DNA decrease.
a Representative images of ARPE-19 cells expressing the mito-QC reporter which subjected to PINK1/Parkin-depedent mitophagy (PINK1; PARK2 knockdown) and/or mitochondrial biogenesis (100 μM Chloramphenicol) inhibition, and simultaneously treated with ABT-737 and/or UA. b Quantification of the number of mitolysosomes per cell as shown in Fig. 7a (n = 4 independent experiments). c Quantification of mitochondrial mass in the presence or absence of Chloramphenicol to validate UA-induced mitochondrial biogenesis inhibition, as reported in Fig. 4a, f (n = 4 independent experiments). d Representative images showing immunostaining of ARPE-19 cells for DNA (green) and TOMM20 (magenta, mitochondria). e Quantification of the number of cytosolic DNA foci per cell as shown in Fig. 7d (n = 4 independent experiments). f Quantification of PINK1 and PARK2 mRNA levels to validate siRNA-mediated knockdown efficiency (n = 4 independent experiments). Scale bars, 25 μm. All data are expressed as the mean ± s.e.m. Dots represent independent experiments. P values were calculated using two-tailed Student’s t test (b, c) or two-tailed Mann–Whitney’s U-test (b, Control:Control vs Control:ABT), 1-way ANOVA with Šídák’s post-hoc test (e) or 2-way ANOVA with Šídák’s post-hoc test (f). Source data are provided as a Source Data file.
Fig. 8
Fig. 8. cGAS/STING-driven neuroinflammation associated with aging is modulated by mitophagy.
Age-associated mitochondrial malfunction leads to mtDNA release triggering cGAS/STING activation and type I IFN response in mice and humans. Restoring mitochondrial homeostasis using UA constrained mtDNA leakage, reduced inflammation and improved healthspan. Created with BioRender.com.

References

    1. Yamamoto H, Zhang S, Mizushima N. Autophagy genes in biology and disease. Nat Rev Genet, 24, 382–400 (2023). - PMC - PubMed
    1. Onishi M, Yamano K, Sato M, Matsuda N, Okamoto K. Molecular mechanisms and physiological functions of mitophagy. EMBO J. 2021;40:e104705. doi: 10.15252/embj.2020104705. - DOI - PMC - PubMed
    1. Teresak P, et al. Regulation of PRKN-independent mitophagy. Autophagy. 2022;18:24–39. doi: 10.1080/15548627.2021.1888244. - DOI - PMC - PubMed
    1. López-Otín C, Blasco MA, Partridge L, Serrano M, Kroemer G. Hallmarks of aging: An expanding universe. Cell. 2023;186:243–278. doi: 10.1016/j.cell.2022.11.001. - DOI - PubMed
    1. Schmauck-Medina T, et al. New hallmarks of ageing: a 2022 Copenhagen ageing meeting summary. Aging. 2022;14:6829–6839. doi: 10.18632/aging.204248. - DOI - PMC - PubMed