. 2024 Jan 27;15(1):799.
doi: 10.1038/s41467-024-45103-7.

Chemically-defined and scalable culture system for intestinal stem cells derived from human intestinal organoids

Affiliations

Chemically-defined and scalable culture system for intestinal stem cells derived from human intestinal organoids

Ohman Kwon et al. Nat Commun. .

Abstract

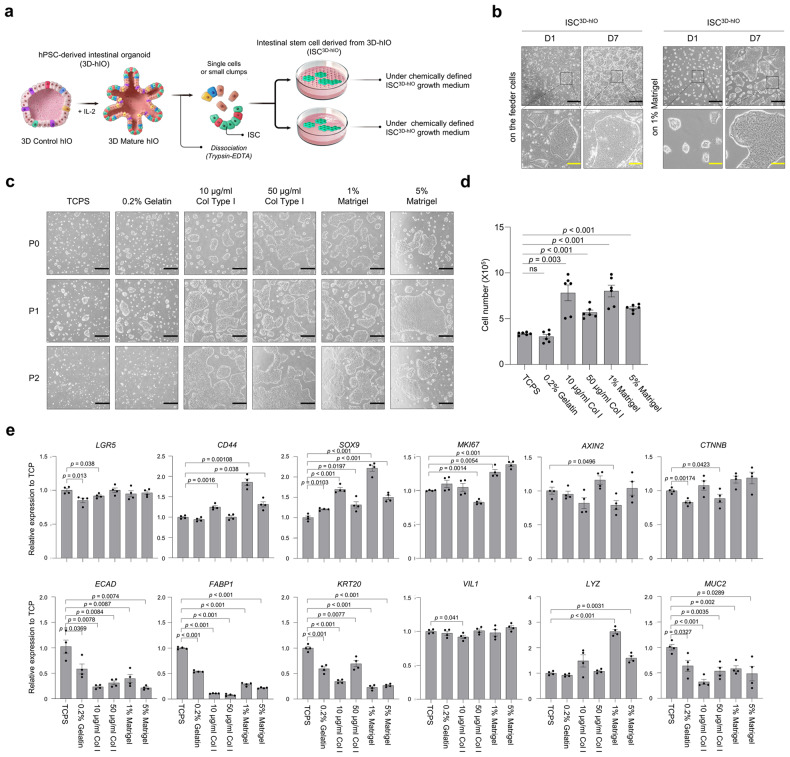
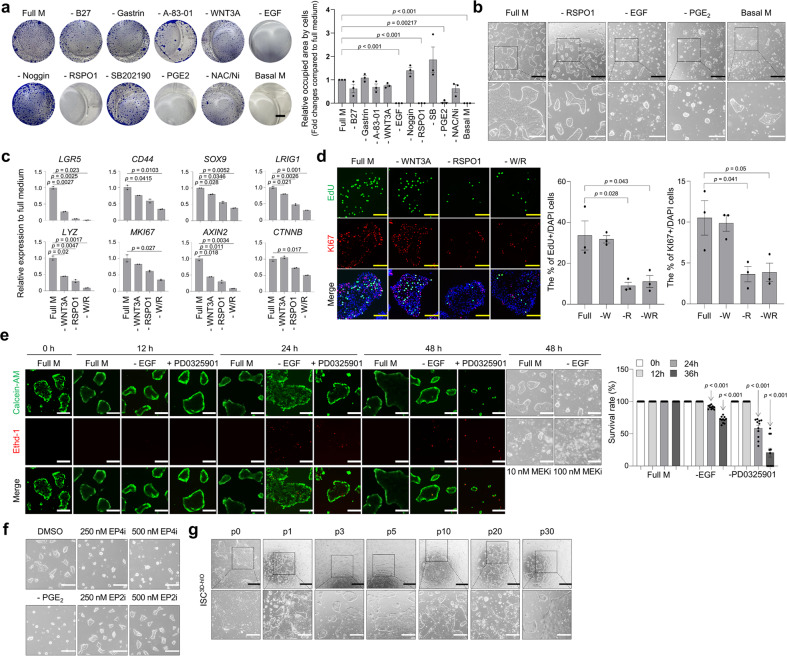
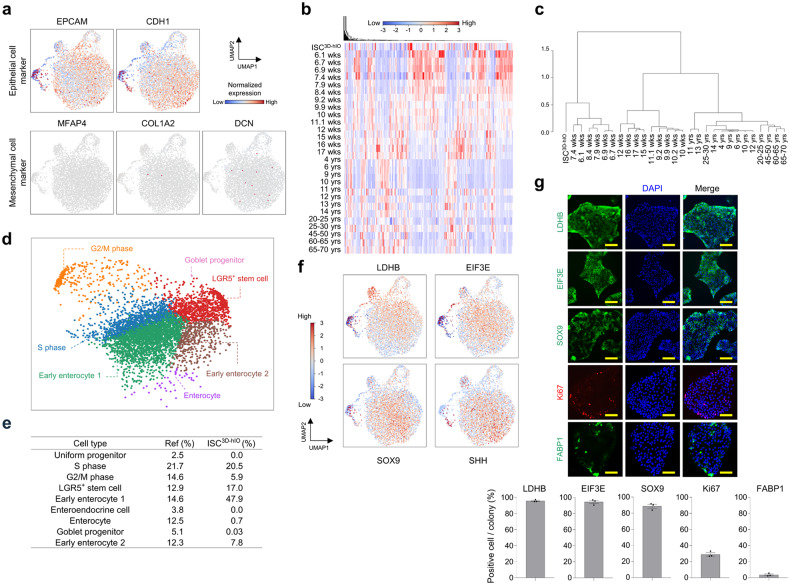
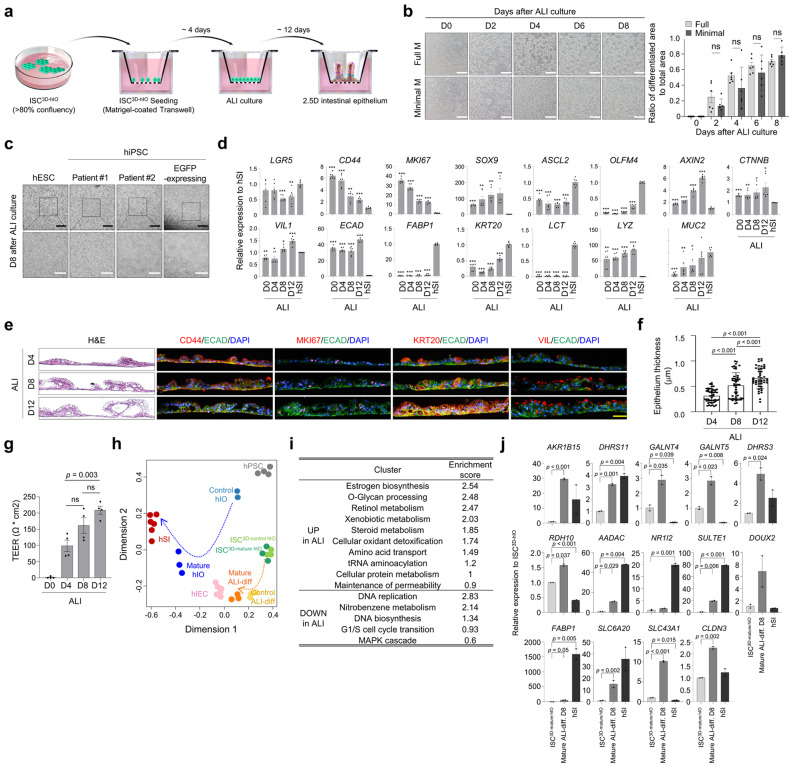
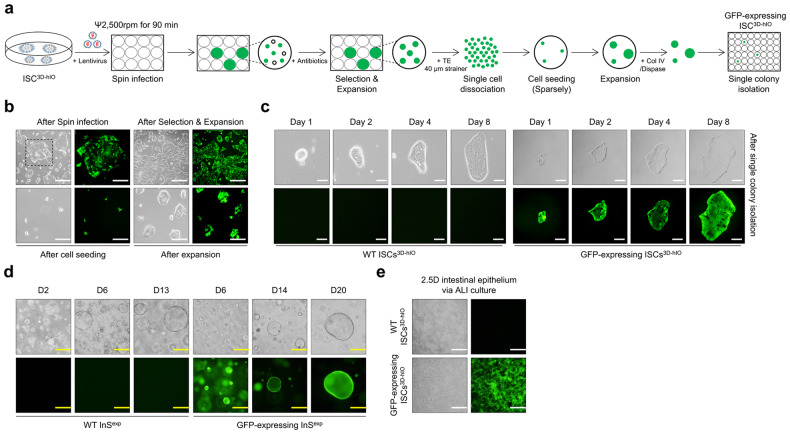
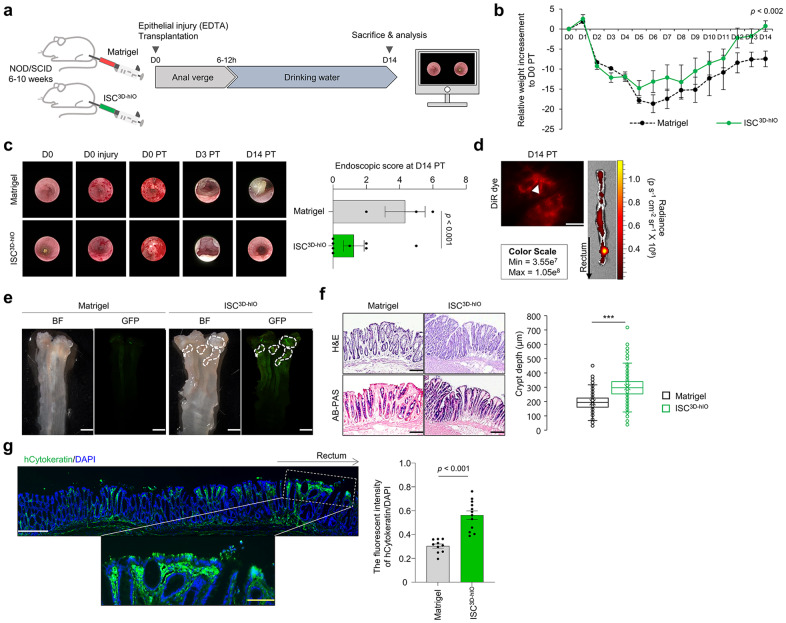
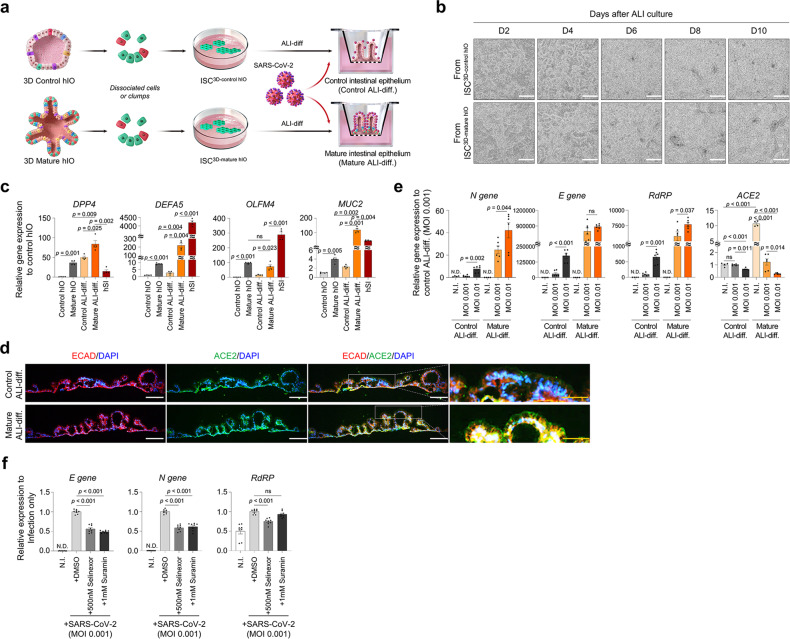
Three-dimensional human intestinal organoids (hIO) are widely used as a platform for biological and biomedical research. However, reproducibility and challenges for large-scale expansion limit their applicability. Here, we establish a human intestinal stem cell (ISC) culture method expanded under feeder-free and fully defined conditions through selective enrichment of ISC populations (ISC3D-hIO) within hIO derived from human pluripotent stem cells. The intrinsic self-organisation property of ISC3D-hIO, combined with air-liquid interface culture in a minimally defined medium, forces ISC3D-hIO to differentiate into the intestinal epithelium with cellular diversity, villus-like structure, and barrier integrity. Notably, ISC3D-hIO is an ideal cell source for gene editing to study ISC biology and transplantation for intestinal diseases. We demonstrate the intestinal epithelium differentiated from ISC3D-hIO as a model system to study severe acute respiratory syndrome coronavirus 2 viral infection. ISC3D-hIO culture technology provides a biological tool for use in regenerative medicine and disease modelling.


Conflict of interest statement

The authors declare no competing interests.

Figures

Fig. 1
Fig. 1. Establishment of 2D ISC3D-hIO culture method.
a Schematic representation of the developed method. b ISC3D-hIO morphologies on the feeder or 1% Matrigel-coated plate at days 1 and 7. ISCs were generated from hiPSC-derived hIOs (n = 3 samples/group). Black scale bar: 200 μm. Yellow scale bar: 50 μm. c Efficiency of cell attachment at P0, P1, and P2, Black scale bar: 200 μm. d Average cell number 1 week after cell seeding; Data represents the mean ± SEM (n = 6 biological samples), and a two-tailed t-test was applied to measure p values between the control (TCPS) and the various coating materials. e Relative expression of stem cell marker genes (LGR5, CD44, SOX9, MKI67, AXIN2, and CTNNB), and differentiated cells (VIL1, ECAD, FABP1, KRT20, LYZ, and MUC2). Data represents the mean ± SEM (n = 4 biological samples), and a two-tailed t-test was applied to measure p values between the control (TCPS) and the various coating materials.
Fig. 2
Fig. 2. Optimisation of ISC3D-hIO culture media.
a Representative images of crystal violet (CV) stained ISC3D-hIO colonies with depletion of single component from growth media and quantification of occupied area by ISC3D-hIO. Black scale bar, 50 mm. Data represent the mean ± SEM (n = 3 biological samples), and a two-tailed t-test was applied to measure p values between the control cells (Full M) and the cells grown in the various conditions. b Representative images of ISC3D-hIO grown in full growth medium (Full M), depletion of RSPO1, EGF, or PGE2, or basal medium (Basal M) (n = 3 samples/group). Black scale bar, 200 μm. White scale bar, 100 μm. c Relative expression of marker genes in ISC3D-hIO grown in Full M, depletion of WNT3A, RSPO1, or WNT3A/RSPO1. Data represent the mean ± SEM (n = 2 biological samples), and a two-tailed t-test was applied to measure p values between the control cells (Full M) and the cells grown in the growth factor depleted conditions. d Immunofluorescence images and quantification analysis in ISC3D-hIO grown in Full M, depletion of WNT3A, RSPO1, or WNT3A/RSPO1. Yellow scale bar: 50 μm. Data represent the mean ± SD (n = 3 biological samples), and a two-tailed t-test was applied to measure p values between the control cells (Full M) and the cells grown in the growth factor depleted conditions. e Live (Calcein-AM)/Dead (EthD-1) analysis of ISC3D-hIO in Full medium or after depletion of EGF, or treatment with PD0325901 at 0, 12, 24, and 48 h, and representative images of ISC3D-hIO grown in Full M, depletion of EGF, treatment with 10 nM PD0325901, or treatment with 100 nM PD0325901. White scale bar: 100 μm. Data represent the mean ± SD (n = 4 biological samples, each with 2–3 technical replicates), and a two-tailed t-test was applied to measure p values. f Representative images of ISC3D-hIO grown in treatment with DMSO, treatment with 250 nM EP2i, treatment with 500 nM EP2i, treatment with 250 nM EP4i, treatment with 500 nM EP4i, or depletion of PGE2 (n = 3 samples/group). White scale bar: 100 μm. g Morphologies of ISC3D-hIO at passages 0, 1, 3, 5, 10, 20, and 30 (n = 3 samples/group). Black scale bar: 200 μm. White scale bar: 100 μm.
Fig. 3
Fig. 3. scRNA-seq analysis for characterising ISC3D-hIO composition.
a Feature plot of epithelial cell markers (EPCAM and CDH1) and mesenchymal cell markers (MFAP4, COL1A2 and DCN). Heatmap (b) and dendrogram (c) depict molecular transition as age increases. d UMAP plot with single cells of ISC3d-hIO coloured by cell types. e List of cell types within ISC3D-hIO and their percentages from scRNA-seq data. f Feature plot of the foetal intestinal stem cell markers (LDHB, EIF3E, SOX9, and SHH). g Immunofluorescence images of foetal intestinal stem cell markers (LDHB, EIF3E, SOX9, and KI67) and enterocyte marker (FABP1). Quantification of LDHB, EIF3E, SOX9, Ki67 and FABP1 positive cells in ISC3D-hIO colonies Data represent the mean ± SD (n = 3 biological samples). Yellow scale bar: 50 μm.
Fig. 4
Fig. 4. Differentiation of ISC3D-hIO into intestinal epithelium via ALI.
a Schematic representation of the differentiation method. b Representative images of 2.5D intestinal epithelium at days 0, 2, 4, 6, and 8 after ALI culture in Full M or the defined Minimal M. White scale bar: 100 μm. Quantification analysis of 2.5D intestinal epithelium in Full M or Minimal M. Data represent the mean ± SD (n = 3 biological samples, each with 2 technical replicates), and a two-tailed t-test was applied to measure p values between the control cells in the Full M and the cells grown in the Minimal M. c 2D intestinal epithelium morphologies derived from hESC and hiPSCs (patient #1, patient #2, and genome edited) at day 8 after ALI culture (n = 3 samples/group). Black scale bar: 200 μm. White scale bar: 100 μm. d Relative expression of stem cell and differentiated cell marker genes in ALI-differentiated cells at days 0, 4, 8, and 12 after air exposure and hSI. Data represent the mean ± SD (n = 3 biological samples, each with 2 technical replicates), and a two-tailed t-test was applied to measure p values between the human intestinal tissue (hSI) and the ALI-differentiated cells. The exact p values represented in the source data. H&E (e, left) and immunofluorescence staining (e, right) of intestinal markers and epithelium thickness at days 4, 8, and 12 after ALI culture. f Yellow scale bar: 100 μm. Data represent the mean ± SD (n = 48 biological samples), and a two-tailed t-test was applied to measure p values among the groups. g TEER values of ALI-differentiated cells at days 0, 4, 8, and 12 after air exposure. Data represent the mean ± SD (n = 4 biological samples), and a two-tailed t-test was applied to measure p values between the control (D0) and days after ALI-differentiation. h MDS plot shows the pairwise distance between samples. Nine homogeneous sample groups were observed: hPSC (grey, n = 4), P0 3D hIO (light blue, n = 2), mature 3D hIO (blue, n = 3), functional hIECs (pink, n = 6), immature ISC3D-hIO (green, n = 3), mature ISC3D-hIO (dark green, n = 3), immature ALI (yellow, n = 3), mature ALI (orange, n = 3), and hSI (red, n = 6). i Enriched functional clusters of biological processes (BP) and enrichment scores encompassing DEGs between ISC3D-hIO and ALI-differentiated cells. j Relative expression of genes up-regulated in ALI-differentiated cells compared to ISC3D-hIO. Data represent the mean ± SEM (n = 2 biological samples), and a two-tailed t-test was applied to measure p values between control cell (ISC3D-hIO) and differentiated cells (Mature ALI-diff. D8 and hSI).
Fig. 5
Fig. 5. Generation of an eGFP-expressing ISC3D-hIO reporter cell line.
a Schematic overview of the methodology. eGFP expression by lentiviral infection is represented by green. b Representative images of ISC3D-hIO after infection, selection & expansion, low-density cell seeding, and expansion to form colonies. White scale bar: 100 μm. Cell growth images of the single colony (c) and 3D expandable intestinal spheres (InSexp) (d) are grown from wild-type or single EGFP-expressing cells (n = 3 samples/group). White scale bar: 250 μm. Yellow scale bar: 50 μm. e 2.5D intestinal epithelium via ALI differentiation (n = 3 samples/group). White scale bar: 100 μm.
Fig. 6
Fig. 6. Xenotransplantation of human ISC3D-hIO into an EDTA-induced epithelial injury mouse model.
a Schematic representation of the transplantation. b Relative weight changes of xenotransplantation for 14 days. Matrigel group (n = 3), ISC3D-hIO group (n = 8). Data represent the mean ± SD, and a two-tailed t-test was applied to measure p values. c Colonoscope observation of the mouse colon at day 0, 3, and 14 post-transplantation (PT), and Endoscopic score of the transplanted mice. Matrigel group (n = 3), ISC3D-hIO group (n = 8), and a two-tailed non-parametric Mann–Whitney U test was applied to measure p values. d The fluorescent image shows the DiR+ grafts 14 days PT (left). White scale bar: 125 μm. IVIS image of the recipient’s colon contains DiR+ grafts 14 days PT (right) (n = 2 samples). e The bright fields of the recipient’s colon and fluorescent images of ISCs3D-ISX-eGFP-hIO grafts on the colon. Matrigel group (n = 2), ISC3D-hIO group (n = 3). White scale bar: 2 mm. f Histological analysis of the xenograft tissues (H&E staining, upper) and histopathology of the xenograft colon (AB-PAS, bottom). Black scale bar, 200 μm. The box and scatterplots of crypt depths of Matrigel (n = 675 crypts from three mice) and ISC3D-hIO (n = 705 crypts from eight mice) transplanted mouse tissues (H&E staining). The quartiles of the boxplot are mean ± SD, and a Welch’s unpaired t-test was applied to measure p values. g Immunofluorescence images of the recipient’s colon with indicated hCytokeratin. White scale bar: 275 μm. Yellow scale bar: 100 μm. Fluorescence intensity of hCytokeratin/DAPI (n of fields = 10 in Matrigel group, n of fields = 12 in ISC3D-hIO group). Data represent the mean ± SEM, a two-tailed t-test was applied to measure p values.
Fig. 7
Fig. 7. SARS-CoV-2 infection on ALI-differentiated cells differentiated from ISC3D-control hIO and ISC3D-mature hIO.
a Schematic representation of in vitro SARS-CoV-2 infection model system. b Representative images of intestinal epithelium differentiated from either ISC3D-control hIO derived from foetal-like control hIO or ISC3D-mature hIO derived from adult-like mature hIO at days 2, 4, 6, 8, and 10 after air exposure. White scale bar: 100 μm. c Relative expression of intestinal maturation marker genes in control hIO (foetal-like), mature hIO (adult-like), ALI-differentiated cells from ISC3D-control hIO (Control ALI-diff.) and ISC3D-mature hIO (Mature ALI-diff.), and human small intestine tissue (hSI). Data represent the mean ± SEM (n = 4 biological samples), and a two-tailed t-test was applied to measure p values for control hIO vs mature hIO, control ALI-diff. vs mature ALI-diff., mature hIO vs mature ALI-diff., and mature ALI-diff. vs hSI. d Immunofluorescence staining of ACE2 in Control ALI-diff. and Mature ALI-diff. White scale bar: 100 μm. Yellow scale bar: 50 μm. e Relative expression of SARS-CoV-2 viral genes (N gene, E gene, RdRP) and ACE2 by viral infection in Control ALI-diff. and Mature ALI-diff. Data represent the mean ± SEM (n = 4 biological samples for N. I., n = 6 biological samples for the other conditions), and a two-tailed t-test was applied to measure p values. f Perturbation effects by selinexor or suramin on the interaction between SARS-CoV-2 and ACE2 in 2.5D intestinal epithelium. The data represent the mean ± SD (n = 4 biological samples, each with 2 technical replicates), and a two-tailed t-test was applied to measure p values between control cell (DMSO) and the cells treated with chemicals.

Similar articles

Cited by

References

    1. Dutta D, Heo I, Clevers H. Disease modeling in stem cell-derived 3D organoid systems. Trends Mol. Med. 2017;23:393–410. doi: 10.1016/j.molmed.2017.02.007. - DOI - PubMed
    1. McCauley HA, Wells JM. Pluripotent stem cell-derived organoids: using principles of developmental biology to grow human tissues in a dish. Development. 2017;144:958–962. doi: 10.1242/dev.140731. - DOI - PMC - PubMed
    1. Fatehullah A, Tan SH, Barker N. Organoids as an in vitro model of human development and disease. Nat. Cell Biol. 2016;18:246–254. doi: 10.1038/ncb3312. - DOI - PubMed
    1. Ranga A, Gjorevski N, Lutolf MP. Drug discovery through stem cell-based organoid models. Adv. Drug Deliv. Rev. 2014;69-70:19–28. doi: 10.1016/j.addr.2014.02.006. - DOI - PubMed
    1. Brandenberg N, et al. High-throughput automated organoid culture via stem-cell aggregation in microcavity arrays. Nat. Biomed. Eng. 2020;4:863–874. doi: 10.1038/s41551-020-0565-2. - DOI - PubMed