. 2024 Jan 27;15(1):796.
doi: 10.1038/s41467-024-45034-3.

Sexual dimorphism in melanocyte stem cell behavior reveals combinational therapeutic strategies for cutaneous repigmentation

Affiliations

Sexual dimorphism in melanocyte stem cell behavior reveals combinational therapeutic strategies for cutaneous repigmentation

Luye An et al. Nat Commun. .

Abstract

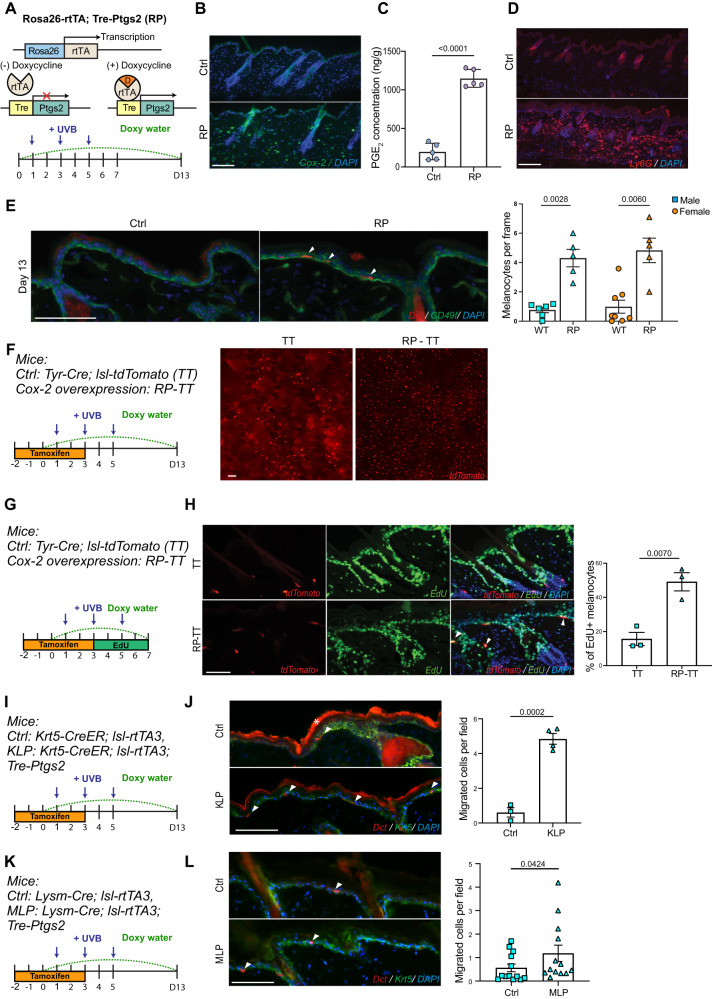
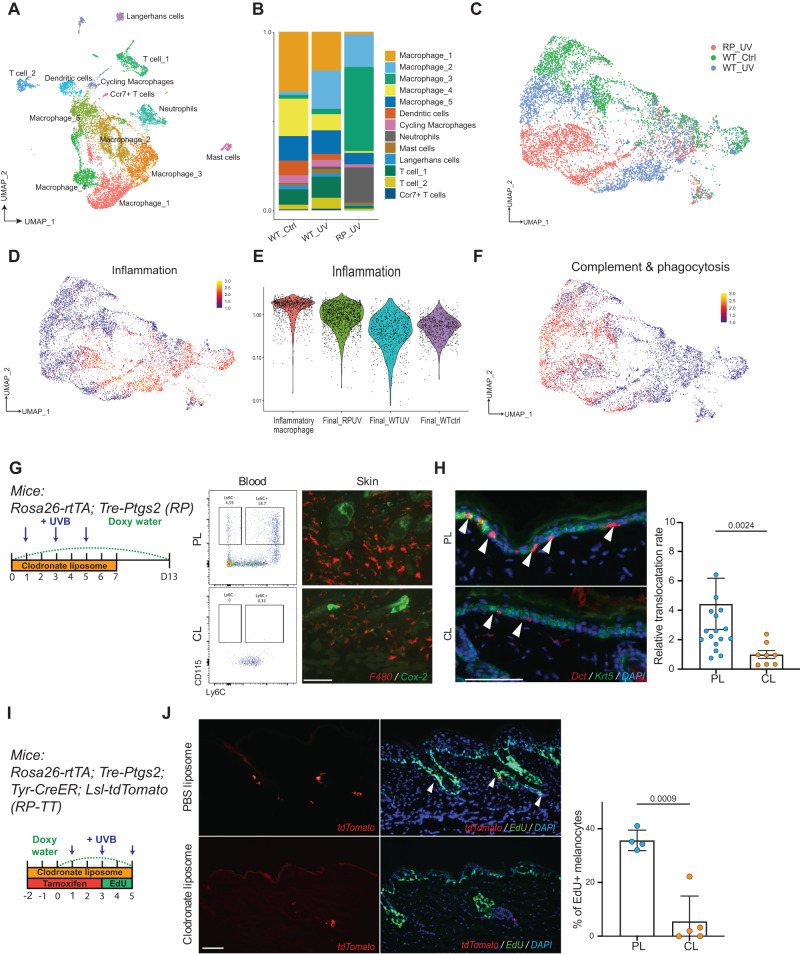
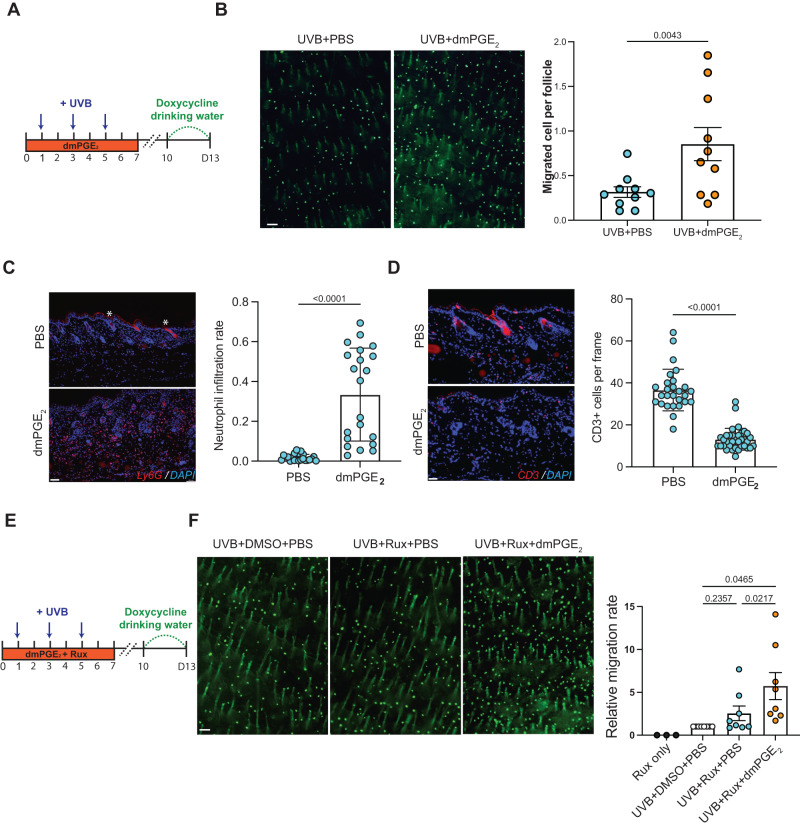
Vitiligo is an autoimmune skin disease caused by cutaneous melanocyte loss. Although phototherapy and T cell suppression therapy have been widely used to induce epidermal re-pigmentation, full pigmentation recovery is rarely achieved due to our poor understanding of the cellular and molecular mechanisms governing this process. Here, we identify unique melanocyte stem cell (McSC) epidermal migration rates between male and female mice, which is due to sexually dimorphic cutaneous inflammatory responses generated by ultra-violet B exposure. Using genetically engineered mouse models, and unbiased bulk and single-cell mRNA sequencing approaches, we determine that manipulating the inflammatory response through cyclooxygenase and its downstream prostaglandin product regulates McSC proliferation and epidermal migration in response to UVB exposure. Furthermore, we demonstrate that a combinational therapy that manipulates both macrophages and T cells (or innate and adaptive immunity) significantly promotes epidermal melanocyte re-population. With these findings, we propose a novel therapeutic strategy for repigmentation in patients with depigmentation conditions such as vitiligo.


Conflict of interest statement

The corresponding author declares the following competing interests: Patent applicant: Cornell University. Name of the inventor: Andrew White. Application number: 63/496,967. Status of application: Pending. Specific aspect of manuscript covered in patent application: Figure 7, use of pge2 analog with uvb and uvb+ruxolitinib. The remaining authors declare no competing interests.

Figures

Fig. 1
Fig. 1. Tracking recruitment of hair follicle McSCs to the epidermis by UVB on unpigmented mouse dorsal skin.
A Schematic diagram of Dct-rtTA; Tre-H2B-GFP (DG) mouse model (top), UVB irradiation timeline (bottom). B Representative images of longitudinal skin sections at different time points following UVB irradiation. Arrowheads denote McSCs, and dashed lines indicate the boundary between the epidermis and dermis. n = 3 males for each time point. C Tyr-CreER; Rosa26-lsl-tdTomato (TT) mouse model and imaging timeline. D Representative 3D rendered whole mount live skin image (left). Top-down (X–Y) perspective of raw images with the horizontal section view (X-Z) taken on the same area of skin at day 7 and day 8 (right). Red signal indicates tdTomato fluorescence (melanocytes); green signal indicates collagen SHG autofluorescence (skin tissue). 1–3 labels the locations of the same group of hair follicles. Enlarged images are the vertical view (Y-Z) of the area in the center of yellow cross. n = 3 males for each time point. E Schematic diagram of a dorsal-ventral view of whole mount dorsal skin and enlarged representative images (left). Representative images of whole mount dorsal skin images without UVB irradiation (top right) and with UVB irradiation (bottom right). As shown, without UVB irradiation, no H2B-GFP+ McSCs located in the hair bulge were detectable, and only epidermal H2B-GFP+ melanocytes were visible. F Schematic diagram of hair follicle and McSC migration (left), and representative images of non-UVB and UVB-irradiated skin with longitudinal sections (middle) and transverse sections at the skin surface (10 µm), middle (60 µm) and hair bulge (120 µm) depth. Keratin-14 (K14) labels keratinocytes in the interfollicular epidermis and hair follicles. Arrowheads indicate H2B-Gfp+ melanocytes. Dashed lines indicate the hair follicles. n = 3 males for no UVB and 13dp UVB group. Scale Bar: 100 µm. Mouse model diagrams were created with BioRender.com (A, C).
Fig. 2
Fig. 2. Male mice exhibit increased McSC migration due to heightened skin inflammation.
A Representative images of UVB-irradiated male and female skin 13 days following initial exposure (left) (n = 5 mice for males; n = 5 mice for females), and quantification (right). Quantification was performed by averaging the migrated melanocytes from at least 6000 hair follicles in each mouse. B Volcano plot of gene expression level changes between no-UVB and 6 h after third UVB (day 5) in male and female mice. Threshold: |log2FoldChanges| > 1, −log10 (pvalue) > 2. n = 4 male mice for UVB, n = 4 male mice for no-UVB, n = 4 female mice for UVB, n = 4 female mice for no-UVB. C Venn diagram showing the differentially upregulated genes following the threshold denoted in (B), in males and females. D Expression level of all differentially expressed genes in male and female samples. X and Y axes indicate the gene’s lfc in females and males. E Selected Gene Ontology terms of GSEA analysis by comparing fold changes in relative gene expression in no-UVB control males and females. NES Normalized Enrichment Score. F Flow cytometry plots show CD11b+ Ly6G+ neutrophils, F4/80+ Ly6C macrophages, and F4/80- Ly6C+ infiltrating monocytes from irradiated mouse skin collected on day 3. G Quantification of each cell type as a percentage of total CD45+ immune cells. n = 4 for each gender. H Experimental timeline for UVB irradiation under Imiquimod treatment. I Representative McSC migration images collected at 13 days following initial UVB exposure under control (Vani, Vanicream) and Imiquimod (IMQ) treatment (left), and quantification on both male and female mice (right). At least 6000 follicles per mouse were quantified. n = 4 for Vani-treated males, n = 4 for IMQ-treated males; n = 4 for Vani-treated females, n = 5 for IMQ-treated females. Scale bar: 100 µm. Statistics: significance calculated by student t test, two-tails with Welch’s correction. Error bar: SEM (A, G, and I).
Fig. 3
Fig. 3. Single-cell profiling reveals a transition to macrophages with a pro-inflammatory signature after UVB irradiation.
A UMAP of single cell clusters derived from WT male no-UVB (WT_Ctrl, n = 1) and WT male UVB day 5 (WT_UV, n = 1). B UMAP of all immune cells subclustered from cells shown in (A). C Cell composition of all immune cell types in WT_Ctrl and WT_UV. D Visualization of marker gene expression in macrophage subpopulations. E Pseudotime analysis of macrophage progression using Monocle 3. Starting timepoint is based on the expression of activation stage marker genes in (D). The inflammatory path and phagocytic path were determined based on the expression pattern of Pro-inflammation and Complement & Phagocytosis marker genes in (D). F UMAP of immune cells based on sample. G Volcano plot of expressed genes in all macrophages. Pro-inflammatory cytokine genes are highlighted. H Violin plots showing Ccl2 and Cxcl2 mRNA expression levels in each immune subtype in WT control and WT UVB samples. I Timeline of diphtheria toxin (DT) administration and melanocyte migration assay using Lysm-Cre; Rosa26-lsl-iDtr mice. J Representative images of Dct staining on DMSO and DT-treated mice (left), and melanocyte migration quantification (right). n = 5 for DMSO and DT group. Arrowheads mark the migrated melanocytes. * marks autofluorescence from the stratum corneum. As the control group, Lysm-Cre; Rosa26-lsl-iDtr mice were treated with DMSO. Statistics: Welch’s t test. Error bar: SEM (J). Scale bar: 100 µm.
Fig. 4
Fig. 4. Enhanced prostaglandin signaling in males regulates McSC migration.
A Volcano plot of differentially upregulated genes in female (left) and male (right) mice. Genes that belong to Acute Inflammatory Response are highlighted. B Expression level of Ptgs2 in all immune cell subclusters described in Fig. 3B. C Log-fold gene expression changes in cyclooxygenases and select prostaglandin synthesis factors following UVB irradiation in males and females, from bulk mRNA sequencing data. *, **, *** indicates p.adjusts (apeglm shrinkage) are lower than 0.05, 0.01, 0.001, respectively. D Antibody staining for Ptges2, Ptges3, Ptger2, co-stained with F4/80 and DAPI on control skin collected at day 3. Co-localizations are indicated by circle. n = 3 males. E Schematic of Rosa26-CreER; Ptgs2f/f mouse model, created with BioRender.com. F Representative images of McSC migration and quantification from Cox-2 global knockout mice compared to controls. n = 10 male mice for control (Ctrl), n = 14 male for knockout (KO). Ptgs2f/+ or Ptgs2+/+ were used as controls. Statistics: significance calculated by Welch’s t test. Error bar: SEM. Scale bar: 100 µm.
Fig. 5
Fig. 5. Increased cyclooxygenase expression escalates McSC proliferation and epidermal repopulation.
A Schematic of Rosa26-rtTA; Tre-Ptgs2 (RP) mouse model (top), created with BioRender.com. Doxycycline administration and UVB irradiation timeline (bottom). B Representative Cox-2 staining on Ctrl and RP skin on day 2. n = 3 male Ctrl, 3 male RP, 3 female Ctrl, 3 female RP. C ELISA quantification of PGE2 extracted from the UVB irradiated skin area, collected at day 5. PGE2 level was normalized by the tissue weight. n = 5 mice for Ctrl and n = 5 mice for RP. D Representative Ly6G staining on Ctrl and RP skin collected on day 5. n = 3 mice for Ctrl and n = 3 mice for RP. E Representative images of Dct staining from Ctrl and RP skin collected on day 13 (left) and quantification (right). CD49f staining indicates the boundary of epidermis and dermis (left). Ctrl: 6m,8f; RP:5 m,5f. Migration rate was calculated by the number of epidermal melanocytes per frame. F Schematic of McSC labeling and doxycycline induction timeline in RP mouse model crossed with Tyr-CreER, lsl-tdTomato mice (TT, left). Representative images of Ctrl and RP whole-mount skin collected on day 13 (right). Each tdTomato-labeled red cell indicates one migrated melanocyte. n = 4 (2 TT, 2 RP-TT) (G) Timeline of melanocyte proliferation assay on TT and RP-TT mice. EdU was provided by I.P. injection every 6hs from day 3 until day 5. H Representative images of tdTomato melanocytes co-labeled with EdU by Click-iT reaction (left), and quantification (right). Arrows indicate the colocalized cells. Male: n = 3 mice for Ctrl, 3 mice for RP. I, K Timeline of Cox2 overexpression induction and melanocyte migration assay in KLP and MLP mice. J, L Representative images of migrated melanocytes and quantification. Arrowheads mark epidermal melanocytes. * marks autofluorescence from the stratum corneum. Male: n = 3 for Ctrl, n = 4 for KLP. Male: n = 8 pairs; Female: n = 5 pairs for MLP. Rosa26-rtTA allele-only or Tre-Ptges2 allele-only were used as controls. Statistics: each individual dot in all panels indicates the averaged quantification from one mouse (C, E, H, J), with significance calculated by Welch’s t test. In (L), significance was calculated by paired t-test. Error bar: SEM. Scale bar: 100 µm.
Fig. 6
Fig. 6. A distinct hybrid macrophage population is found in Cox-2 overexpression mice.
A UMAP of immune cell clusters from WT_Ctrl, WT_UV, and RP_UV. WT_Ctrl and WT_UV were the same dataset from Fig. 3. RP_UV sample was from an RP male mouse collected on day 5, the same timepoint as WT_UV. B Barplot showing the composition of each cell cluster within the three samples. C UMAP of macrophage subclusters isolated from all three samples. Macrophages were subclustered from cluster Macrophage_1–4 and Proliferative macrophages. D Visualization of the Inflammation gene set expression in macrophage subclusters. E Violin plot showing expression of the Inflammation gene set in Inflammatory macrophage, Final_RPUV, Final_WTUV, Final_WTCtrl subclusters. F Visualization of Complement & Phagocytosis gene set expression in macrophage subclusters. G Schematic timeline for macrophage depletion using clodronate liposomes (CL), and control PBS liposomes (PL). Monocyte depletion in the circulation was validated by flow cytometry. Blood monocytes were identified as CD45 + CD115+. Ly6C was used to classify infiltrating monocytes (Ly6Chi). Reduced skin macrophage infiltration by CL depletion was validated by F4/80 staining on sectioned skin collected on day 5. H Final melanocyte migrations were quantified by Dct staining on sectioned skin collected on day 13. Migrations were normalized based on individual level of Cox-2 expression in each mouse. n = 8 mice for CL (4 male, 4 female), n = 17 for PL (9 male, 8 female). Uneven number due to the poor animal survival under CL treatment. I Schematic of melanocyte proliferation assay on RP-TT mice under macrophage depletion. Doxycycline, tamoxifen, and PL/CL treatments follow the timeline. J Representative images of tdTomato co-labeling with EdU staining (left), and quantification (right). n = 5 mice for CL, n = 4 mice for PL. Scale bar: 100 µm. Statistics: Mann-Whitney t test (H), Welch’s t test (J). Error bar: SEM. Each individual dot indicates the averaged quantification from one mouse.
Fig. 7
Fig. 7. Both dmPGE2 supplementation and dmPGE2 with Jak signaling inhibition promote UVB-induced McSC epidermal repopulation.
A Schematic timeline of dmPGE2 treatment by intradermal injection and UVB irradiation. B Representative images of whole mount DG skin collected at day 13 (left), and migration quantification (right). Migrated melanocytes from at least 6000 follicles were quantified in each mouse. n = 8 pairs (4 male pairs, 4 female pairs). Paired comparisons were performed by using littermates to minimize the effect of genetic variance and to minimize any UVB light variance. C, D Representative images of neutrophil infiltration (Ly6G+) and T cell infiltration (CD3+) in UVB irradiated PBS-treated skin collected on day 4. Red staining in the PBS panel is background in the stratum corneum and hair shaft (labeled by *). Neutrophil infiltration rate was quantified by the Ly6G+ staining area over DAPI staining area, and CD3 + T cell infiltration was quantified by the number of T cells per image. Each individual dot indicates one image. Ly6G: n = 22 images for PBS, n = 21 images for dmPGE2; CD3: n = 27 images for PBS, n = 35 images for dmPGE2. Each group contains n = 3 male mice. E Schematic of dmPGE2 and ruxolitinib administration with UVB irradiation. F Representative whole mount images of DG dorsal skin collected on day 13 (left), and quantification. For each group of experiments, three littermates of the same gender were used for UVB-only; UVB+ruxolitinib; and UVB+ruxolitinib+dmPGE2 treatments. To normalize the variance of migration rate due to different experiment date and gender, the migration rate of UVB+ruxolitinib+PBS and UVB+ruxolitinib+dmPGE2 animals were normalized by the migration rate in UVB + DMSO + PBS control individuals within each group. Three ruxolitinib-treated non-UVB irradiated males were used to show no migration without UVB. Scale bar: 100 µm. Statistics: Paired-t.test (B, F), Welch’s t-test (C, D). Error bar: SEM.

Update of

Similar articles

Cited by

References

    1. Bergqvist C, Ezzedine K. Vitiligo: a review. Dermatology. 2020;236:571–592. doi: 10.1159/000506103. - DOI - PubMed
    1. Rodrigues M, et al. New discoveries in the pathogenesis and classification of vitiligo. J. Am. Acad. Dermatol. 2017;77:1–13. doi: 10.1016/j.jaad.2016.10.048. - DOI - PubMed
    1. Ezzedine K, Eleftheriadou V, Whitton M, van Geel N. Vitiligo. Lancet. 2015;386:74–84. doi: 10.1016/S0140-6736(14)60763-7. - DOI - PubMed
    1. Ezzedine K, et al. Psychosocial effects of vitiligo: a systematic literature review. Am. J. Clin. Dermatol. 2021;22:757–774. doi: 10.1007/s40257-021-00631-6. - DOI - PMC - PubMed
    1. Rashighi M, Harris JE. Vitiligo pathogenesis and emerging treatments. Dermatol Clin. 2017;35:257–265. doi: 10.1016/j.det.2016.11.014. - DOI - PMC - PubMed

Substances