. 2024 Jan 27;15(1):818.
doi: 10.1038/s41467-024-45097-2.

Reconstitution of human PDAC using primary cells reveals oncogenic transcriptomic features at tumor onset

Affiliations

Reconstitution of human PDAC using primary cells reveals oncogenic transcriptomic features at tumor onset

Yi Xu et al. Nat Commun. .

Abstract

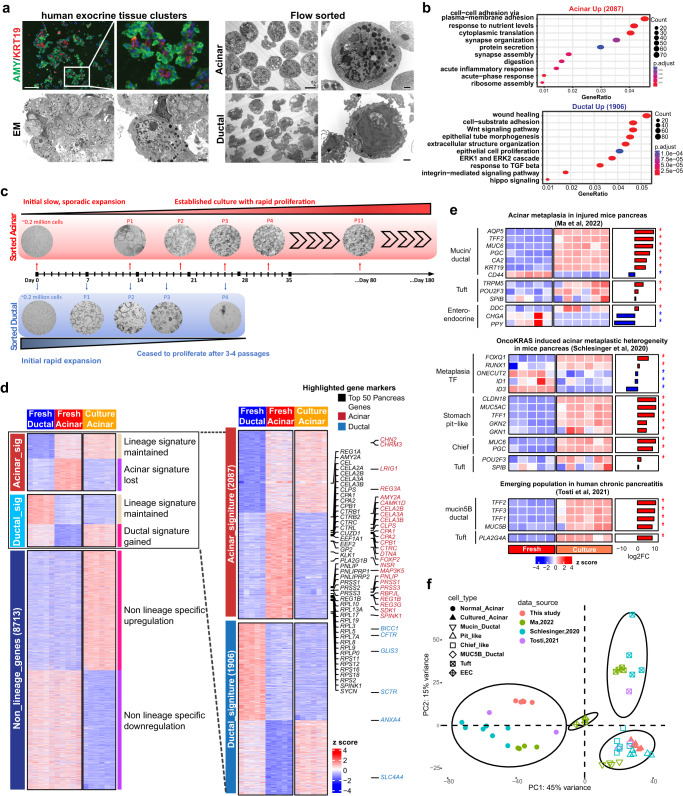
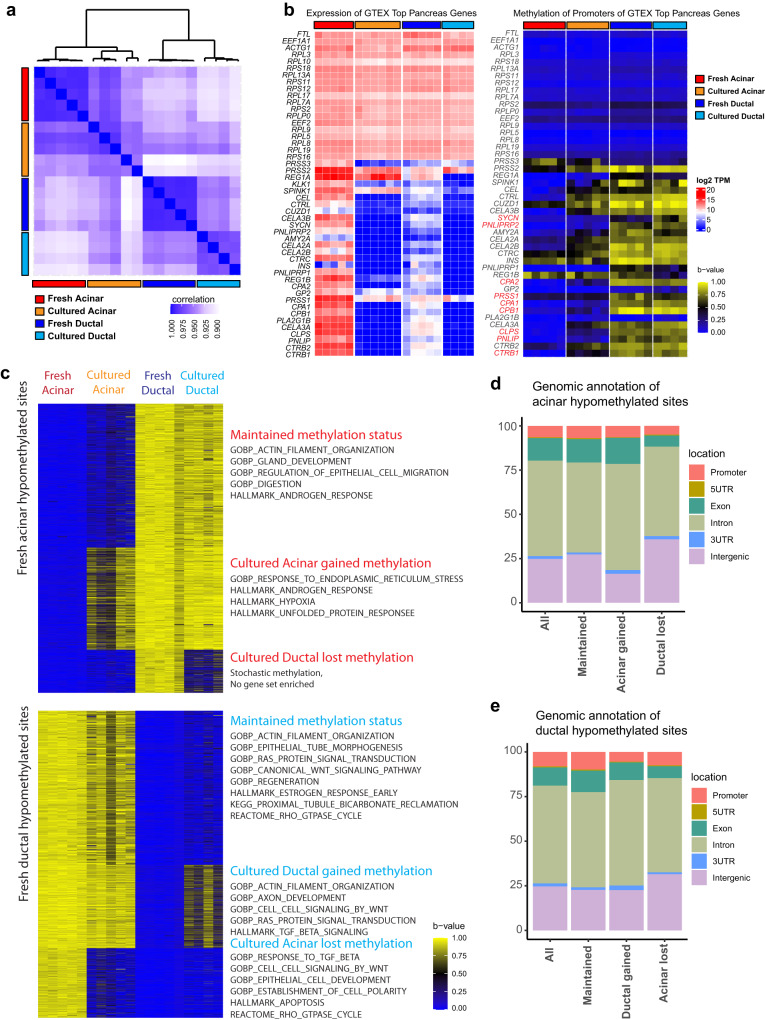
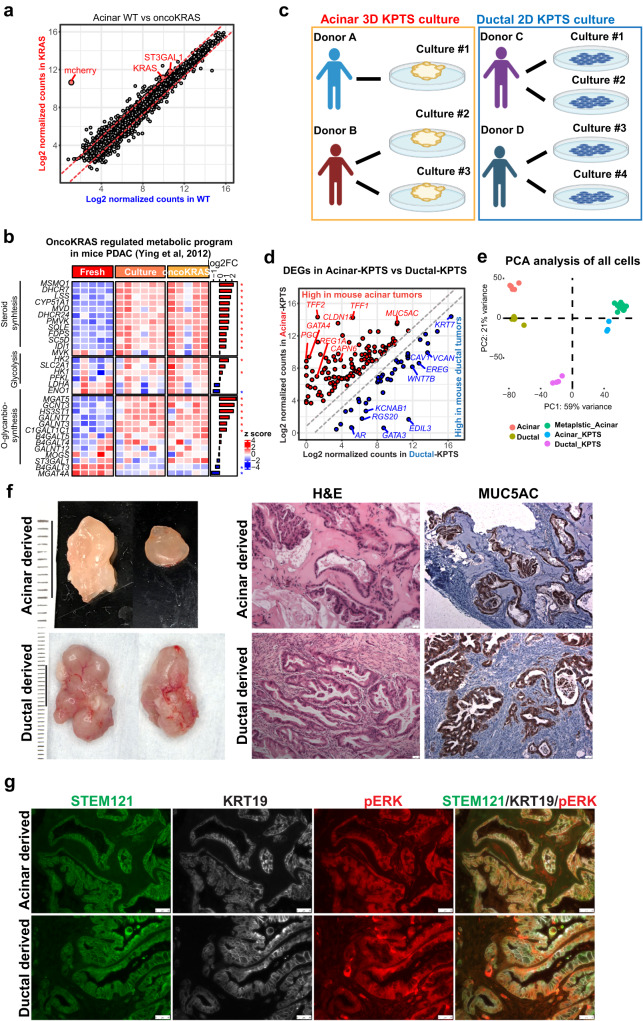
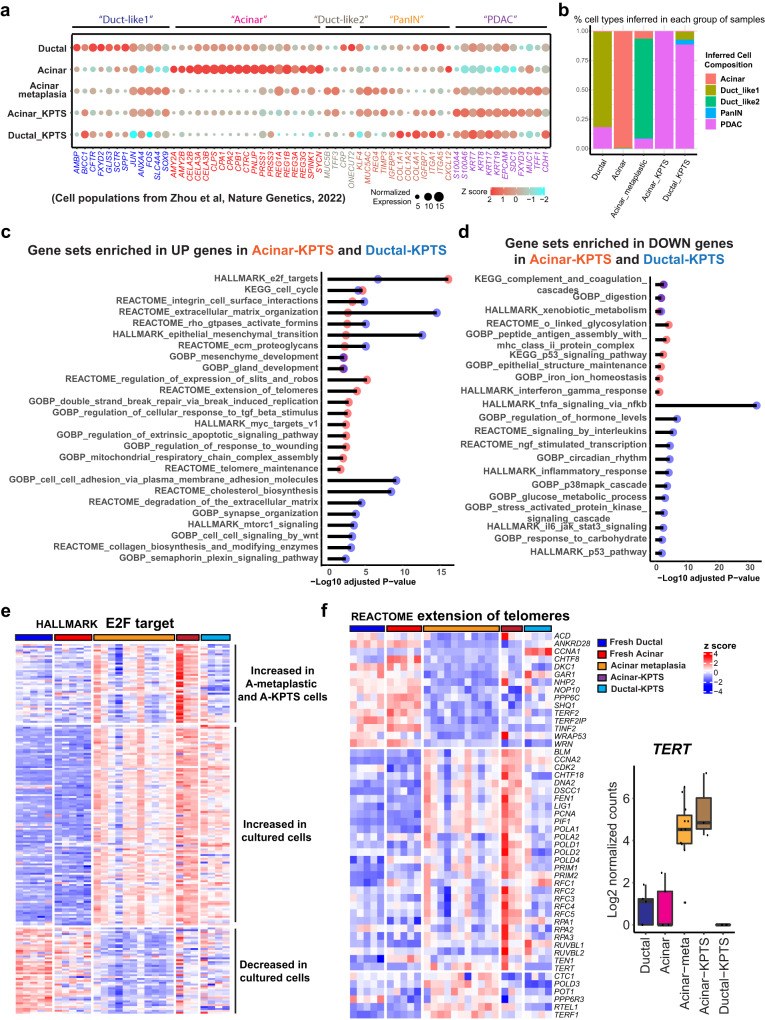
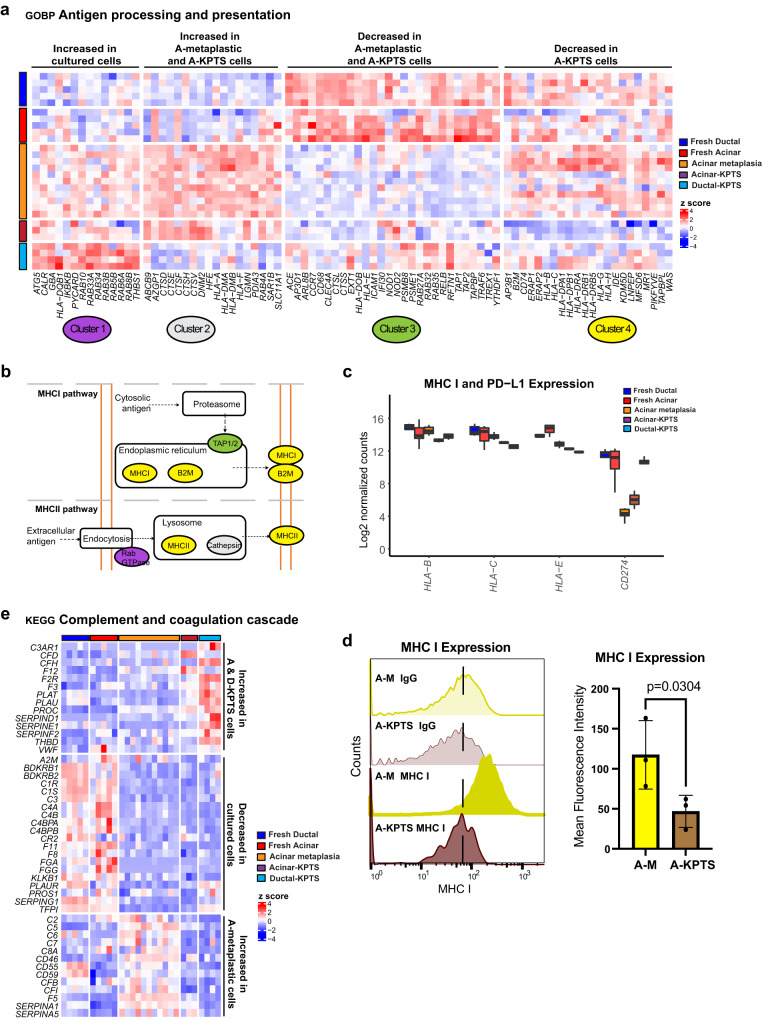
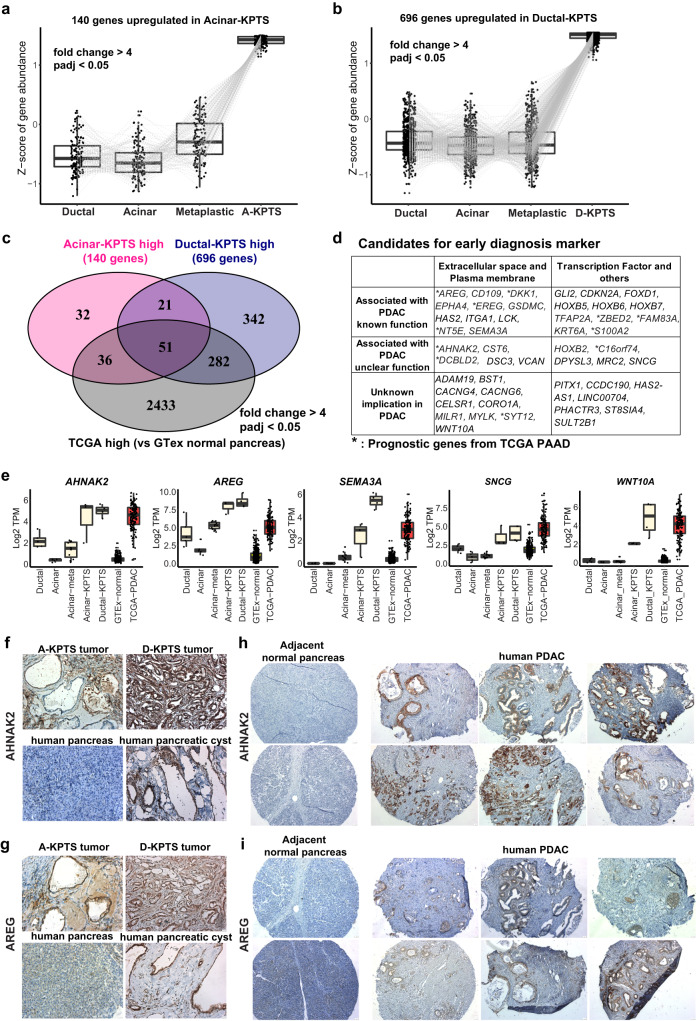
Animal studies have demonstrated the ability of pancreatic acinar cells to transform into pancreatic ductal adenocarcinoma (PDAC). However, the tumorigenic potential of human pancreatic acinar cells remains under debate. To address this gap in knowledge, we expand sorted human acinar cells as 3D organoids and genetically modify them through introduction of common PDAC mutations. The acinar organoids undergo dramatic transcriptional alterations but maintain a recognizable DNA methylation signature. The transcriptomes of acinar organoids are similar to those of disease-specific cell populations. Oncogenic KRAS alone do not transform acinar organoids. However, acinar organoids can form PDAC in vivo after acquiring the four most common driver mutations of this disease. Similarly, sorted ductal cells carrying these genetic mutations can also form PDAC, thus experimentally proving that PDACs can originate from both human acinar and ductal cells. RNA-seq analysis reveal the transcriptional shift from normal acinar cells towards PDACs with enhanced proliferation, metabolic rewiring, down-regulation of MHC molecules, and alterations in the coagulation and complement cascade. By comparing PDAC-like cells with normal pancreas and PDAC samples, we identify a group of genes with elevated expression during early transformation which represent potential early diagnostic biomarkers.


Conflict of interest statement

The authors declared no competing interests.

Figures

Fig. 1
Fig. 1. Primary human 3D acinar culture associated with metaplastic features.
a Left: Immunofluorescence staining of Amylase and KRT19 (n = 6 fields of views, scale bar = 100 µm), and electron microscopy images of islet-depleted human pancreatic exocrine tissue (n = 8 fields of views, scale bar = 2 µm). Right: Electron microscopy images of the flow-sorted acinar and ductal cells (n = 4 fields of views for each lineage, scale bar = 6 µm, for enlarged images scale bar = 1 µm). b Gene ontology analysis of the differentially expressed genes in sorted acinar (n = 5) and ductal cells (n = 5). The analysis was performed using the clusterProfiler 4.4.4 package in R software with default settings. A significant enrichment was considered with multiple-test adjusted p value < 0.05. c Bright field images and schematic illustration of established long-term 3D acinar culture. d Expression heatmap of all differentially expressed genes across 3 groups of samples including fresh acinar cells (n = 5), fresh ductal cells (n = 5), and cultured acinar organoids (n = 6). For three-group comparison, the DEGs were identified by likelihood ratio test using DESeq2 1.36.0 package in R software, and defined as Benjamin-Hochberg adjusted p value < 0.05. For two-group comparison (fresh acinar vs fresh ductal), DEGs were identified by negative binomial Wald test using DESeq2 with fold change >2 and adjusted p value < 0.05. The genes were manually grouped into 3 clusters according to their expression patterns in sorted fresh cells. Within each of the 3 gene clusters, K means clustering further identified 2 subgroups of genes with distinct expression patterns. Selected known pancreatic signature genes were annotated with colored text. e Expression heatmap and log2 fold changes of listed acinar metaplasia genes in cultured vs fresh acinar cells. The listed genes were curated from indicated references. To compare gene expression between cultured vs fresh acinar cells, negative binomial Wald test of the 2 groups of samples was performed using DESeq2 in R software. Asterisk indicates adj.p < 0.05. f Principal component analysis of the gene expression in fresh and cultured acinar samples generated in present work as well as normal and metaplastic acinar populations from referenced work shown in (e). To compare our bulk RNA seq samples with the referenced scRNA-seq samples, a pseudo-bulk RNA seq profile was generated for each cell population in referenced scRNA-seq dataset by aggregating the gene counts of all cells in a given cell population.
Fig. 2
Fig. 2. Verification of cultured cell identity by DNA methylation status.
a Correlation matrix of DNA methylation profiles of fresh acinar (n = 5), cultured acinar (n = 5), fresh ductal (n = 5) and cultured ductal cells (n = 4) by all surveyed methylation sites. b Expression heatmap (left) and DNA methylation status (right) of the promoters of the top genes expressed in the pancreas according to the GTEx database, in fresh and cultured cells of each lineage. c DNA methylation status in fresh and cultured cells of the mostly highly acinar hypomethylated sites (top, beta-value difference >0.8) and ductal hypomethylated sites (bottom). K means clustering identified 3 subgroups of sites with distinct methylation pattern across all groups of samples. Overrepresentation analysis for genes associated with each subgroup of sites was performed, with selected enriched gene sets annotated alongside their corresponding clusters. d Distribution of each subgroup of sites in (c, top) with reference to proximal genomic features. e Distribution of each subgroup of sites in (c, bottom) with reference to proximal genomic features.
Fig. 3
Fig. 3. Genetically engineering human primary acinar and ductal cells to form PDAC.
a Scatter plot of normalized gene expression in wild type and oncogenic KRAS expressing acinar organoids. The two annotated genes were the only significantly differentially expressed genes between two groups (fold change >2, adj.p < 0.05, by negative binomial Wald test using DESeq2 1.36.0 in R software). mCherry was included in the oncogenic KRAS expressing vector. b Expression heatmap of listed genes in Acinar-derived fresh, cultured wild type, and cultured KRAS cells. The genes were curated in the indicated reference and were involved in KRAS mediated PDAC reprograming in mice. The side bar represents log2 fold change between cultured wild type vs fresh acinar cells (by negative binomial Wald test using DESeq2 in R software). Asterisk indicates adj.p < 0.05. c Schematic demonstration of establishing acinar-KPTS 3D culture and ductal-KPTS 2D culture. d Normalized expression of differentially expressed genes between acinar-KPTS and ductal-KPTS cells (fold change >2, adj.p < 0.05, by negative binomial Wald test using DESeq2 in R software), which were also identified in mice acinar tumors versus ductal tumors. e PCA analysis of gene expression in all fresh, cultured and genetically modified acinar and ductal samples generated in the present work. f Left: representative photos of xenograft tumors derived from engineered acinar (n = 15) and ductal (n = 30) cultures. Right: H&E and MUC5AC IHC staining of xenograft tumors. Each staining was performed in at least 3 tumor sections with 8 fields of views for each. Scale bar: 50 µm. g Immunofluorescence staining of human specific STEM121, KRT19 and pERK of acinar-derived and ductal-derived tumor sections. The staining was performed in 6 independent tumor tissues with 3 sections for each. Scale bar: 50 µm.
Fig. 4
Fig. 4. Transcriptomic reprograming in oncogenic cells derived from acinar and ductal lineages.
a Expression of indicated cell type signature genes (columns, identified from indicated reference) in our fresh, metaplastic, and KPTS cells (rows). The dot size is proportional to the normalized read counts, the color represents z score of gene expression. b Bar plot of inferred cell type composition in our samples using treatment naive human PDAC scRNA seq samples (described in the indicated work as shown in a) as a reference. The bulk RNA sample deconvolution was performed by using MuSiC method. c Overrepresentation analysis for upregulated genes in Acinar-KPTS cells (vs Acinar-metaplastic cells) and in Ductal-KPTS cells (vs fresh ductal cells). Overrepresentation analysis was performed using the clusterProfiler 4.4.4 package in R software with default settings. A significant enrichment was considered with multiple-test adjusted p value < 0.05. d Overrepresentation analysis for downregulated genes in Acinar-KPTS cells (vs Acinar-metaplastic cells) and in Ductal-KPTS cells (vs fresh ductal cells). The analysis was performed using the clusterProfiler 4.4.4 package. A significant enrichment was considered with multiple-test adjusted p value < 0.05. e Expression heatmap of HALLMARK E2F target genes in fresh, metaplastic, and KPTS cells. K means clustering was performed to identify different expression patterns across all groups of samples. f Left: Expression heatmap of genes in the REACTOME extension of telomeres gene set in fresh, metaplastic, and KPTS cells. Right: Boxplot of TERT expression in all groups of samples. The middle line of box represents the median value, the bounds of box represent the IQR, and the whiskers extend to 1.5 × IQR. Fresh ductal n = 5, fresh acinar n = 5, acinar-metaplastic n = 11, acinar-KPTS n = 3, ductal-KPTS n = 4.
Fig. 5
Fig. 5. Intrinsic alteration of immune program in oncogenic acinar and ductal cells.
a Expression heatmap of genes in the GOBP antigen processing and presentation gene set in fresh, metaplastic, and KPTS cells. K means clustering was performed to identify different expression patterns across all groups of samples. b Schematic illustration of key gene changes in antigen processing and presentation pathways in cultured acinar and ductal cells. c Boxplot of RNA expression of MHC class I and PD-L1 (CD274) genes in all groups of samples. The middle line of box represents the median value, the bounds of box represent the IQR, and the whiskers extend to 1.5 × IQR. Fresh ductal n = 5, fresh acinar n = 5, acinar-metaplastic n = 11, acinar-KPTS n = 3, ductal-KPTS n = 4. d Left: representative flow cytometry analysis of MHC I molecule and mouse IgG isotype control from 3 independent paired metaplastic and KPTS acinar organoids. Right: quantification of MHC I mean fluorescence from 3 independent paired metaplastic and KPTS samples. The fluorescence intensity of MHC I in each sample was adjusted by subtracting the intensity of corresponding isotype control, before analyzed by two-tailed Student’s t test. Error bar represents standard deviation. e Expression heatmap of genes in the KEGG complement and coagulation cascade gene set in fresh, metaplastic, and KPTS cells.
Fig. 6
Fig. 6. Lineage-specific early PDAC model reveals candidates for diagnostic markers.
a Expression of 140 genes which were significantly overexpressed in acinar-KPTS cells compared with fresh ductal, fresh acinar, and acinar metaplastic cells (fold change >4, adj. p < 0.05, by negative binomial Wald test using DESeq2 1.36.0 in R software). The middle line of box represents the median value, the bounds of box represent the IQR, and the whiskers extend to 1.5 × IQR. b Expression of 696 genes which were significantly overexpressed in ductal-KPTS cells compared with fresh ductal, fresh acinar, and acinar metaplastic cells (fold change >4, adj. p < 0.05, by negative binomial Wald test using DESeq2). The middle line of box represents the median value, the bounds of box represent the IQR, and the whiskers extend to 1.5 × IQR. c Venn diagram of the intersections of 140 acinar-KPTS high genes, 696 ductal-KPTS high genes, and 2805 TCGA high genes. The 2805 TCGA high genes were identified by comparing TCGA PDAC samples with the GTEx normal pancreas dataset (fold change >4, adj. p < 0.05, by negative binomial Wald test using DESeq2). d Annotation of 51 overlapped genes identified in (c). e Expression of selected genes in our samples (fresh ductal n = 5, fresh acinar n = 5, acinar-metaplastic n = 11, acinar-KPTS n = 3, ductal-KPTS n = 4) as well as GTEx pancreas (n = 328) and TCGA PDAC samples (n = 149). The middle line of box represents the median value, the bounds of box represent the IQR, and the whiskers extend to 1.5 × IQR. fg Immunohistochemistry staining of AHNAK2 (f) and AREG (g) proteins in the KPTS tumors generated in this work (n = 2 with 8 field of views for each), and a human pancreatic cystic neoplasm sample as well as adjacent normal pancreas (8 field of views for each). Scale bar: 25 µm. hi Representative immunohistochemistry staining of AHNAK2 (h) and AREG (i) proteins in a human PDAC array including both tumor and adjacent normal pancreas from 28 PDAC patients (2 tumor tissues and 1 adjacent normal tissue per patient). Scale bar: 50 µm. Pearson’s Chi-squared test with Yates’ continuity correction was used to assess the statistical significance of the number of positive staining between tumor tissues versus normal tissues.

References

    1. Rahib L, Wehner MR, Matrisian LM, Nead KT. Estimated projection of US cancer incidence and death to 2040. JAMA Netw. Open. 2021;4:e214708. doi: 10.1001/jamanetworkopen.2021.4708. - DOI - PMC - PubMed
    1. Hidalgo M, et al. Addressing the challenges of pancreatic cancer: future directions for improving outcomes. Pancreatology. 2015;15:8–18. doi: 10.1016/j.pan.2014.10.001. - DOI - PubMed
    1. Pandiri AR. Overview of exocrine pancreatic pathobiology. Toxicol. Pathol. 2014;42:207–216. doi: 10.1177/0192623313509907. - DOI - PMC - PubMed
    1. Busnardo AC, DiDio LJ, Tidrick RT, Thomford NR. History of the pancreas. Am. J. Surg. 1983;146:539–550. doi: 10.1016/0002-9610(83)90286-6. - DOI - PubMed
    1. Mazur PK, Siveke JT. Genetically engineered mouse models of pancreatic cancer: unravelling tumour biology and progressing translational oncology. Gut. 2012;61:1488–1500. doi: 10.1136/gutjnl-2011-300756. - DOI - PubMed

MeSH terms

Substances