. 2024 Jan 27;15(1):806.
doi: 10.1038/s41467-024-44887-y.

Global distribution of surface soil organic carbon in urban greenspaces

Affiliations

Global distribution of surface soil organic carbon in urban greenspaces

Hongbo Guo et al. Nat Commun. .

Abstract

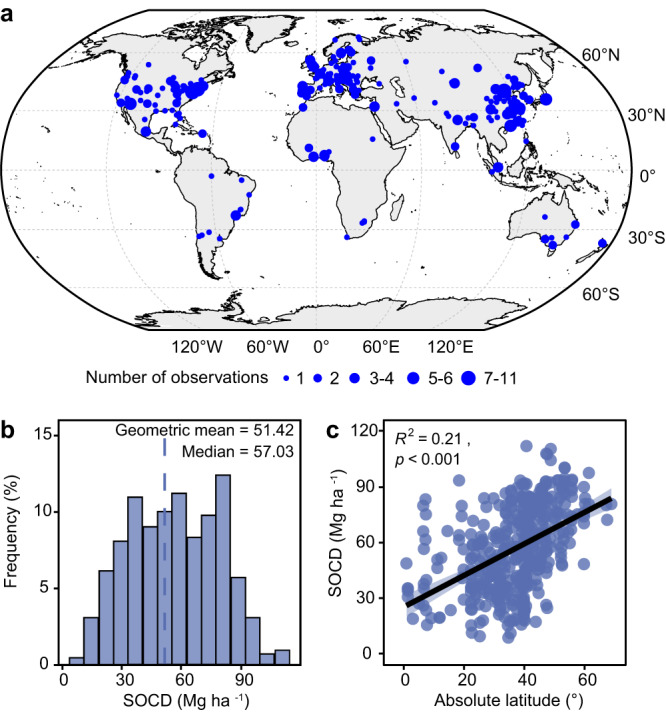
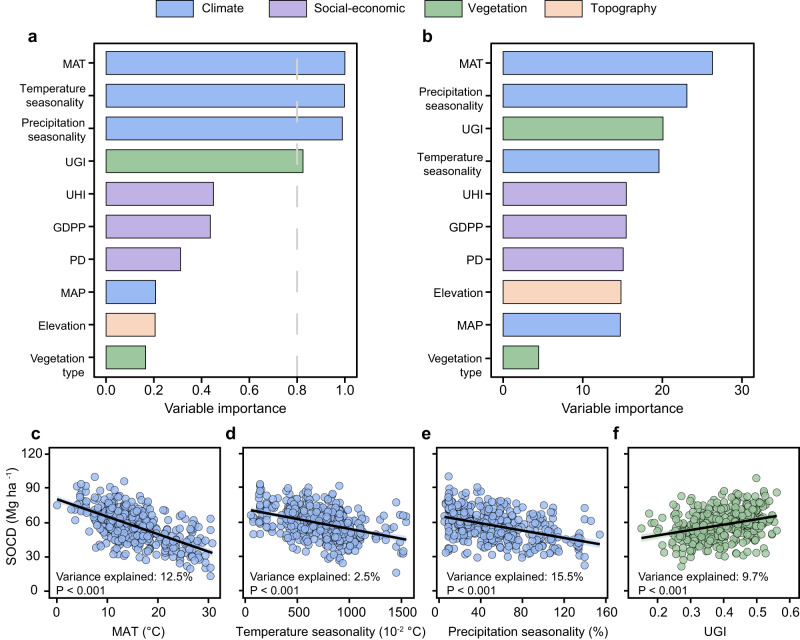
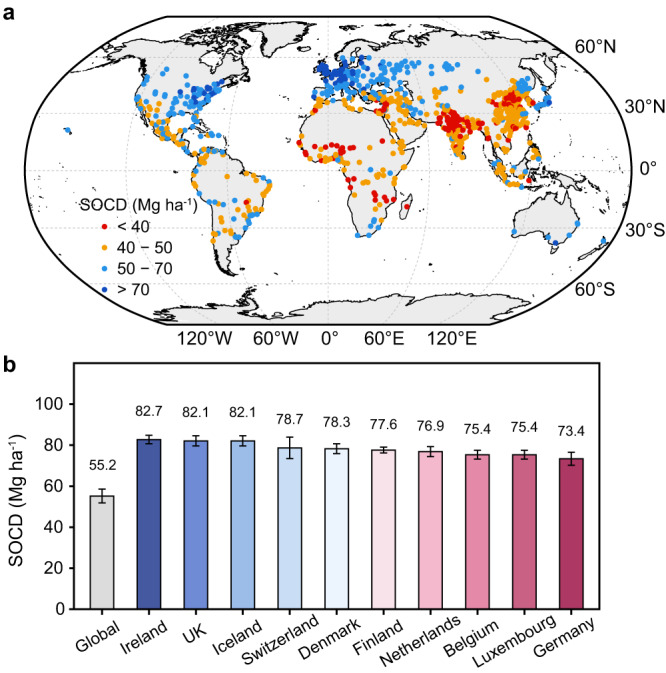
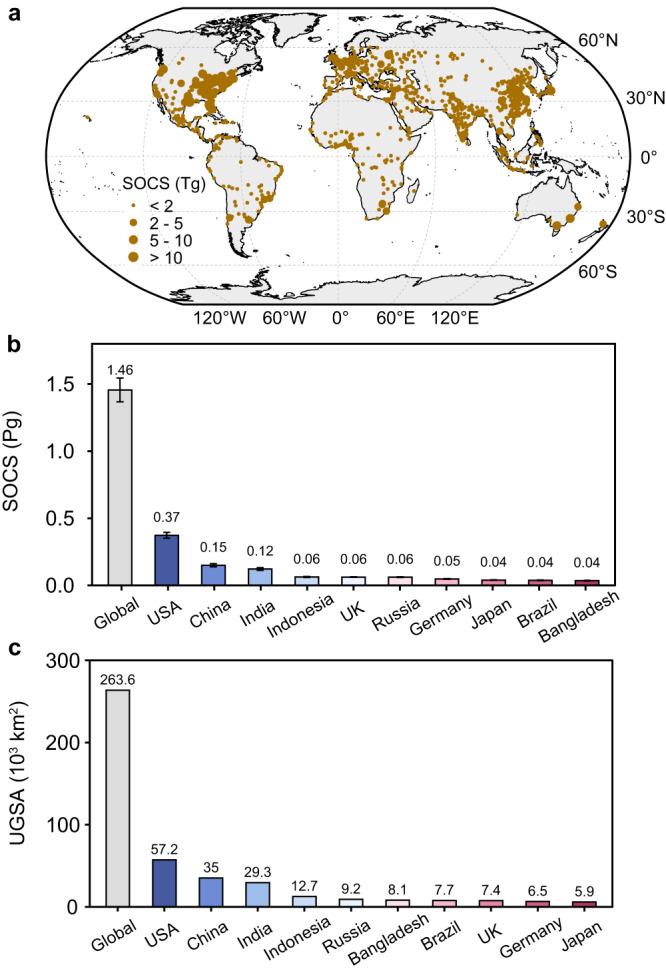
Urban greenspaces continue to grow with global urbanization. The global distribution and stock of soil organic carbon (SOC) in urban greenspaces remain largely undescribed and missing in global carbon (C) budgets. Here, we synthesize data of 420 observations from 257 cities in 52 countries to evaluate the global pattern of surface SOC density (0-20 cm depth) in urban greenspaces. Surface SOC density in urban greenspaces increases significantly at higher latitudes and decreases significantly with higher mean annual temperature, stronger temperature and precipitation seasonality, as well as lower urban greenness index. By mapping surface SOC density using a random forest model, we estimate an average SOC density of 55.2 (51.9-58.6) Mg C ha-1 and a SOC stock of 1.46 (1.37-1.54) Pg C in global urban greenspaces. Our findings present a comprehensive assessment of SOC in global urban greenspaces and provide a baseline for future urban soil C assessment under continuing urbanization.


Conflict of interest statement

The authors declare no competing interests.

Figures

Fig. 1
Fig. 1. Spatial distribution, frequency distribution and latitudinal trend of observed surface SOC density (SOCD) (0–20 cm) across global urban greenspaces in SOC-U database.
a Global distribution of observations. b The frequency distribution of observed SOCD. c Changes in observed SOCD with latitude (absolute values; See Supplementary Fig. 2a for separate analyses of northern and southern hemispheres). The size of blue circle in Fig. 1a indicates the number of reported SOC observations from different studies within each city. The dashed line in Fig. 1b indicates the geometric mean of observed SOCD. The shaded area in Fig. 1c represents the 95% confidence interval of the linear regression.
Fig. 2
Fig. 2. Relative importance of the potential predictors and conditional regression plots for important predictors.
a, b Relative importance of the potential predictors for SOC density (SOCD) based on linear model analysis (a) and random forest analysis (b). cf Conditional regression plots with mean annual temperature (MAT) (c) temperature seasonality (d) precipitation seasonality (e), and urban greenness index (UGI) (f). Different colours represent different predictor groups. The variable importance shown in Fig. 2a is based on the sum of the Akaike weights derived from model selection using corrected Akaike information criterion. The cut-off is set at 0.8 (grey dashed line in a) to differentiate among the important predictors. The importance shown in Fig. 2b is based on Mean Decrease Gini of random forest models. The black solid lines in Fig. 1c–f indicate the conditional regression fit. The shaded areas in Fig. 1c–f represent the 95% confidence intervals. Only data with reported information on vegetation type were used for the analysis (n = 282) and an additional analysis was also conducted using all data (n = 420) (Supplementary Fig. 5). MAP mean annual precipitation, GDPP GDP per capita, PD population density, UHI urban heat island index.
Fig. 3
Fig. 3. Global patterns of predicted surface SOC density (SOCD) (0–20 cm) and area-weighted national mean SOCD in urban greenspaces.
a Predicted SOCD of urban greenspaces for mid- and large cities (urban population > 0.5 million) (Supplementary data 1). b Average SOCD of urban greenspaces estimated for the globe and top ten countries weighted by areas. The colour of circle in Fig. 3a indicate variations in predicted SOCD. Error bars in Fig. 3b represent the 95% confidence intervals.
Fig. 4
Fig. 4. Global patterns of surface SOC stocks (SOCS) (0-20 cm) of mid- and large cities and national estimates of SOCS in urban greenspaces.
a Predicted SOCS of urban greenspaces for mid- and large cities (urban population > 0.5 million) (Supplementary data 1). b, c Total SOCS (b) and urban greenspace areas (UGSA) (c) estimated for the globe and top ten countries. The size of brown circle in Fig. 4a indicates the variations of predicted SOCS. Error bars in Figs. 4b and 4c represent the 95% confidence intervals. The estimates of national SOCS were based on the total national areas of urban greenspaces (Supplementary data 2).

References

    1. Gao J, O’Neill BC. Mapping global urban land for the 21st century with data-driven simulations and Shared Socioeconomic Pathways. Nat. Commun. 2020;11:2302. doi: 10.1038/s41467-020-15788-7. - DOI - PMC - PubMed
    1. Liu X, et al. High-spatiotemporal-resolution mapping of global urban change from 1985 to 2015. Nat. Sustainability. 2020;3:564–570. doi: 10.1038/s41893-020-0521-x. - DOI
    1. Gurney KR, et al. Climate change: track urban emissions on a human scale. Nature. 2015;525:179–181. doi: 10.1038/525179a. - DOI - PubMed
    1. Churkina G. The role of urbanization in the global carbon cycle. Front. Ecol. Evol. 2016;3:144. doi: 10.3389/fevo.2015.00144. - DOI
    1. Lal, R. & Augustin, B. Carbon sequestration in urban ecosystems.(Springer Science & Business Media, 2011).

LinkOut - more resources