. 2024 Jan 27;15(1):834.
doi: 10.1038/s41467-024-45137-x.

Accurate prediction of the optical properties of nanoalloys with both plasmonic and magnetic elements

Affiliations

Accurate prediction of the optical properties of nanoalloys with both plasmonic and magnetic elements

Vito Coviello et al. Nat Commun. .

Abstract

The alloying process plays a pivotal role in the development of advanced multifunctional plasmonic materials within the realm of modern nanotechnology. However, accurate in silico predictions are only available for metal clusters of just a few nanometers, while the support of modelling is required to navigate the broad landscape of components, structures and stoichiometry of plasmonic nanoalloys regardless of their size. Here we report on the accurate calculation and conceptual understanding of the optical properties of metastable alloys of both plasmonic (Au) and magnetic (Co) elements obtained through a tailored laser synthesis procedure. The model is based on the density functional theory calculation of the dielectric function with the Hubbard-corrected local density approximation, the correction for intrinsic size effects and use of classical electrodynamics. This approach is built to manage critical aspects in modelling of real samples, as spin polarization effects due to magnetic elements, short-range order variability, and size heterogeneity. The method provides accurate results also for other magnetic-plasmonic (Au-Fe) and typical plasmonic (Au-Ag) nanoalloys, thus being available for the investigation of several other nanomaterials waiting for assessment and exploitation in fundamental sectors such as quantum optics, magneto-optics, magneto-plasmonics, metamaterials, chiral catalysis and plasmon-enhanced catalysis.


Conflict of interest statement

The authors declare no competing interests.

Figures

Fig. 1
Fig. 1. Synthesis and TEM characterization of Au-Co NPs.
a Schematic depiction of the LAL synthetic protocol to obtain metastable Au-Co alloy NPs: ns laser pulses are focused on a bulk Au-Co target to generate a colloid of nanoalloys in ethanol. b HRTEM image of the Au-Co NPs. c Schematic depiction of the SBS protocol to isolate different size fractions from the pristine sample. In SBS, the PEG-coated Au-Co NPs in water are subjected to centrifugal fields with increasing centrifugal force to separate NPs with different average size. d, e TEM (d) and STEM-EDX (e) bidimensional images of the three Au-Co samples, showing a homogeneous distribution of the two elements in the NPs (Au in yellow, Co in blue).
Fig. 2
Fig. 2. Optical and structural characterization of Au-Co NPs.
a TEM-measured size histogram of the Au-Co NPs samples (sample A (brown): 45 ± 18 nm; sample B (blue): 24 ± 6 nm; sample C (green): 6 ± 3 nm). Statistics considered >500 NPs for each sample. b XRD pattern and Rietveld refinement of the Au-Co NPs samples. Colors in the graphs are: brown (sample A); blue (sample B); green (sample C). c Plot of composition and size of the Au-Co NPs samples (brown: sample A; blue: sample B; green: sample C) and pure Au NPs samples with similar size used for comparison (brown: sample Au49; blue: sample A29; green: sample Au9; see Methods). The diameter was determined from TEM image analysis and horizontal error bars indicate the size standard deviation from TEM histograms. Vertical error bars indicate the semi-dispersion over the mean composition assessed with the three techniques indicated in the legend. d Optical absorption spectra of the Au-Co NPs samples (brown: sample A; blue: sample B; green: sample C) and pure Au NPs samples with comparable size (brown dashed line: sample Au49; blue dashed line: sample A29; green dashed line: sample Au9). The data was normalized to the extinction at 400 nm. e Position of the six NP samples in the CIE diagram, showing the different locations due to the different plasmon responses. Source data are provided as a Source Data file.
Fig. 3
Fig. 3. Modelling approach and calculated dielectric functions for the Au-Co nanoalloys.
ac Schematic depiction of the procedure for modelling the optical properties of Au-Co alloy samples: (a) optimization of U by modelling the experimental dielectric function of pure Au and Co (yellow: Au; blue: Co); b DFT + U calculation of the dielectric functions of the Au-Co alloys with the same composition of the experimental samples; c Mie theory calculation (red) of the extinction of the colloid of Au-Co alloy NPs (black) using the computed dielectric functions for the alloy, the experimental dielectric function of the solvent and the size distribution measured by electron microscopy. d ε’ and ε” obtained by DFT + U calculations with SRO- or SQS models, compared to the experimental value of pure Au (brown: Au(24)Co(8); blue: Au(26)Co(6); green: Au(28)Co(4); black: Au). e, f Plot of QLSP (e) and (ε’+2εm)2 + ε” (complete Fröhlich condition in a nanosphere, f) using the calculated dielectric functions for the Au-Co alloy and the experimental value for Au. Color in the graphs are brown (Au(24)Co(8)), blue (Au(26)Co(6)), green (Au(28)Co(4)), black (Au). Source data are provided as a Source Data file.
Fig. 4
Fig. 4. Comparison of experimental and calculated mass extinction coefficient (in mL mg-1 cm-1) for the three samples of Au-Co alloy NPs in water.
a DFT calculations with the SRO− (magenta) and SRO+ (orange) cell model. b DFT calculations with the SQS cell model (magenta) or with a composition-weighted average of the dielectric functions of pure Au and Co (light green). The WC parameters which quantify the short-range ordering in each cell are also reported in (a, b). c R2 quantifying the accuracy of calculated data to experimental ones for the various parameters and models considered in the study (for details see text). Colors in the graphs are: brown (sample A); blue (sample B); green (sample C). Source data are provided as a Source Data file.
Fig. 5
Fig. 5. Au-Fe and Au-Ag optical properties.
Comparison of experimental (continuous black line) and calculated (magenta line) mass extinction coefficients (in mL mg−1 cm−1) for colloidal samples of nanoalloys made of another magnetic-plasmonic system (Au-Fe) and of a typical plasmonic system (Au-Ag). The calculations obtained with the dielectric functions available in literature from experimental measurements (refs. ,, black dashed line) and TD-DFT GLLBSC calculations (ref. , cyan line), and results with the PBE functional (green line) are also reported. The agreement with the real samples of nanoalloys is evaluated quantitatively with the R2. Source data are provided as a Source Data file.
Fig. 6
Fig. 6. DFT results for Au(32-x)Co(x) cells with x between 0 and 8 (25 at%).
a Mixing enthalpy and models of cubic cells used in DFT calculations (Au atoms in yellow, Co atoms in cyan). The dashed line is a b-spline interpolation of data. b Cell volume (in Å or normalized to pure Au value). The dashed line is a b-spline interpolation of data. c DOS plot showing the appearance of Co d band levels around the Fermi energy (EF). The black dashed line is located at the onset of d bands edge in pure Au and emphasizes their upshift with increasing Co content. d EF upshift versus alloy composition. Colors in the graphs are: black (Au(32)Co(0)), green (Au(30)Co(2)), blue (Au(28)Co(4)), brown (Au(26)Co(6)), light brown (Au(24)Co(8)). The dashed line is a b-spline interpolation of data. e Contour plot of the electronic density difference between Au(28)Co(4) or Au(26)Co(6) and pure Au bulk models showing the presence of excess electron density delocalized over the entire structure. FCC sites are indicated as white spheres. Note that a large oscillation of Δn(r) appears at sites where Au was substituted with Co, due to the way Δn(r) is defined (see Methods). Source data are provided as a Source Data file.
Fig. 7
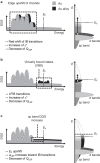
Fig. 7. Overview of the three main effects on the LSP of Au when it is alloyed with Co.
a Upshift of the onset of d bands, leading to the red shift of IB transitions and, hence, an increase of ε” and decrease of QLSP. b Appearance of VBS near EF, introducing LFIB and increasing ε”, which means a decrease of QLSP. c Increase of electron density in the sp band, leading to the upshift of the EF and the increase of LSP frequency (ωLSP) towards that of IB transitions, which also implies the decrease of QLSP. Colors in the graphs are: grey (schematic of the DOS of pure Au), black (schematic of the DOS change in the Au-Co alloy).

References

    1. Blaber MG, Arnold MD, Ford MJ. A review of the optical properties of alloys and intermetallics for plasmonics. J. Phys. Cond. Matt. 2010;22:143201. doi: 10.1088/0953-8984/22/14/143201. - DOI - PubMed
    1. Cortie MB, McDonagh AM. Synthesis and optical properties of hybrid and alloy plasmonic nanoparticles. Chem. Rev. 2011;111:3713–3735. doi: 10.1021/cr1002529. - DOI - PubMed
    1. Nugroho FAA, Darmadi I, Zhdanov VP, Langhammer C. Universal scaling and design rules of hydrogen-induced optical properties in Pd and Pd-alloy nanoparticles. ACS Nano. 2018;12:9903–9912. doi: 10.1021/acsnano.8b02835. - DOI - PubMed
    1. Gurbatov S, et al. Ag-decorated Si microspheres produced by laser ablation in liquid: all-in-one temperature-feedback SERS-based platform for nanosensing. Mater. 2022;15:8091. doi: 10.3390/ma15228091. - DOI - PMC - PubMed
    1. Sytwu K, Vadai M, Dionne JA. Bimetallic nanostructures: combining plasmonic and catalytic metals for photocatalysis. Adv. Phys. X. 2019;4:1619480.