

Antibody and transcription landscape in peripheral blood mononuclear cells of elderly adults over 70 years of age with third dose of COVID-19 BBIBP-CorV and ZF2001 booster vaccine
- PMID: 38280989
- PMCID: PMC10821575
- DOI: 10.1186/s12979-023-00408-x
Antibody and transcription landscape in peripheral blood mononuclear cells of elderly adults over 70 years of age with third dose of COVID-19 BBIBP-CorV and ZF2001 booster vaccine
Abstract
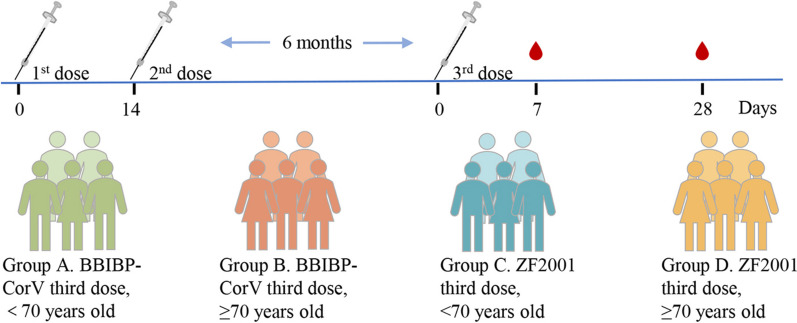
Background: In the context of the COVID-19 pandemic and extensive vaccination, it is important to explore the immune response of elderly adults to homologous and heterologous booster vaccines of COVID-19. At this point, we detected serum IgG antibodies and PBMC sample transcriptome profiles in 46 participants under 70 years old and 25 participants over 70 years old who received the third dose of the BBIBP-CorV and ZF2001 vaccines.
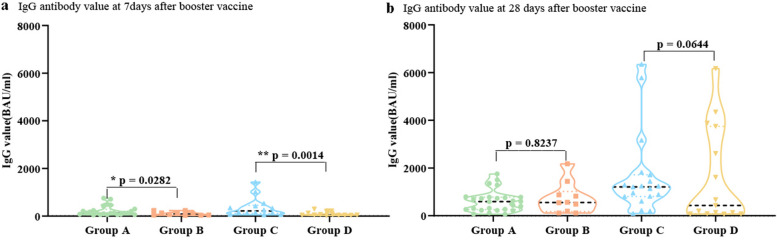
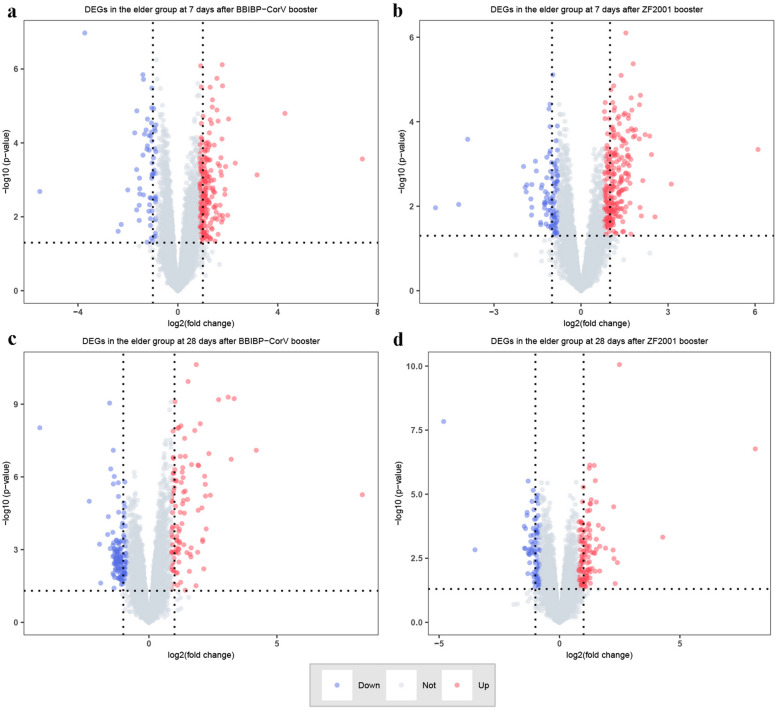
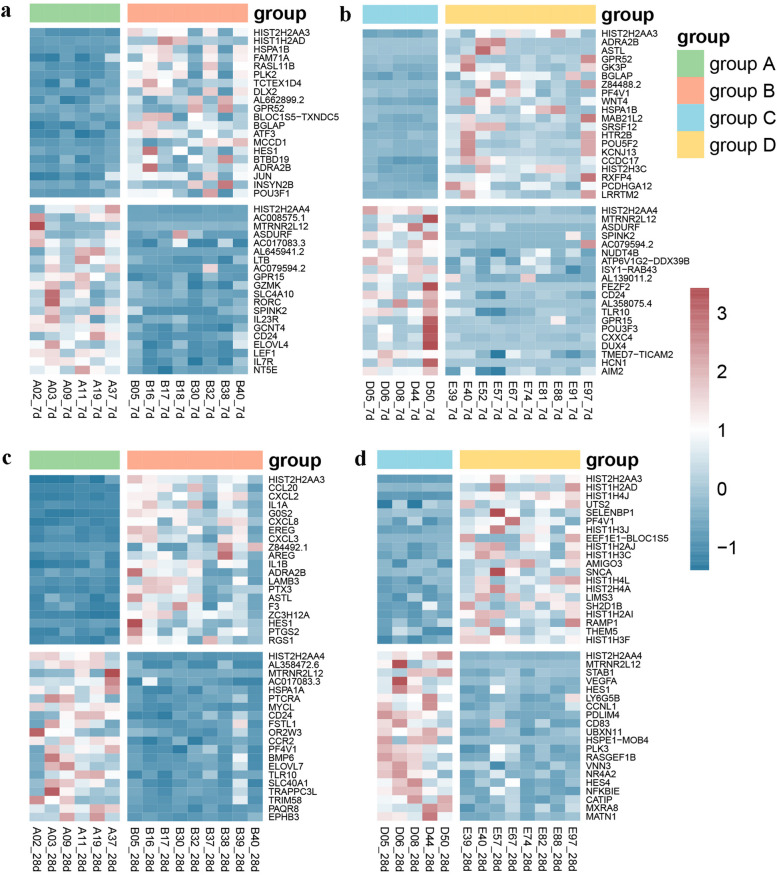
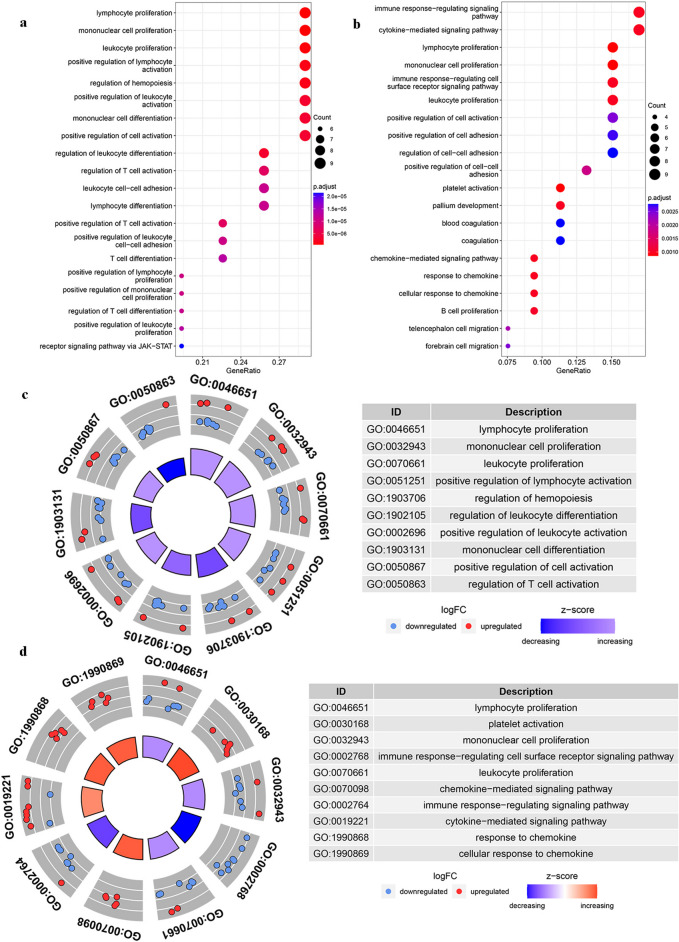
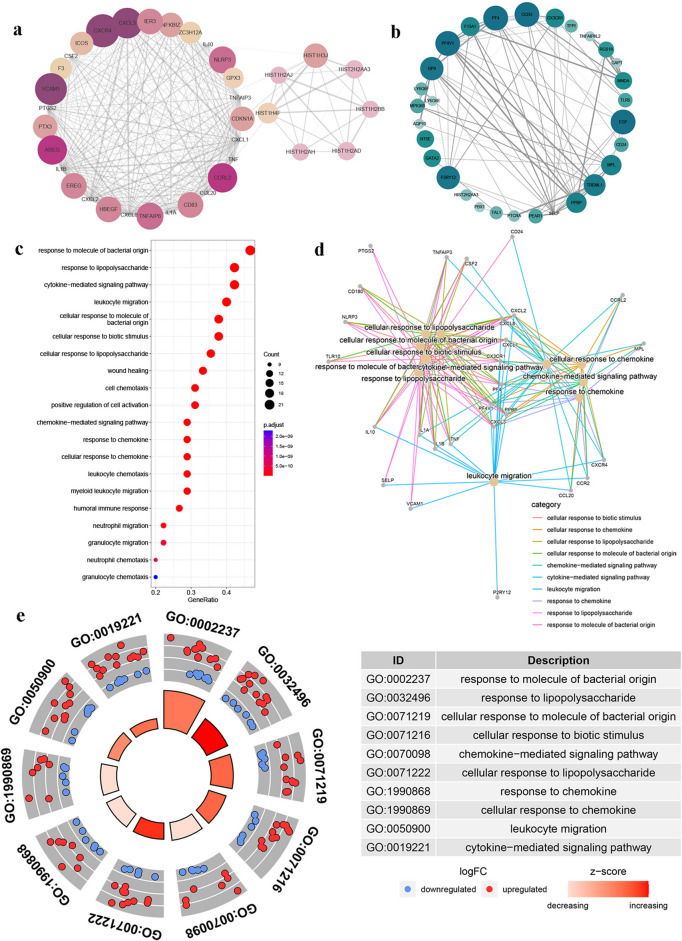
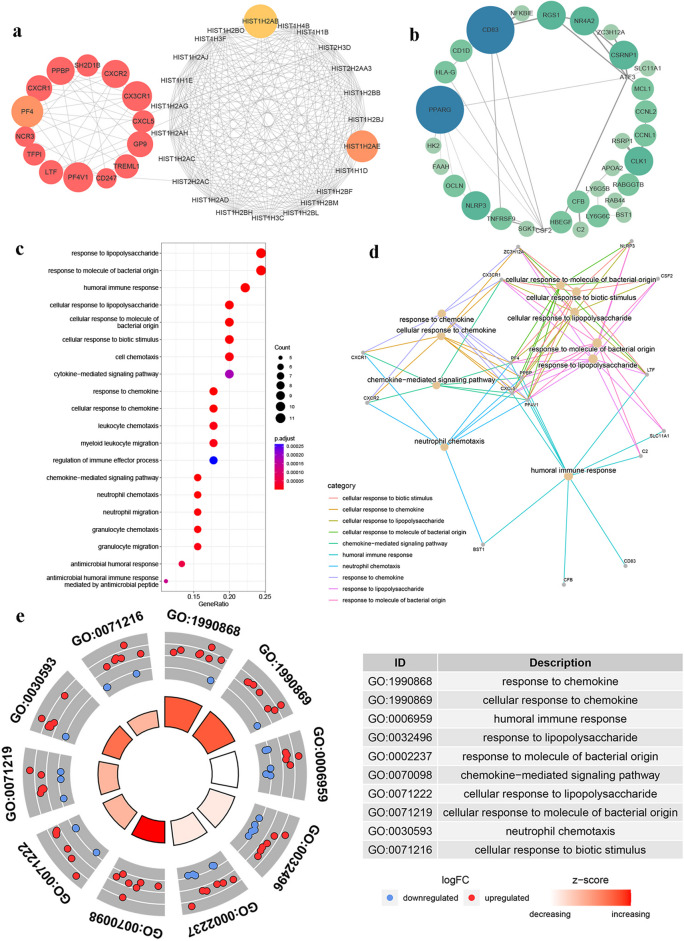
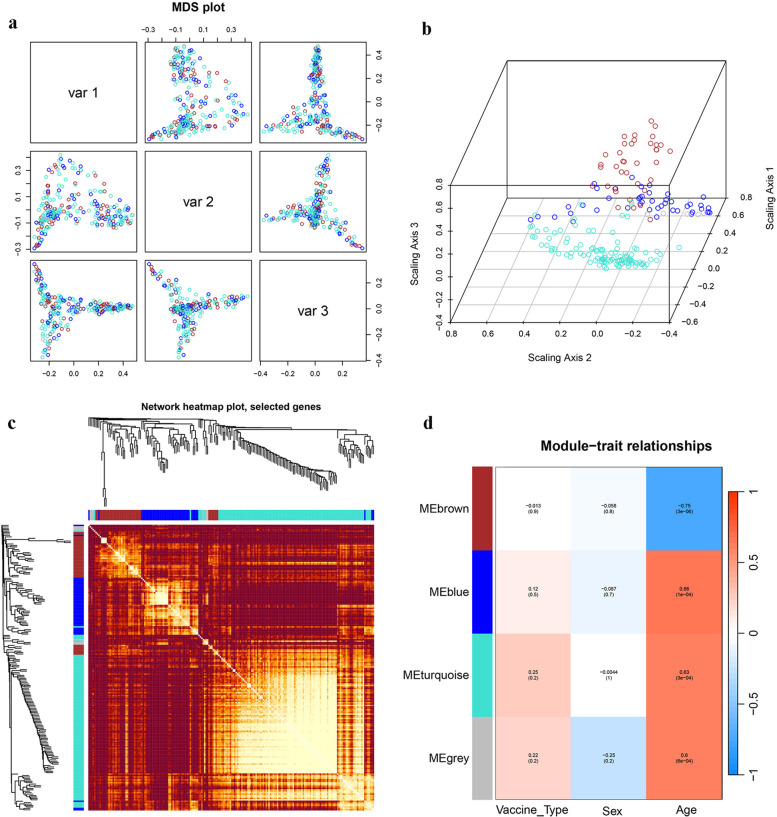
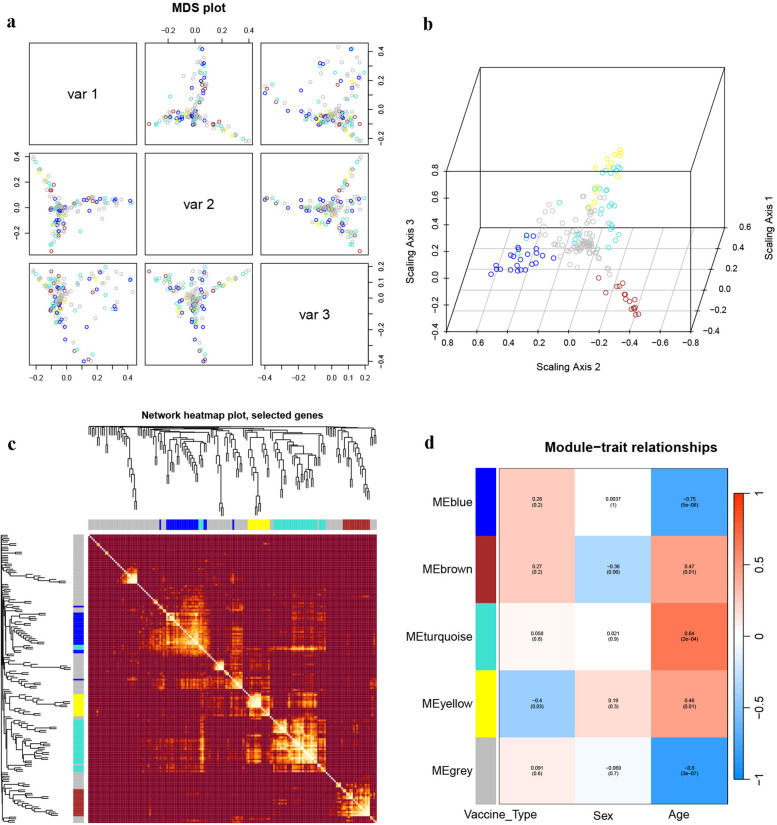
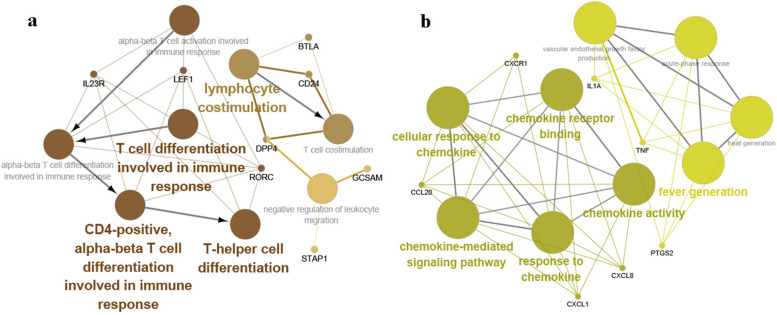
Results: On day 7, the antibody levels of people over 70 years old after the third dose of booster vaccine were lower than those of young people, and the transcriptional responses of innate and adaptive immunity were also weak. The age of the participants showed a significant negative correlation with functions related to T-cell differentiation and costimulation. Nevertheless, 28 days after the third dose, the IgG antibodies of elderly adults reached equivalence to those of younger adults, and immune-related transcriptional regulation was significantly improved. The age showed a significant positive correlation with functions related to "chemokine receptor binding", "chemokine activity", and "chemokine-mediated signaling pathway".
Conclusions: Our results document that the response of elderly adults to the third dose of the vaccine was delayed, but still able to achieve comparable immune effects compared to younger adults, in regard to antibody responses as well as at the transcript level.
Keywords: Aging; Antibody responses; COVID-19; RNA-seq; Systems biology analysis; Third booster vaccine; Transcriptome analysis.
© 2024. The Author(s).
Conflict of interest statement
The authors declare no competing interests.
Figures
Similar articles
-
Safety, immunogenicity, and efficacy of the mRNA vaccine CS-2034 as a heterologous booster versus homologous booster with BBIBP-CorV in adults aged ≥18 years: a randomised, double-blind, phase 2b trial.Lancet Infect Dis. 2023 Sep;23(9):1020-1030. doi: 10.1016/S1473-3099(23)00199-8. Epub 2023 May 19. Lancet Infect Dis. 2023. PMID: 37216958 Clinical Trial.
-
Antibody and T Cell Responses against SARS-CoV-2 Elicited by the Third Dose of BBIBP-CorV (Sinopharm) and BNT162b2 (Pfizer-BioNTech) Vaccines Using a Homologous or Heterologous Booster Vaccination Strategy.Vaccines (Basel). 2022 Mar 30;10(4):539. doi: 10.3390/vaccines10040539. Vaccines (Basel). 2022. PMID: 35455288 Free PMC article.
-
Single Ad26.COV2.S booster dose following two doses of BBIBP-CorV vaccine against SARS-CoV-2 infection in adults: Day 28 results of a phase 1/2 open-label trial.Vaccine. 2023 Jul 19;41(32):4648-4657. doi: 10.1016/j.vaccine.2023.06.043. Epub 2023 Jun 15. Vaccine. 2023. PMID: 37344265 Free PMC article. Clinical Trial.
-
Safety, immunogenicity and immune-persistence of heterologous prime-boost immunization with BBIBP-CorV and ZF2001 against SARS-CoV-2 in healthy adults aged 18 years or older.Expert Rev Vaccines. 2023 Jan-Dec;22(1):1079-1090. doi: 10.1080/14760584.2023.2274491. Epub 2023 Nov 8. Expert Rev Vaccines. 2023. PMID: 37877219 Clinical Trial.
-
Immunogenicity Following Two Doses of the BBIBP-CorV Vaccine and a Third Booster Dose with a Viral Vector and mRNA COVID-19 Vaccines against Delta and Omicron Variants in Prime Immunized Adults with Two Doses of the BBIBP-CorV Vaccine.Vaccines (Basel). 2022 Jul 3;10(7):1071. doi: 10.3390/vaccines10071071. Vaccines (Basel). 2022. PMID: 35891235 Free PMC article.
Cited by
-
Immune responses and transcription landscape of adults with the third dose of homologous and heterologous booster vaccines of COVID-19.Front Immunol. 2024 Sep 12;15:1461419. doi: 10.3389/fimmu.2024.1461419. eCollection 2024. Front Immunol. 2024. PMID: 39328415 Free PMC article.
-
Transcriptome Profiles Characteristics of the Peripheral Immune in Patients with Severe Fever with Thrombocytopenia Syndrome.J Inflamm Res. 2024 Nov 7;17:8357-8374. doi: 10.2147/JIR.S485118. eCollection 2024. J Inflamm Res. 2024. PMID: 39530000 Free PMC article.
References
Grants and funding
LinkOut - more resources
Full Text Sources
Molecular Biology Databases
