. 2024 Jan 27;43(1):33.
doi: 10.1186/s13046-023-02931-7.

Targeting cancer stem cell OXPHOS with tailored ruthenium complexes as a new anti-cancer strategy

Affiliations

Targeting cancer stem cell OXPHOS with tailored ruthenium complexes as a new anti-cancer strategy

Sonia Alcalá et al. J Exp Clin Cancer Res. .

Abstract

Background: Previous studies by our group have shown that oxidative phosphorylation (OXPHOS) is the main pathway by which pancreatic cancer stem cells (CSCs) meet their energetic requirements; therefore, OXPHOS represents an Achille's heel of these highly tumorigenic cells. Unfortunately, therapies that target OXPHOS in CSCs are lacking.

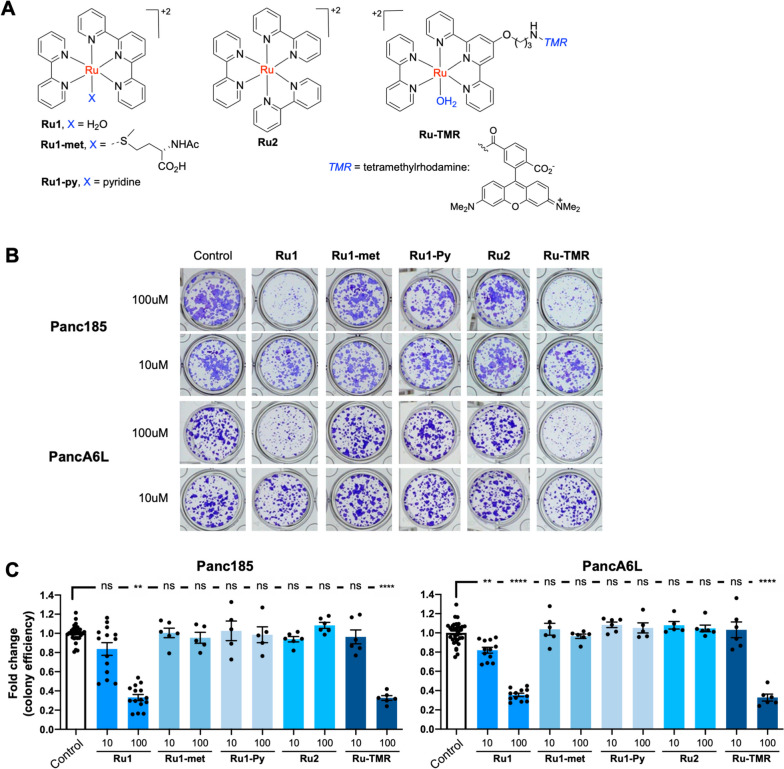
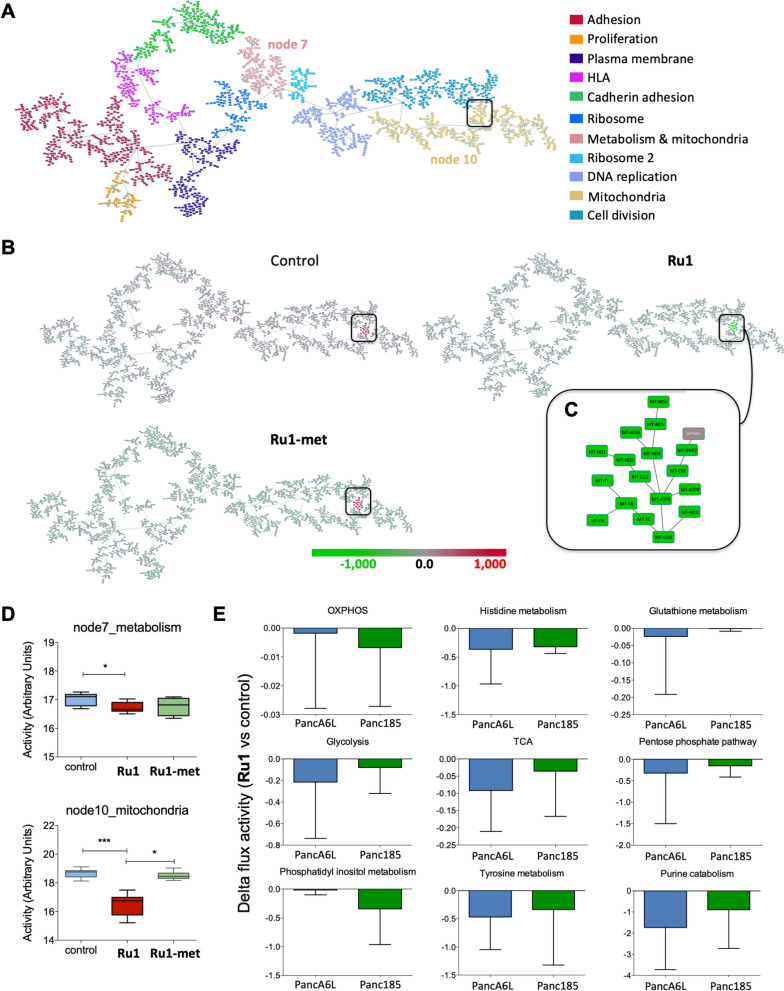
Methods: The safety and anti-CSC activity of a ruthenium complex featuring bipyridine and terpyridine ligands and one coordination labile position (Ru1) were evaluated across primary pancreatic cancer cultures and in vivo, using 8 patient-derived xenografts (PDXs). RNAseq analysis followed by mitochondria-specific molecular assays were used to determine the mechanism of action.

Results: We show that Ru1 is capable of inhibiting CSC OXPHOS function in vitro, and more importantly, it presents excellent anti-cancer activity, with low toxicity, across a large panel of human pancreatic PDXs, as well as in colorectal cancer and osteosarcoma PDXs. Mechanistic studies suggest that this activity stems from Ru1 binding to the D-loop region of the mitochondrial DNA of CSCs, inhibiting OXPHOS complex-associated transcription, leading to reduced mitochondrial oxygen consumption, membrane potential, and ATP production, all of which are necessary for CSCs, which heavily depend on mitochondrial respiration.

Conclusions: Overall, the coordination complex Ru1 represents not only an exciting new anti-cancer agent, but also a molecular tool to dissect the role of OXPHOS in CSCs. Results indicating that the compound is safe, non-toxic and highly effective in vivo are extremely exciting, and have allowed us to uncover unprecedented mechanistic possibilities to fight different cancer types based on targeting CSC OXPHOS.

Keywords: Anti-cancer agents; Cancer stem cells; Colon cancer; Mitochondrial DNA; Oxidative phosphorylation; Pancreatic ductal adenocarcinoma; Patient-derived xenografts; Ruthenium complexes.


Conflict of interest statement

A.G-P and J.A.F.V. are shareholders of Biomedica Molecular Medicine SL. The Ru1 compound intellectual property is published as EP3539971 B1.

Figures

Fig. 1
Fig. 1
Ru1 negatively affects PaCSCs molecular and functional properties. A Relative toxicity (LU = light units) ± SD in Panc185 and PancA6L adherent (non-CSCs) and sphere (CSCs) cultures treated at the indicated doses of Ru1 for 24, 48 or 72 h. Toxicity was determined using the ToxiLight assay kit at the indicated hours post treatment. B Representative flow cytometric plots of AnnexinV-FITC staining in Panc185 and PancA6L sphere-derived cells treated for 72 h with Ru1 at 100 and 250µM. C Top: Representative images of Panc185 spheres in the absence (untreated) or presence of Ru1. Cells were treated with Ru1 for 24 h at 100µM prior to establishing spheres. Bottom: Mean fold change ± SD in the number (no.) of spheres formed compared to control (set as 1.0). **** p < 0.0001, as determined by unpaired two-sided Student’s t-test. D Top: Representative images of Panc185 colonies in the absence (untreated) or presence of Ru1. Cells were treated with 24 h with the Ru1 at 100µM during day 1 post seeding. Bottom: Mean fold change ± SD in the colony efficiency in untreated and Ru1-treated samples, compared to control (set as 1.0). **** p < 0.0001, as determined by unpaired two-sided Student’s t-test. E Mean percentage of Autofluorescent+ or CD133+ cells ± SD, determined by flow cytometry, in untreated and Ru1-treated Panc185 cells (* p <0.05, ** p < 0.01, **** p < 0.0001, ns = not significant, as determined by unpaired Student’s t test). F Sum total of tumors obtained from untreated or Ru1-treated Panc185 and PancA6L injections, from two independent Limiting Dilution Analysis (LDA) assays. Cells were treated with Ru1 for 24h at 100µM prior to injection. CSC frequencies were calculated using the ELDA software. G Average tumor weights ± SD. * p < 0.05, ** p < 0.01, *** p < 0.001, as determined by unpaired two-sided Student’s t-test; nd= not determined. H Representative flow cytometric plots of AnnexinV-FITC/DAPI staining in Panc185 and PancA6L cells, treated for 24 h with Ru1 at 100 µM, and subsequently injected in vivo. I Top: Representative images of zebrafish embryo tails at 6 days post injection of 100-150 untreated or Ru1-treated H2b-mCherry-labelled Panc185 cells. Scale bar = 250 μM. Bottom: Mean ± SEM of proliferation ratio observed between untreated (Unt) or Ru1-treated determined on day 6 post injection. Cells were treated with Ru1 for 24 h at 100 µM prior to injection. Proliferation ratios are represented in comparison to 1 dpi (day post injection) (red line). * p < 0.05, as determined by unpaired two-sided Student’s t-test. J Mean number (no.) of spheres ± SEM determined at 7 (1st generation), 14 (2nd generation), and 21 (3rd generation) days post seeding, from CD133-negative, CD133-positive, Autofluorescent (Fluo)-negative, or Fluo-positive cells sorted from Panc185 cells and treated at d0 with Ru1 (100µM) for 24h. * p < 0.05, ** p < 0.01, *** p < 0.001, as determined by unpaired two-sided Student’s t-test
Fig. 2
Fig. 2
Analysis of Ru1 toxicity, PK and distribution in vivo. A-B Average weight ± SEM of mice treated orally (A) or retro-orbitally (r.o.) (B) with diluent control (Ctl) or Ru1 (1.4mg/kg,) for approximately 28-29 days. (*p < 0.05, as determined by unpaired two-sided Student’s t-test). C Average weight ± SEM of indicated organs extracted on d29 from mice treated with diluent control (Ctl) or Ru1 (1.4mg/kg, r.o). No significant differences were found, as determined by unpaired two-sided Student’s t-test. D Average values ± SEM of indicated hematocrit parameters determined from blood of mice extracted on d29 post treatment with diluent control (Ctl) or Ru1 (1.4mg/kg, r.o). No significant differences were found, as determined by unpaired two-sided Student’s t-test. E Picomoles of Ru1 per ml of serum, determined by ICP-MS, from mice at indicated time points post treatment initiation. F Picomoles of Ru1 per mg of tissue, determined by analyzing ruthenium with ICP-MS, from liver, kidneys and brain, extracted at indicated time points post treatment initiation. Dashed line indicates the background of the assay. G-H Indirect calorimetry analyses of mice treated with Ru1. Respiratory exchange ratio (RER) was determined as VCO2/VO2 and Energy expenditure (EE) was calculated as (3.185+ 1.232 x RER) x VO2. Shown are the mean RER (G) and mean EE (H) values ± SD for mice implanted with Azlet® Micro-Osmotic Pumps containing 5mM Ru1 or physiological saline (i.e., Sham) as a function of time (24 hours)
Fig. 3
Fig. 3
Ru1 halts PDAC, CRC and OS PDX growth in vivo. A Left: Average fold change in tumor volume ± SEM in mice bearing Panc185 PDXs and treated with Ru1 orally (o.g.), intra tumoral (i.t.) or retro orbitally (r.o.) over the course of 21 days and compared to d0 (n=4-6 tumors/group). Right: Fold change in tumor volume ± SEM determined on day 21 post treatment initiation. *p < 0.05; ns= not significant, as determined by one-way ANOVA with Dunnett post-test, compared to oral. B Experimental set-up for in vivo experiments using subcutaneously or orthotopically implanted PDXs and treatment with Ru1 (1.4 mg/kg; daily) and/or Gemcitabine (50mg/kg; twice per week). C Average fold change in tumor volume ± SEM in mice bearing Panc215 PDXs (left) or Panc354 PDXs (right) and treated with diluent control (Ctl), Ru1 (1.4mg/kg r.o.; daily), Gemcitabine (50mg/kg; twice per week) or a combination of both and compared to d0 (n=6-8 tumors/group). Histograms: Fold change in tumor volume ± SEM determined at treatment cessation. *p < 0.05, **p < 0.01, *** p<0.001, **** p<0.0001, as determined by one-way ANOVA with Dunnett post-test, compared to Ctl. D Mean percentage of EpCAM+, EpCAM+/CD133+, or EpCAM+/CD133+/CXCR4+ PaCSCs ± SEM, determined by flow cytometry, in extracted Panc354 tumors from (C). *** p<0.001, as determined by unpaired two-sided Student’s t-test. E Picomoles of Ru1 per mg of tumor, determined by ICP-MS, from PDX354 tumors extracted on d19 post treatment initiation (approx. 30-32h after the final injection). F Left: Average fold change in tumor volume ± SEM in mice bearing CRC01 treated with diluent control (Ctl), Ru1 (1.4mg/kg r.o.; daily), 5FU (30mg/kg; twice per week) or a combination of both and compared to d0 (n=8-12 tumors/group). Right: Fold change in tumor volume ± SEM determined at treatment cessation (d16). *p < 0.05; ns= not significant, as determined by one-way ANOVA with Dunnett post-test, compared to Ctl. G Left: Average fold change in tumor volume ± SEM in mice bearing OS170921 treated with diluent control (Ctl) or Ru1 (daily 1.4mg/kg r.o) and compared to d0 (n=6-8 tumors/group). Right: Fold change in tumor volume ± SEM determined at treatment cessation (d57). **p < 0.01, as determined by unpaired two-sided Student’s t-test. H OS170921 tumor weights (g) ± SEM determined at treatment cessation (d57). *p < 0.05, as determined by unpaired two-sided Student’s t-test
Fig. 4
Fig. 4
Ru1 halts PDAC growth and relapse in vivo. A Fold change in pancreas weight ± SEM in mice injected orthotopically with Panc265 cells determined at treatment cessation (n=4-5 mice/group). *p < 0.05, ** p<0.01, ns = not significant, as determined by one-way ANOVA with Dunnett post-test, compared to Ctl. B Representative photos of Panc265 orthotopic tumors extracted from mice 3 weeks post treatment initiation. C Mean percentage of EpCAM+/CXCR4+/CD90+ PaCSCs ± SD, determined by flow cytometry, in extracted tumors from (A). *p < 0.05, *** p<0.001, ns = not significant, as determined by one-way ANOVA with Dunnett post-test, compared to Ctl. D Average fold change in tumor volume ± SEM in mice bearing Panc185 PDXs and treated with diluent control (Ctl), Ru1 (1.4mg/kg r.o.; daily), Gemcitabine (50mg/kg; twice per week) or a combination of both and compared to d0 (n=6-12 tumors/group). E Fold change in Panc185 tumor volumes ± SEM determined at treatment cessation and at the indicated time during relapse. *p < 0.05; **** p<0.0001, as determined by unpaired two-sided Student’s t-test or a one-way ANOVA with Dunnett post-test, compared to Ctl. F Average fold change in tumor volume ± SEM in mice bearing PancA6L PDXs and treated with diluent control (Ctl), Ru1 (1.4mg/kg r.o.; daily), Gemcitabine (50mg/kg; twice per week) or a combination of both and compared to d0 (n=6-12 tumors/group). G Fold change in PancA6L tumor volumes ± SEM determined at treatment cessation and at the indicated time during relapse. *p < 0.05; **** p <0.0001, as determined by unpaired two-sided Student’s t-test or a one-way ANOVA with Dunnett post-test, compared to Ctl
Fig. 5
Fig. 5
Control assays using Ru1 derivatives. A Chemical structure of Ru1 and derivatives. B Representative images of Panc185 and PancA6L colonies in the absence (Control) or presence of Ru1 or indicated derivatives (10 and 100µM). Cells were treated for 24 h with the ruthenium compounds at 10 or 100µM during day 1 post seeding. C Mean fold change ± SEM in the colony efficiency (crystal violet absorbance) in treated (10 or 100µM) and Control samples, which were set to 1.0. ** p < 0.01, **** p < 0.0001, ns = not significant, as determined by one-way ANOVA with Dunnett post-test, comparing 10- or 100µM-treated to Control
Fig. 6
Fig. 6
Ru1 negatively regulates genes involved in OXPHOS. A Principal component (PC) analysis of Control-, Ru1- and Ru1-met-treated Panc185 spheres (100µM, 24 h). B Summary of the number of genes transcriptional modulated (up or down) compared to Control in Ru1- and Ru1-met-treated Panc185 or PancA6L spheres (100µM, 24 h). C-D Gene sets enriched in the transcriptional profile of Panc185 spheres treated with Ru1 (100µM, 24 h) compared to untreated Controls. Shown are the NES (normalized enrichment score) values for each pathway using the Hallmark or KEGG genesets, with nominal p value of <0.05 and FDR < 25%. E-F Example enrichment plots for Oxidative Phosphorylation using the Hallmark or KEGG genesets. For (F), a heatmap of modulated genes was included
Fig. 7
Fig. 7
Systems biology of pancreatic cancer and genes affected by Ru1. A Resulting network derived from the probabilistic graphical model (PGM) analyses. Shown are the 11 functional color-coded nodes, determined based on the mean-centered expression for the 2,000 genes with the most significant variation. B Network Heatmap showing the genes with the greatest variability between Ru1 and Control or Ru1 and Ru1-met. Green=under expressed, Red= over expressed. C Genes located within the mitochondria node (Node 10) that are significantly decreased between Ru1 and Control or Ru1 and Ru1-met. D Functional activity of the nodes comparing Control, Ru1 and Ru1-met. * p < 0.05, *** p < 0.001, as determined by one-way ANOVA with Tukey post-test. E Delta flux activities for Ru1-treated Panc185 or PancA6L cell compared to Control. In all cases, the indicated metabolic pathways decrease upon Ru1 treatment
Fig. 8
Fig. 8
Ru1 affects PaCSC oxygen consumption and mitochondrial functional properties. A Representative plot showing mean ± sd of oxygen consumption rate (OCR) for untreated (CTL) and Ru1-treated Panc185 spheres (100µM, 24 h), normalized to total protein using a BCA kit, which were treated with distinct inhibitors of mitochondrial function: O (oligomycin), F (FCCP), A (antimycinA), and R (rotenone). Continuous OCR values (pmoles/min/no. cell) are shown. B Measured and calculated mean ± SD OCR parameters (Resp = Respiration; Max = Maximum; SRC = Spare Respiratory Capacity; OC = Oxygen consumption; n=3 biological replicates with 3 readings). ** p < 0.01, *** p < 0.001, ns = not significant, as determined by unpaired two-sided Student’s t-test. C Mean fold-change ± SD in ATP nmoles/mg protein in untreated (CTL) and Ru1-treated Panc185 and PancA6L (100µM, 24 h) cells compared to control, set as 1.0. *** p < 0.001, as determined by unpaired Student’s t test. D Mean fold-change ± SD in the mitochondria membrane potential probes CMX-ROS, CM-H2Xros and Mitoblue or the ROS probe MitoSOX as a function of increasing concentrations of Ru1 in Panc185 or PancA6L cells (48h). * p < 0.05, ** p < 0.01, *** p < 0.001, as determined by one-way ANOVA with Dunnett post-test, compared to untreated (Ctl) set as 1.0. E Representative IF confocal images of TMRE (mitochondria membrane potential) or CellROX DeepRed (ROS) staining in untreated (Control), Ru1 or Ru1-met-treated Panc185 cells (100µM, 24 h). F Mean fold-change ± SD in the mitochondria membrane potential probe CMX-ROS or the ROS probe MitoSOX in Autofluorescent-negative (Fluo-) or Fluo+ FACS-sorted cells pre-treated with Ru1 (100µM, 48h). * p < 0.05, ns = not significant, as determined by unpaired Student’s t test. G Mean fold-change ± SD in the expression of the mtDNA-encoded gene MTATP6 or the nuclear DNA encoded gene COX5 as a function of increasing concentrations of Ru1 in Panc185 or PancA6L cells (48h treatment). Values were normalized to ß-actin levels. *** p < 0.001, **** p < 0.0001, as determined by one-way ANOVA with Dunnett post-test, compared to untreated (Ctl)
Fig. 9
Fig. 9
Ru1 binds the mtDNA D-loop and inhibits transcription. A Representative IF confocal images of MitoGreen (mitochondrial mass), Ru1-TMR (red) and DAPI (Blue) staining in Ru1 (100µM)-treated Panc185 cells (24 h). White arrows indicate co-localization of Ru1-TMR and MitoGreen. Scale bar = 20 µm. B Amount of Ru1 molecule (µg/L) in untreated (UT), Ru1-treated (red) or Ru1-met-treated (green) Panc185 and PancA6L, determined by ICP at the indicated times post-treatment with 100µM of compounds. C Amount of Ru1 molecule (µg/L), determined by ICP, in gradient-purified mitochondria isolated from untreated (UT) and Ru1-treated Panc185 (100µM, 24 h). D Diagram of the mitochondrial genome, indicating the protein-coding genes (CI, yellow; CIII, blue, CIV, green; CV, red), and ribosomal RNA (rRNA)-coding genes (light blue). The D-loop region is magnified, and the predicted GQs and their positions are show in purple. TAS = termination associated sequence; HSP = heavy strand promoter; LSP = light strand promoter; OH = origin of replication – heavy; OL = origin of replication – light. Adapted from [52] and created in part with BioRender.com. E Agarose gel resolved D-loop or RNR2 PCR products amplified from 0.1 or 0.01ng of mtDNA pre-incubated for 1 h with diluent (Ctl) or 10µM of Ru1 or Ru1-met. F Mean fold-change ± SD in the expression of the indicated mtDNA-encoded genes as a function of increasing concentrations of Ru1 in Panc185 or PancA6L cells (48 h treatment). Values were normalized to ß-actin levels. * p < 0.05, ** p < 0.01, *** p < 0.001, as determined by one-way ANOVA with Dunnett post-test, compared to untreated (Ctl) set as 1.0
Fig. 10
Fig. 10
Ru1 inhibits mtDNA transcription, OXPHOS protein complex translation and mitochondrial mass. A Mean fold-change ± SD in the expression of the mtDNA-encoded gene MTATP6, MTCYTB or MTND4 and the nuclear DNA encoded gene COX5 in Panc354 tumors extracted on d19 from mice treated with Ctl or Ru1 (1.4mg/kg; daily, r.o.). Values were normalized to ß-actin levels. * p < 0.05, ** p < 0.01, *** p<0.001, ns = not significant, as determined by unpaired two-sided Student’s t-test. B Mean fold-change ± SEM in the expression of the mtDNA-encoded gene MTATP6 or the nuclear DNA encoded gene COX5 in Panc265 orthotopic tumors extracted from mice 3 weeks post treatment initiation with Control (Ctl) Ru1, gemcitabine (50mg/kg; twice per week) GEM or a combination of both (R+G). Values were normalized to ß-actin levels. * p < 0.05, **** p < 0.0001, ns = not significant, as determined by one-way ANOVA with Dunnett post-test, compared to untreated (Ctl). C-D Mean fold-change ± SEM in the expression of murine mtDNA-encoded genes mt-Atp6 and mt-Cox1 or the nuclear DNA encoded gene Drp1 in the heart (C) or liver (D) from mice harboring Panc265 orthotopic tumors, 3 weeks post treatment initiation with Control (C), Ru1 (R), gemcitabine (50mg/kg; twice per week) (G), or a combination of both (R+G). Values were normalized to Hprt levels. * p < 0.05, ** p < 0.01, **** p < 0.0001, ns = not significant, as determined by one-way ANOVA with Dunnett post-test, compared to untreated (Ctl). E WB analysis of mitochondria OXPHOS complex proteins using the Mitoprofile Total OXPHOS antibody cocktail in addition to GAPDH (loading control). Shown are bands corresponding to Complex (C)V, CIII, CII, CIV, and CI from Panc185 cells that were either untreated (CTL) or treated with Ru1 (100µM) or Ru1-met (100µM) for 48 h and 48 h + 24 h after removing treatment. F Mean fold-change ± SEM of mitochondrial complex bands determined in (E) by densitometric analysis and normalized to GAPDH. (n=4 pooled WBs, * p < 0.05, ** p < 0.01, ns = not significant, as determined by one-way ANOVA with Dunnett post-test, compared to untreated (CTL). G Mean fold-change ± SD in the mitochondria mass probe NAO in untreated (-), Ru1 (100µM) or Ru1-met (100µM)-treated Panc185 and PancA6L cells (48 h). * p < 0.05, **** p < 0.0001, ns = not significant, as determined by one-way ANOVA with Dunnett post-test, compared to untreated (Ctl)

Similar articles

Cited by

References

    1. Gasch C, Ffrench B, O'Leary JJ, Gallagher MF. Catching moving targets: cancer stem cell hierarchies, therapy-resistance & considerations for clinical intervention. Mol Cancer. 2017;16(1):43. doi: 10.1186/s12943-017-0601-3. - DOI - PMC - PubMed
    1. Hermann PC, Sainz B., Jr Pancreatic cancer stem cells: a state or an entity? Semin Cancer Biol. 2018;53:223–31. doi: 10.1016/j.semcancer.2018.08.007. - DOI - PubMed
    1. Prager BC, Xie Q, Bao S, Rich JN. Cancer stem cells: the architects of the tumor ecosystem. Cell Stem Cell. 2019;24(1):41–53. doi: 10.1016/j.stem.2018.12.009. - DOI - PMC - PubMed
    1. Batlle E, Clevers H. Cancer stem cells revisited. Nat Med. 2017;23(10):1124–34. doi: 10.1038/nm.4409. - DOI - PubMed
    1. Saygin C, Matei D, Majeti R, Reizes O, Lathia JD. Targeting cancer stemness in the clinic: from hype to hope. Cell Stem Cell. 2019;24(1):25–40. doi: 10.1016/j.stem.2018.11.017. - DOI - PubMed

MeSH terms