. 2024 Jan 27;29(1):79.
doi: 10.1186/s40001-024-01684-z.

MDM4 was associated with poor prognosis and tumor-immune infiltration of cancers

Affiliations

MDM4 was associated with poor prognosis and tumor-immune infiltration of cancers

Jie Liu et al. Eur J Med Res. .

Abstract

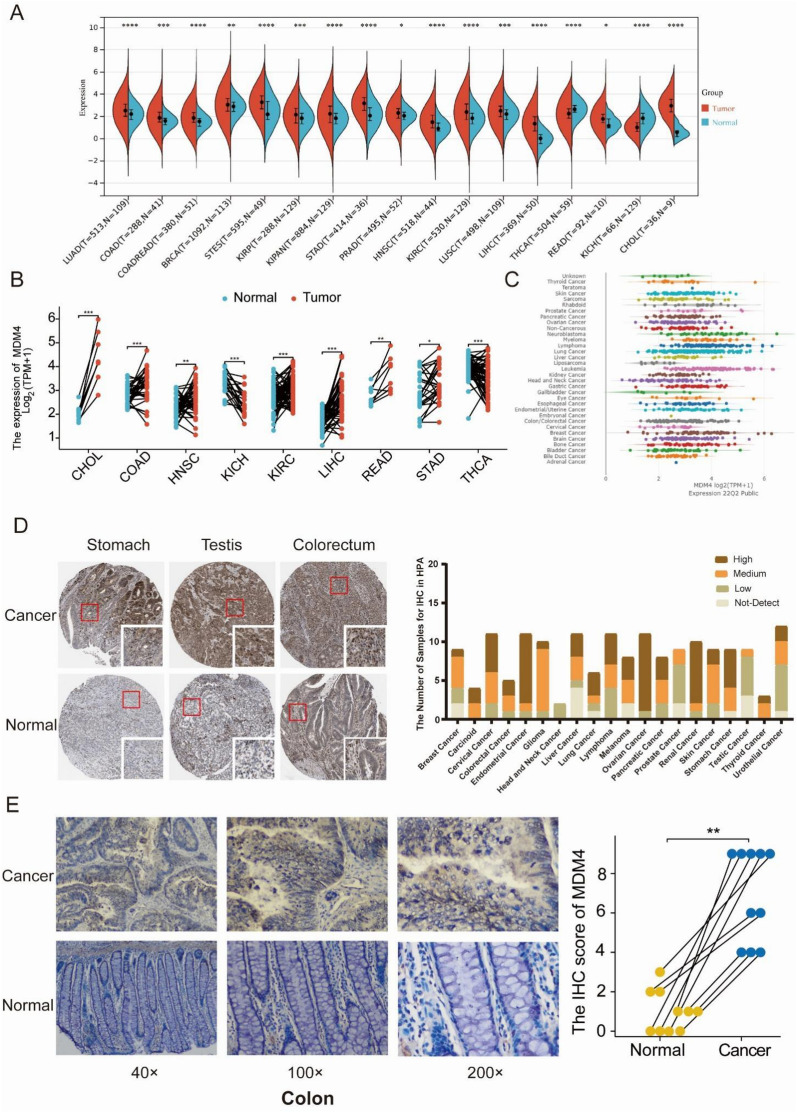
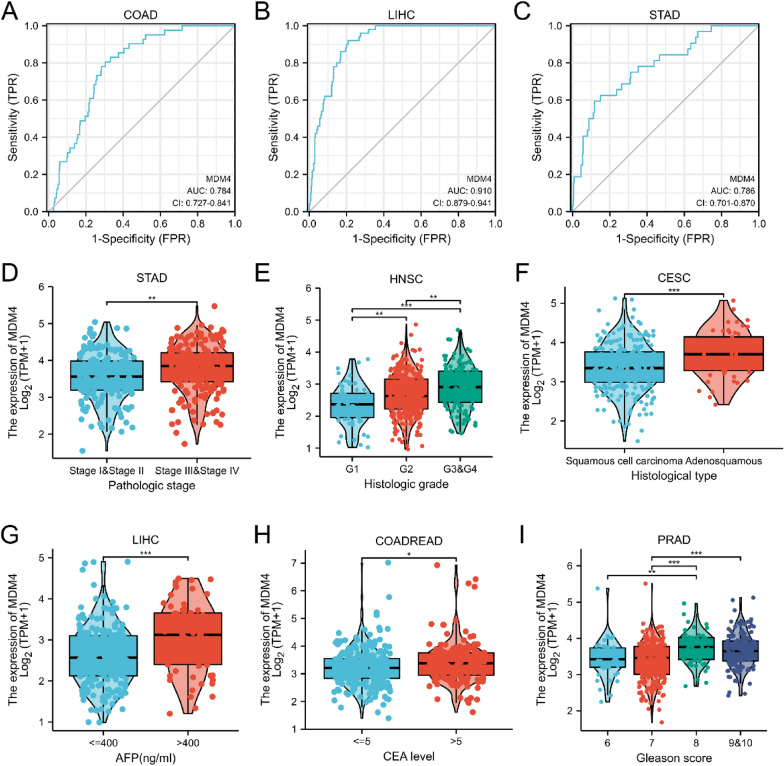
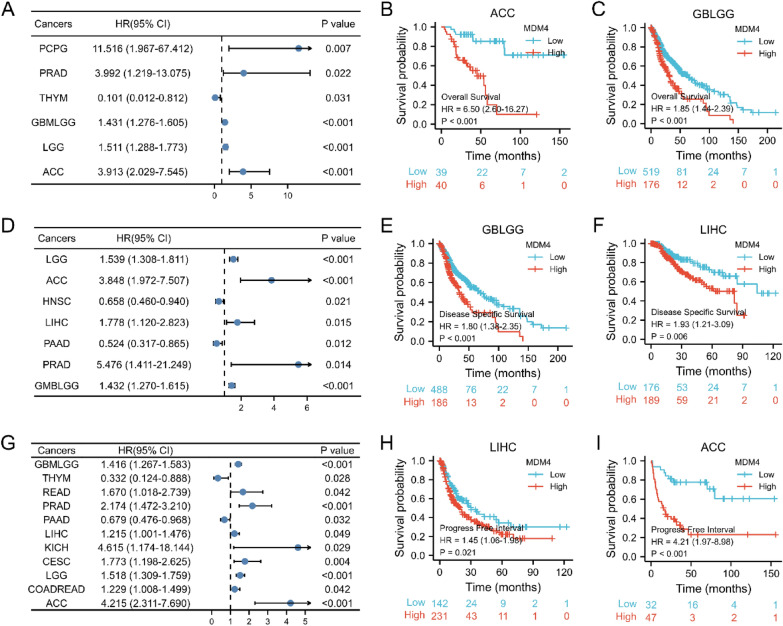
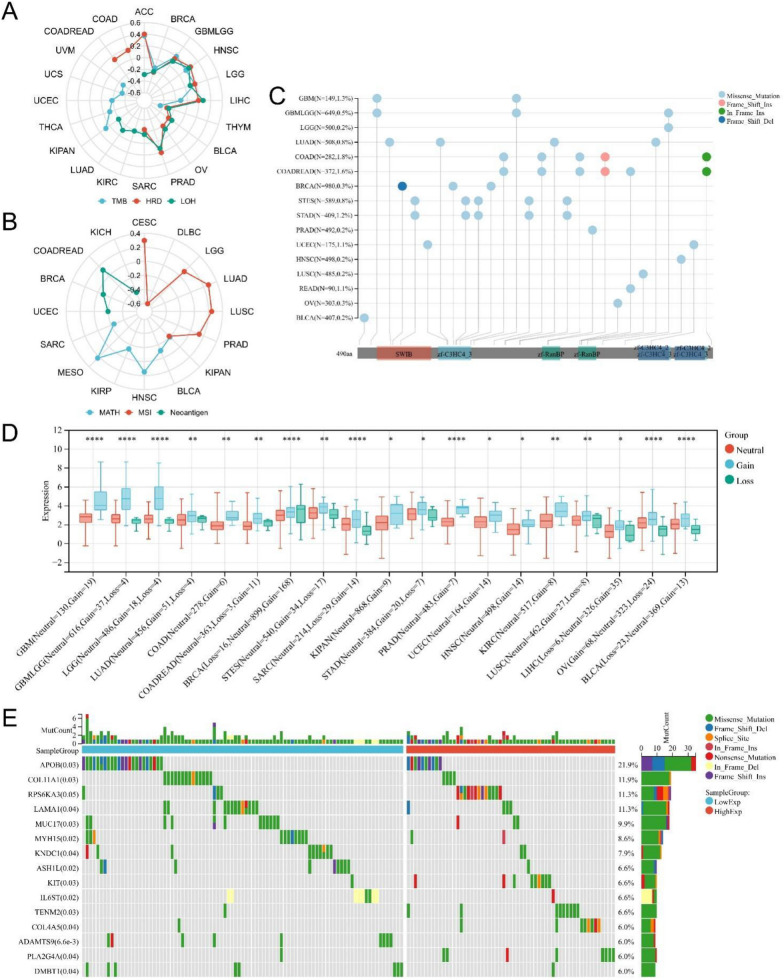
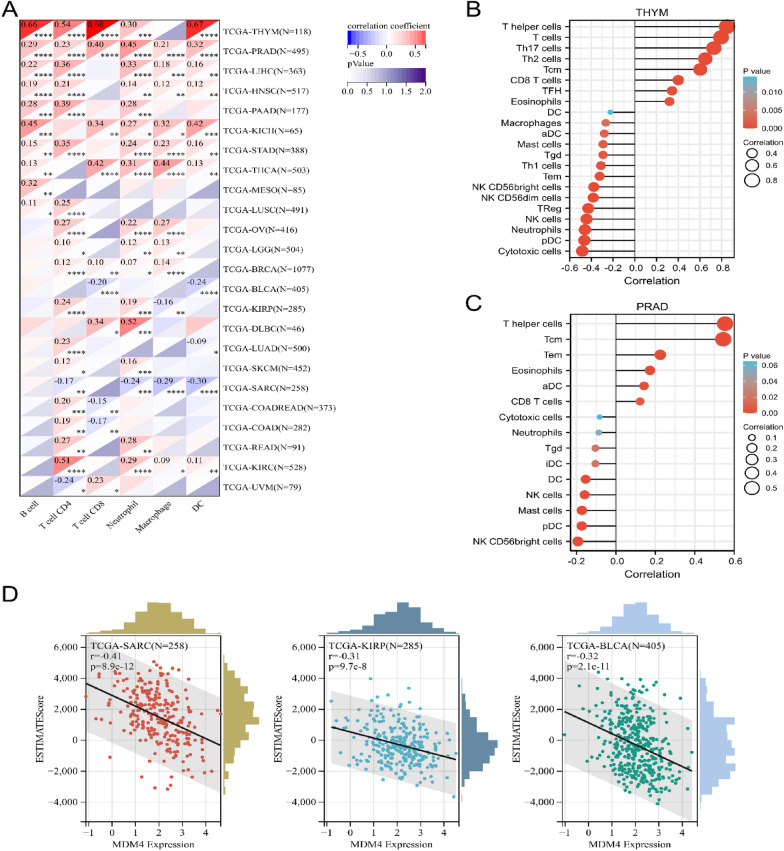
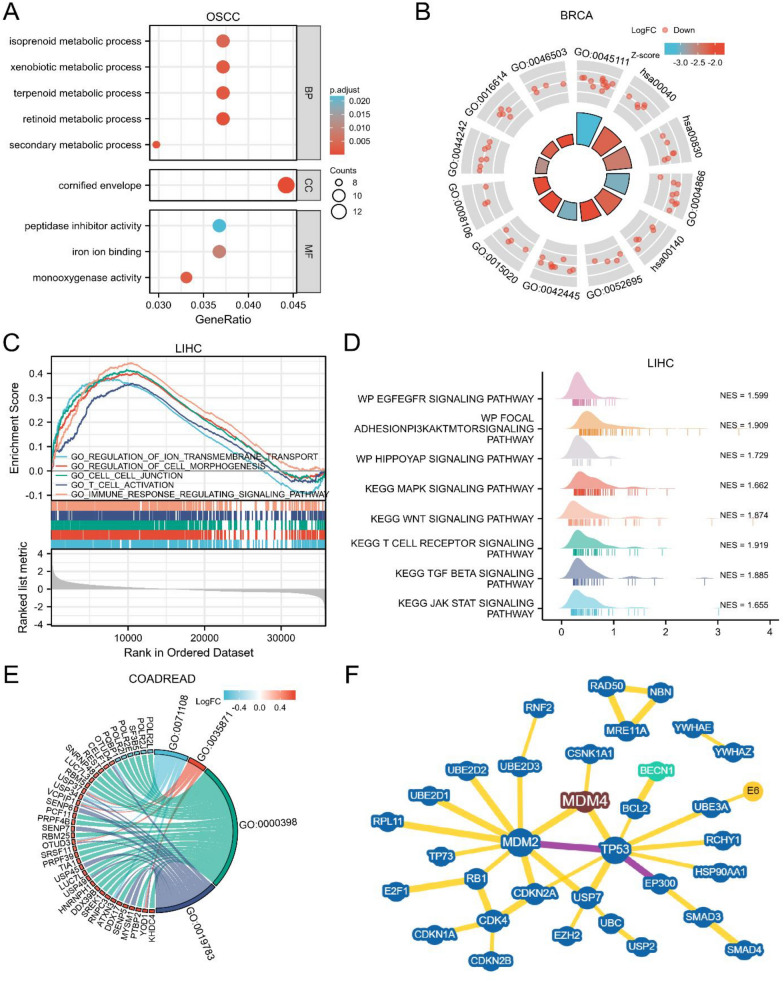
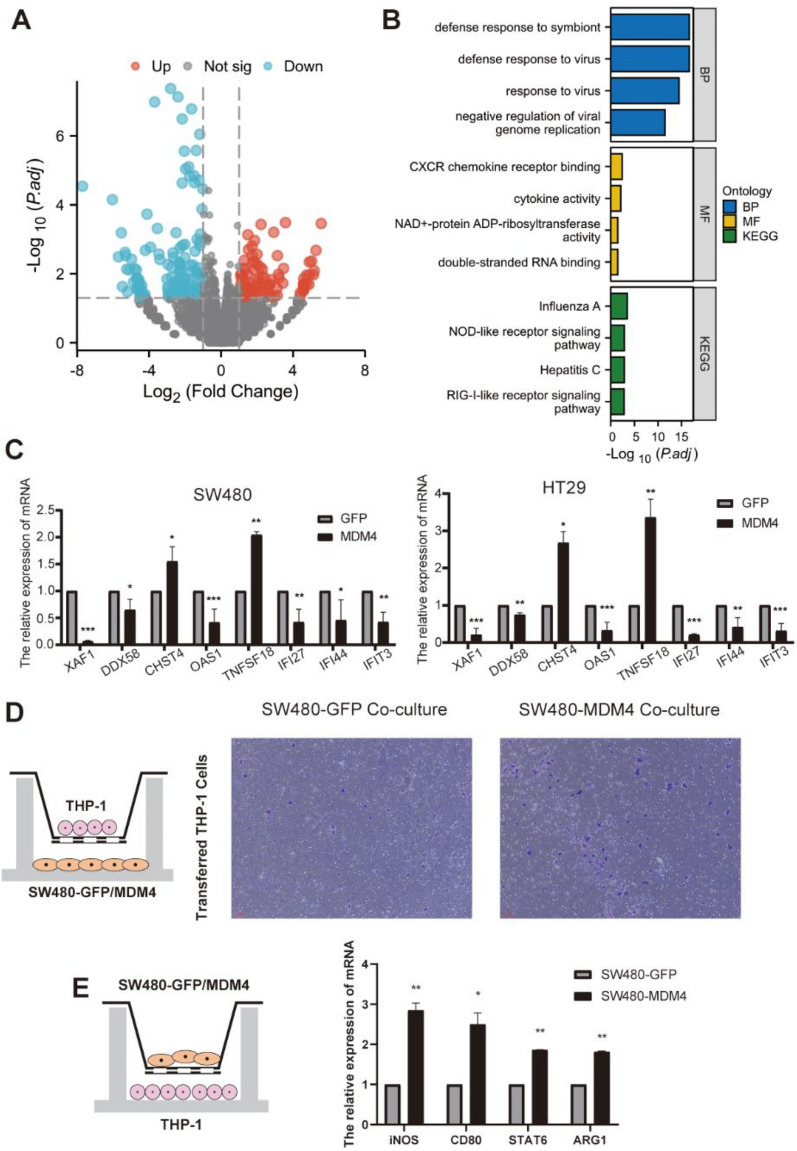
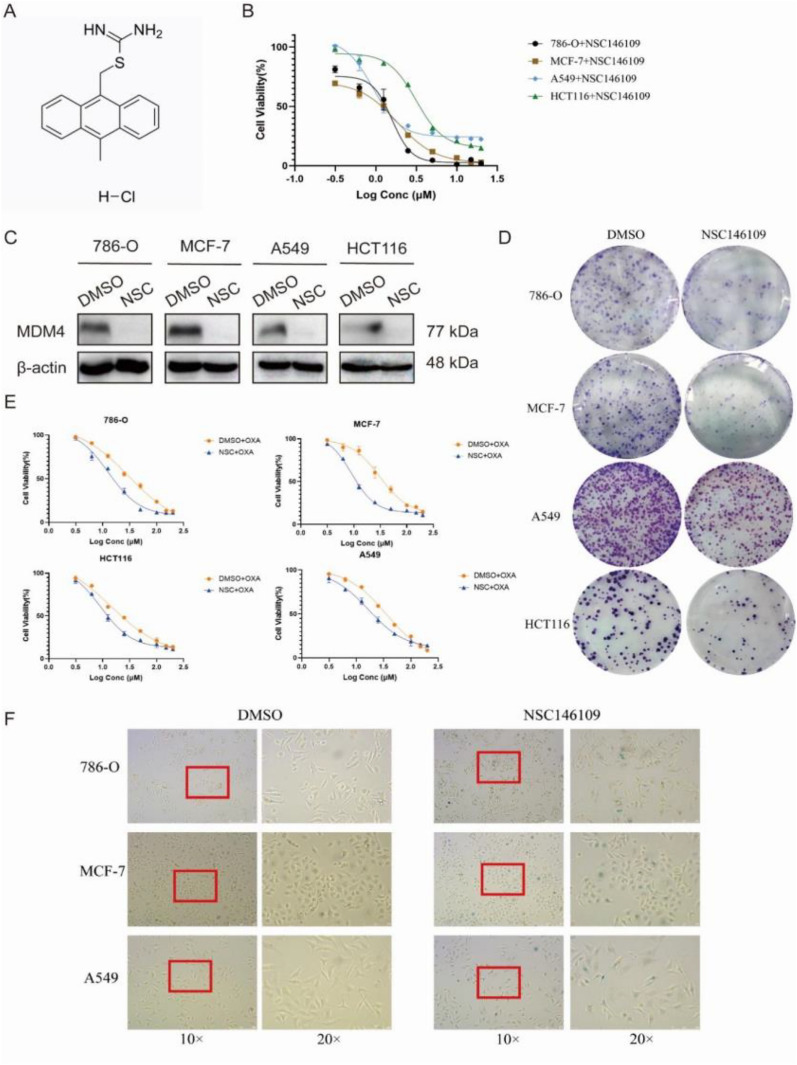
MDM4 is one of the MDM protein family and is generally recognized as the key negative regulator of p53. As a cancer-promoting factor, it plays a non-negligible role in tumorigenesis and development. In this article, we analyzed the expression levels of MDM4 in pan-cancer through multiple databases. We also investigated the correlations between MDM4 expression and prognostic value, immune features, genetic mutation, and tumor-related pathways. We found that MDM4 overexpression is often accompanied by adverse clinical features, poor prognosis, oncogenic mutations, tumor-immune infiltration and aberrant activation of oncogenic signaling pathways. We also conducted transcriptomic sequencing to investigate the effect of MDM4 on transcript levels in colon cancer and performed qPCR to verify this. Finally, we carried out some in vitro experiments including colony formation assay, chemoresistance and senescence-associated β-galactosidase activity assay to study the anti-tumor treatment effect of small molecule MDM4 inhibitor, NSC146109. Our research confirmed that MDM4 is a prognostic biomarker and potential therapeutic target for a variety of malignancies.

Keywords: Inhibitor; MDM4; Pan-cancer; Prognostic biomarker; Tumor-immune infiltration.


Conflict of interest statement

The authors declare that the research was conducted in the absence of any commercial or financial relationships that could be construed as a potential competing interests.

Figures

Fig. 1
Fig. 1
The expression levels of MDM4 in different cancer types. A The differentially expressed MDM4 between normal and tumor samples in TCGA pan-cancer. B Comparisons of MDM4 expression levels in TCGA tumor samples and paired normal controls. C The expression levels of MDM4 in different cell lines using the Cancer Cell Line Encyclopedia database. D Histograms of the MDM4 protein expression levels and examples of Immunohistochemistry images from the Human Protein Atlas. E Representative images from immunohistochemical staining of 10 cases of colon cancer tissues and its corresponding adjacent tissues for MDM4 and their IHC scores. ns, p ≥ 0.05; *, p < 0.05; **, p < 0.01; ***, p < 0.001
Fig. 2
Fig. 2
The correlation between the clinical features and MDM4 expression. A, B and C Receiver Operating Characteristic Curve analysis for the expression levels of MDM4 in COAD, LIHC and STAD. Correlation between the MDM4 expression and pathological stages of STAD D, histologic grading of HNSC E, histological type of CESC F, serum AFP concentration in LIHC G, serum CEA level in COADREAD H, or Gleason score of PRAD I. TPR, True-Positive Rate; FPR, False-Positive Rate; AUC, Area under the Curve; AFP, alpha fetoprotein; CEA, carcinoembryonic antigen
Fig. 3
Fig. 3
Correlations between MDM4 expression and prognostic value. A Forest plot of hazard ratios for overall survival. B and C Kaplan–Meier survival curves for overall survival in ACC and GBLGG. D Forest plot of hazard ratios for disease-specific survival. E and F Kaplan–Meier survival curves for disease-specific survival in GBLGG and LIHC. G Forest plot of hazard ratios for progress-free interval. H and I Kaplan–Meier survival curves for progress-free interval in LIHC and ACC. HR, hazard ratio; CI, confidence interval
Fig. 4
Fig. 4
Genomic alteration analysis of MDM4. A and B Radar charts representing Spearman's correlation coefficients between MDM4 expression and TMB, HRD, LOH, MATH, MSI or Neoantigen. C Overview of the mutational frequency across different tumor types. D Copy number variation analysis of MDM4 expression. E Mutation waterfall plot between the high vs. low MDM4 expression groups. TMB, tumor mutation burden; HRD, homologous recombination deficiency; LOH, loss of heterozygosity; MATH, mutant-allele tumor heterogeneity; MSI, microsatellite instability; DEL, deletion; INS, insertion
Fig. 5
Fig. 5
Correlation of MDM4 expression with immune infiltration in different cancers. A Heat map of Pearson's correlations displaying the level of immune cell infiltration using the TIMER algorithm. B and C Lollipop plots of Spearman's correlations between MDM4 expression and infiltrating immune cells in THYM and PRAD using the ssGSEA algorithm. D Pearson’s correlation analysis for ESTIMATE score in SARC, KIRP and BLCA. SARC, sarcoma; DC, dendritic cell; aDC, activated DC; iDC, immature DC; pDC, plasmacytoid DC; Tcm, T central memory; Tgd, T gamma delta; Tem, T effector memory; TFH, T follicular helper
Fig. 6
Fig. 6
Functional enrichment analysis of MDM4-related genes. A GO enrichment of differentially expressed genes in OSCC. B GO enrichment of differentially expressed genes with logFC values in BRCA. C and D Relevant signaling pathways of MDM4's GSEA in LIHC. E GO enrichment of co-expressed genes in COADREAD; F prediction of MDM4-substrate relationships based on BioGRID database. OSCC, oral squamous cell carcinoma; BP, biological process; CC, cellular component; MF, molecular function; NES, normalized enrichment scores
Fig. 7
Fig. 7
RNA-sequencing indicating immune response when MDM4 is overexpressed. A Volcano plot showing differential gene expression in SW480 cells. B GOCC: immunoglobulin complex. C qPCR validation of selected genes in SW480 and HT29 cells. D Migration of THP1 after co-cultured with stable expressing GFP and MDM4 colon cancer cells SW480. E The relative mRNA expression in THP1 which was co-cultured with stable expressing GFP and MDM4 colon cancer cells SW480. * p < 0.05; **p < 0.01
Fig. 8
Fig. 8
Antitumor efficacy of NSC146109 in kidney, breast, lung and colon cancer cell lines. A Chemical structure formula of NSC146109. B The 50% inhibitory concentration (IC50) of NSC146109 in four cell lines. C Western blot bands of MDM4 protein in four cell lines. D Colony formation assay after treatment with NSC146109. E Cell viability following oxaliplatin exposure detected by CCK8 assay. F Senescence-associated β-galactosidase activity assay after treatment with NSC146109. NSC, NSC146109; OXA, oxaliplatin

Similar articles

Cited by

References

    1. Sung H, Ferlay J, Siegel R, Laversanne M, Soerjomataram I, Jemal A, Bray F. Global cancer statistics 2020: Globocan estimates of incidence and mortality worldwide for 36 cancers in 185 countries. CA Cancer J Clin. 2021;71:209–249. doi: 10.3322/caac.21660. - DOI - PubMed
    1. Moretti F. Mdm genes. In: Schwab M, editor. Encyclopedia of cancer. Berlin, Heidelberg: Springer Berlin Heidelberg; 2017. pp. 2684–2689.
    1. Marine JC, Jochemsen AG. MDMX (MDM4), a promising target for p53 reactivation therapy and beyond. Cold Spring Harb Perspect Med. 2016 doi: 10.1101/cshperspect.a026237. - DOI - PMC - PubMed
    1. Zhang S, Lou J, Li Y, Zhou F, Yan Z, Lyu X, Zhao Y. Recent progress and clinical development of inhibitors that block mdm4/p53 protein-protein interactions. J Med Chem. 2021;64:10621–10640. doi: 10.1021/acs.jmedchem.1c00940. - DOI - PubMed
    1. Wei X, Wu S, Song T, Chen L, Gao M, Borcherds W, Daughdrill G, Chen J. Secondary interaction between MDMX and p53 core domain inhibits p53 DNA binding. Proc Natl Acad Sci USA. 2016;113:E2558–2563. doi: 10.1073/pnas.1603838113. - DOI - PMC - PubMed

MeSH terms