

Acetylmelodorinol isolated from Sphaerocoryne affinis seeds inhibits cell proliferation and activates apoptosis on HeLa cells
- PMID: 38281034
- PMCID: PMC10821558
- DOI: 10.1186/s12906-024-04357-w
Acetylmelodorinol isolated from Sphaerocoryne affinis seeds inhibits cell proliferation and activates apoptosis on HeLa cells
Abstract
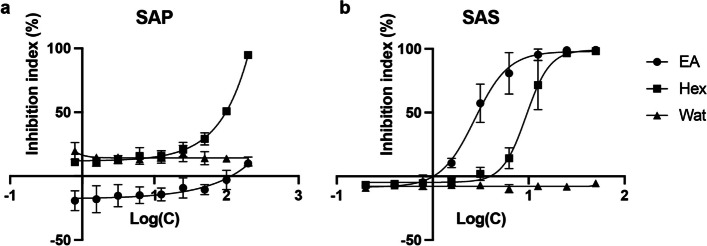
Background: Cervical cancer is a major global health concern with a high prevalence in low- and middle-income countries. Natural products, particularly plant-derived compounds, have shown immense potential for developing anticancer drugs. In this study, we aimed to investigate the anticancer properties of the pericarp and seeds of Sphaerocoryne affinis fruit on human cervical carcinoma cells (HeLa) and isolate the bioactive compound from the active fraction.
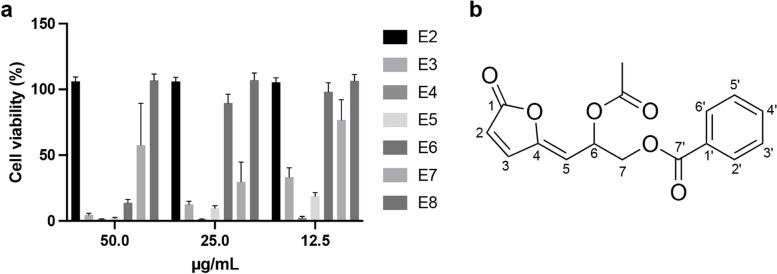
Methods: We prepared solvent fractions from the ethanol extracts of the pericarp and the seed portion by partitioning and assessing their cytotoxicity on HeLa cells. Subsequently, we collected acetylmelodorinol (AM), an anticancer compound, from the ethyl acetate fraction of seeds and determined its structure using nuclear magnetic resonance. We employed cytotoxicity assay, western blotting, Annexin V apoptosis assay, measurement of intracellular reactive oxygen species (ROS) levels, 4',6-diamidino-2-phenylindole (DAPI) staining, and a terminal deoxynucleotidyl transferase dUTP nick end labeling (TUNEL) assay, to evaluate the anticancer properties of AM on HeLa.
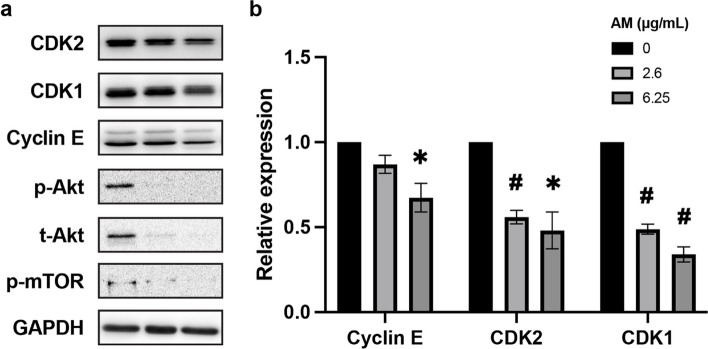
Results: The solvent fractions from the seed displayed considerably higher cytotoxic activity against HeLa cells than those of the pericarp. We isolated and identified acetylmelodorinol as an anticancer compound from the ethyl acetate fraction from S. affinis seed extract. Treatment with acetylmelodorinol inhibited HeLa cell proliferation with an IC50 value of 2.62 ± 0.57 µg/mL. Furthermore, this study demonstrated that acetylmelodorinol treatment disrupted cell cycle progression by reducing the expression of cyclin E, CDK1/2, and AKT/mTOR pathways, increasing the intracellular ROS levels, reducing BCL-2/BCL-XL expression, causing DNA fragmentation and nuclear shrinkage, and triggering apoptosis through caspase 3 and 9 activation in a dose-and time-dependent manner.
Conclusion: In contrast to previous reports, this study focuses on the inhibitory effects of AM on the AKT/mTOR pathway, leading to a reduction in cell proliferation in cervical cancer cells. Our findings highlight the promising potential of acetylmelodorinol as an effective treatment for cervical cancer. Additionally, this study establishes a foundation for investigating the molecular mechanisms underlying AM's properties, fostering further exploration into plant-based cancer therapies.
Keywords: Acetylmelodorinol; Anti-proliferation; Anticancer; Cervical cancer; HeLa cells; Sphaerocoryne affinis.
© 2024. The Author(s).
Conflict of interest statement
The authors declare no competing interests.
Figures


Similar articles
-
Potent anti-cancer activity of Sphaerocoryne affinis fruit against cervical cancer HeLa cells via inhibition of cell proliferation and induction of apoptosis.BMC Complement Med Ther. 2023 Aug 19;23(1):290. doi: 10.1186/s12906-023-04127-0. BMC Complement Med Ther. 2023. PMID: 37598145 Free PMC article.
-
Anticancer activity of Eremanthin against the human cervical cancer cells is due to G2/M phase cell cycle arrest, ROS-mediated necrosis-like cell death and inhibition of PI3K/AKT signalling pathway.J BUON. 2020 May-Jun;25(3):1547-1553. J BUON. 2020. PMID: 32862603
-
Coix lacryma-jobi var. ma-yuen Stapf sprout extract induces cell cycle arrest and apoptosis in human cervical carcinoma cells.BMC Complement Altern Med. 2019 Nov 15;19(1):312. doi: 10.1186/s12906-019-2725-z. BMC Complement Altern Med. 2019. PMID: 31729992 Free PMC article.
-
Ginsenoside Rh2 impedes proliferation and migration and induces apoptosis by regulating NF-κB, MAPK, and PI3K/Akt/mTOR signaling pathways in osteosarcoma cells.J Biochem Mol Toxicol. 2020 Dec;34(12):e22597. doi: 10.1002/jbt.22597. Epub 2020 Aug 6. J Biochem Mol Toxicol. 2020. PMID: 32762018
-
α-Cyperone inhibits the proliferation of human cervical cancer HeLa cells via ROS-mediated PI3K/Akt/mTOR signaling pathway.Eur J Pharmacol. 2020 Sep 15;883:173355. doi: 10.1016/j.ejphar.2020.173355. Epub 2020 Jul 17. Eur J Pharmacol. 2020. PMID: 32687921
Cited by
-
Ethyl Acetate Extract from Romdoul (Sphaerocoryne affinis) Fruit Induced Apoptosis in Human Promyelocytic Leukemia Cells.Glob Adv Integr Med Health. 2024 Oct 23;13:27536130241296826. doi: 10.1177/27536130241296826. eCollection 2024 Jan-Dec. Glob Adv Integr Med Health. 2024. PMID: 39494213 Free PMC article.
References
MeSH terms
Substances
Grants and funding
LinkOut - more resources
Full Text Sources
Medical
Research Materials
Miscellaneous
