. 2024 Apr 24;52(7):3950-3970.
doi: 10.1093/nar/gkae010.

A global survey of small RNA interactors identifies KhpA and KhpB as major RNA-binding proteins in Fusobacterium nucleatum

Affiliations

A global survey of small RNA interactors identifies KhpA and KhpB as major RNA-binding proteins in Fusobacterium nucleatum

Yan Zhu et al. Nucleic Acids Res. .

Abstract

The common oral microbe Fusobacterium nucleatum has recently drawn attention after it was found to colonize tumors throughout the human body. Fusobacteria are also interesting study systems for bacterial RNA biology as these early-branching species encode many small noncoding RNAs (sRNAs) but lack homologs of the common RNA-binding proteins (RBPs) CsrA, Hfq and ProQ. To search for alternate sRNA-associated RBPs in F. nucleatum, we performed a systematic mass spectrometry analysis of proteins that co-purified with 19 different sRNAs. This approach revealed strong enrichment of the KH domain proteins KhpA and KhpB with nearly all tested sRNAs, including the σE-dependent sRNA FoxI, a regulator of several envelope proteins. KhpA/B act as a dimer to bind sRNAs with low micromolar affinity and influence the stability of several of their target transcripts. Transcriptome studies combined with biochemical and genetic analyses suggest that KhpA/B have several physiological functions, including being required for ethanolamine utilization. Our RBP search and the discovery of KhpA/B as major RBPs in F. nucleatum are important first steps in identifying key players of post-transcriptional control at the root of the bacterial phylogenetic tree.


Figures

Graphical Abstract
Graphical Abstract
Figure 1.
Figure 1.
An RNA-centric approach to identify RNA-protein interactions in F. nucleatum. (A) Schematic representation of the 14-mer capture tagged-sRNA affinity purification strategy. (B) Gel images of the sRNA affinity purification performed with tagged 6S RNA incubated with a lysate of a F. nucleatum strain that expresses 3xFLAG-tagged RpoA. Upper panel: Pulldown samples were separated on 8% polyacrylamide gel containing 7 M urea with 1 μg in vitro transcribed 6S RNA as input control. The gel was stained with ethidium bromide. Lower panel: Western blot analysis of pulldown samples with anti-FLAG antibody. (C) Mass spectrometric analysis of the sRNA affinity purification using tagged-6S RNA as bait, with a F. nucleatum WT lysate. Log10 LFQ intensities of the 6S RNA and the control RNA are plotted against the log2 ratio between the 6S RNA versus the control RNA. RNA polymerase components (red) and three highly enriched proteins are labeled. LFQ intensity: label-free quantitation intensity.
Figure 2.
Figure 2.
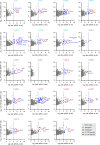
The landscape of sRNA-associated RBPs in F. nucleatum. Mass spectrometric analysis of sRNA affinity purifications with 19 sRNA baits. Log10 LFQ intensities of the bait sRNAs and the control RNA are plotted against the log2 ratios of the sRNAs versus the control. Cut-off for significantly enriched proteins (blue or red dots) was set to log2 ratios ≥4 (dotted line). Interesting protein candidates are labeled. LFQ intensity: label-free quantitation intensity.
Figure 3.
Figure 3.
KhpA and KhpB proteins. (A) Heat map of the log2 ratios of sRNAs versus control pull-downs for KhpA/KhpB based on the mass spectrometric data. Asterisks indicate significant enrichment (log2 ratio ≥ 4). (B) General domain composition of KhpA or KhpB. The KH (K homology) domains are colored orange in KhpA and KhpB proteins, whereas the KhpB Jag-N and R3H domains are colored in green and purple, respectively. (C, D) Gene synteny surrounding khpA (C) or khpB (D) in F. nucleatum and three Gram-positive bacteria (S. pneumoniae, C. difficile, E. faecalis). The gene sequences were obtained from KEGG and gene synteny was visualized with the R package gggenes (version 0.4.0).
Figure 4.
Figure 4.
KhpB binds directly to sRNAs. (A) Western blot analysis of protein samples collected from different steps of the sRNA affinity purification performed with the control RNA, tagged FoxI or tagged FunR2 using anti-KhpB antibody. (B, C) EMSAs using purified KhpA, KhpB-ΔN, or both proteins (1:1 ratio) with FoxI (B) and FunR12 (C). 4 nM of in vitro transcribed and radiolabeled FoxI or FunR12 were incubated with 5 μM of KhpA or increasing concentrations of KhpB, KhpA/B (0, 0.16, 0.32, 0.63, 1.25, 2.5, 5 μM). When the assays were performed with 2.5 or 5 μM KhpB, radioactive signals were observed in the gel wells. Slight RNA degradation was observed at high protein concentrations as well.
Figure 5.
Figure 5.
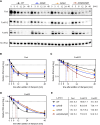
KhpA and KhpB influence the stability of sRNAs. (A) Stability of FoxI, FunR12 and FunR2 in WT, ΔkhpB, ΔkhpA, ΔkhpAΔkhpB strains determined by detection of RNA abundance via northern blot after rifampicin treatment. Samples were collected at 0, 3, 6, 12, 24, 48 min after the addition of rifampicin. 5S rRNA was probed as loading control. The blot is a representative of three experimental replicates. (B–D) Quantifications of FoxI (B), FunR12 (C) and FunR2 (D) decay rates. For quantification, band intensities of the blots were measured with ImageJ. The relative RNA level at time 0 was set to 1. For each time point, the mean value ± SD of the relative RNA levels was plotted. (E) Calculated half-lives of FoxI, FunR12 and FunR2 in WT, ΔkhpB, ΔkhpA and ΔkhpAΔkhpB strains using an exponential one phase-decay model in GraphPad Prism. Mean values ± SD from three replicates are shown.
Figure 6.
Figure 6.
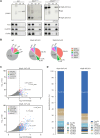
KhpA and KhpB are global RBPs. (A) Detection of immunoprecipitated proteins (upper panel) or RNAs (lower three panel) from the RIP experiment. Upper panel: KhpA-3xFLAG or KhpB-3xFLAG was detected via western blot with a FLAG-specific antibody in lysate (L), flow through (FT), wash (W) and immunoprecipitation fractions (IP). Lower panel: Northern blot detection of FoxI, FunR16 or FunR2. The WT strain was used as a negative control. (B) Pie charts representing the read distribution of the indicated RNA classes in WT, KhpA-3xFLAG and KhpB-3xFLAG RIP-seq experiments. (C) Volcano plots of RNA transcripts enriched by KhpA-3xFLAG and KhpB-3xFLAG in the RIP-seq experiment. DEseq2 was used to determine the enrichment factors between FLAG-tagged strains and the WT control. Cut-off (dashed line) for significantly enriched transcripts was set to log2 fold change ≥2. Significantly enriched transcripts from different RNA classes are highlighted in color. Numbers in parentheses give the number of significantly enriched transcripts belonging to the respective RNA class. (D) Plots showing read distribution of sRNAs associated with KhpA-3xFLAG and KhpB-3xFLAG in the RIP-seq experiment. The percentage indicates the reads of a sRNA compared to all sRNAs in the respective cDNA libraries.
Figure 7.
Figure 7.
KhpA and KhpB regulate gene expression. (A, B) Volcano plots showing differential expression of all genes plotted against the corresponding FDR value in ΔkhpA and ΔkhpB strains in the mid-exponential growth phase (A) or early stationary phase (B). Genes with a log2 fold change ≥ 1 and FDR ≤ 0.05 are considered upregulated and highlighted in red, those with a log2 fold change ≤ -1 and FDR ≤ 0.05 are considered downregulated and shown in blue. Specific transcripts and operons are labelled and color-coded as indicated.
Figure 8.
Figure 8.
KhpA and KhpB affect cell length. (A) Microscopy of WT, deletion strains (ΔkhpA, ΔkhpB, ΔkhpAΔkhpB) and complemented strains (ΔkhpAkhpA-3xFLAG, ΔkhpBkhpB-3xFLAG) in the mid-exponential phase stained with DAPI and the membrane dye FM 4-64. Shown are representative fields of vision for each strain from three biological replicates. For quantification, only cells with a single nucleoid based on DAPI staining were considered (indicated by white triangle). Scale bars = 2 μm. (B) Violin plots of cell length measured from the microscopy images. The number of individual cells that were measured for each strain are indicated. The central dotted line of the violin plot is the median value, upper and lower dotted lines are the interquartile range (IQR). The P-values were obtained relative to WT by one-way ANOVA analysis (GraphPad Prism). ns, not significant, ** P< 0.01, **** P< 0.001.
Figure 9.
Figure 9.
Loss of KhpA and KhpB impacts growth under nutrient limitation. (A, B) Western blot analysis of KhpA (A) and KhpB (B) expression during different growth phases. KhpA was detected with a FLAG specific antibody in the khpA3xFLAG strain. KhpB was detected with a KhpB specific antibody in the WT strain. Coomassie staining is used as loading control. E: early exponential phase (OD600 nm= 0.1), M: mid-exponential phase (OD600 nm= 0.5), S: early stationary phase (OD600 nm= 1). (C, D) Growth curves for WT, deletion (ΔkhpA, ΔkhpB, ΔkhpAΔkhpB) and complemented strains (ΔkhpAkhpA-3xFLAG, ΔkhpBkhpB-3xFLAG) in Columbia broth (B) or CYG medium (C). Mean values of three biological replicates are plotted.
Figure 10.
Figure 10.
KhpB is involved in the regulation of ethanolamine utilization. (A) RNA-seq coverage on the forward strand of the eut operon in WT, ΔkhpA and ΔkhpB (upper panel). Gene loci of eut operon (lower panel). (B) Expression of the eutS and eutL genes was evaluated by qRT-PCR in the indicated strains after transferring the cultures in ethanolamine-containing CYG medium for 2 h. The fold change was normalized to the control, i.e. the RNA level in each strain after growth 2 h in CYG medium without ethanolamine, and plotted as the mean ± SD of three replicates. (C) Growth curves for WT, deletion (ΔkhpA, ΔkhpB, ΔkhpAΔkhpB) and complemented strains (ΔkhpAkhpA-3xFLAG, ΔkhpBkhpB-3xFLAG) in CYG medium supplemented with 25 μM ethanolamine. Mean values of three replicates are plotted.

References

    1. Brennan C.A., Garrett W.S. Fusobacterium nucleatum - symbiont, opportunist and oncobacterium. Nat. Rev. Micro. 2019; 17:156–166. - PMC - PubMed
    1. Komiya Y., Shimomura Y., Higurashi T., Sugi Y., Arimoto J., Umezawa S., Uchiyama S., Matsumoto M., Nakajima A. Patients with colorectal cancer have identical strains of in their colorectal cancer and oral cavity. Gut. 2019; 68:1335–1337. - PMC - PubMed
    1. Kostic A.D., Gevers D., Pedamallu C.S., Michaud M., Duke F., Earl A.M., Ojesina A.I., Jung J., Bass A.J., Tabernero J. et al. . Genomic analysis identifies association of Fusobacterium with colorectal carcinoma. Genome Res. 2012; 22:292–298. - PMC - PubMed
    1. Parhi L., Alon-Maimon T., Sol A., Nejman D., Shhadeh A., Fainsod-Levi T., Yajuk O., Isaacson B., Abed J., Maalouf N. et al. . Breast cancer colonization by Fusobacterium nucleatum accelerates tumor growth and metastatic progression. Nat. Commun. 2020; 11:3259. - PMC - PubMed
    1. Castellarin M., Warren R.L., Freeman J.D., Dreolini L., Krzywinski M., Strauss J., Barnes R., Watson P., Allen-Vercoe E. et al. . Fusobacterium nucleatum infection is prevalent in human colorectal carcinoma. Genome Res. 2012; 22:299–306. - PMC - PubMed

Publication types

MeSH terms