. 2024 Apr 12;52(6):3031-3049.
doi: 10.1093/nar/gkae020.

H2A.Z is involved in premature aging and DSB repair initiation in muscle fibers

Affiliations

H2A.Z is involved in premature aging and DSB repair initiation in muscle fibers

Edwige Belotti et al. Nucleic Acids Res. .

Abstract

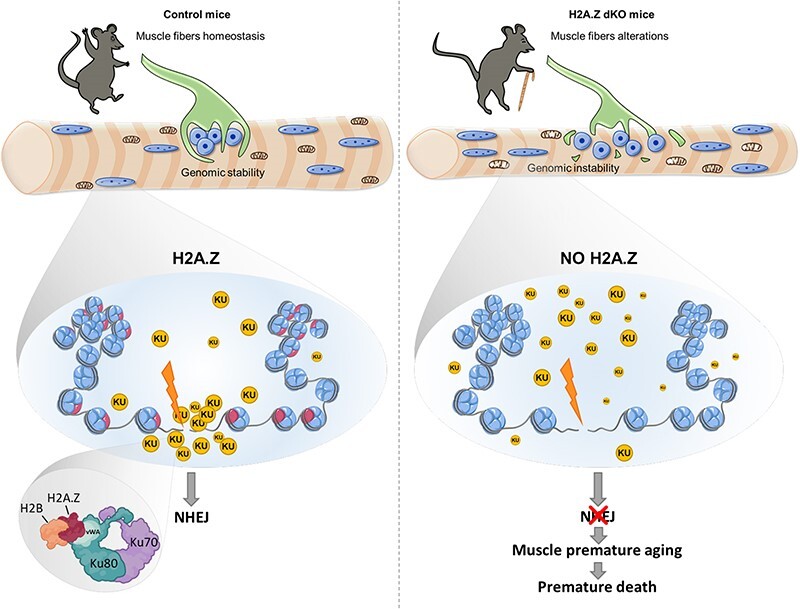
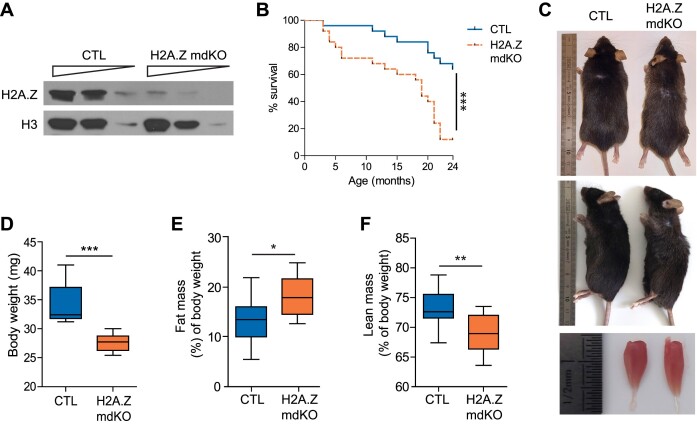
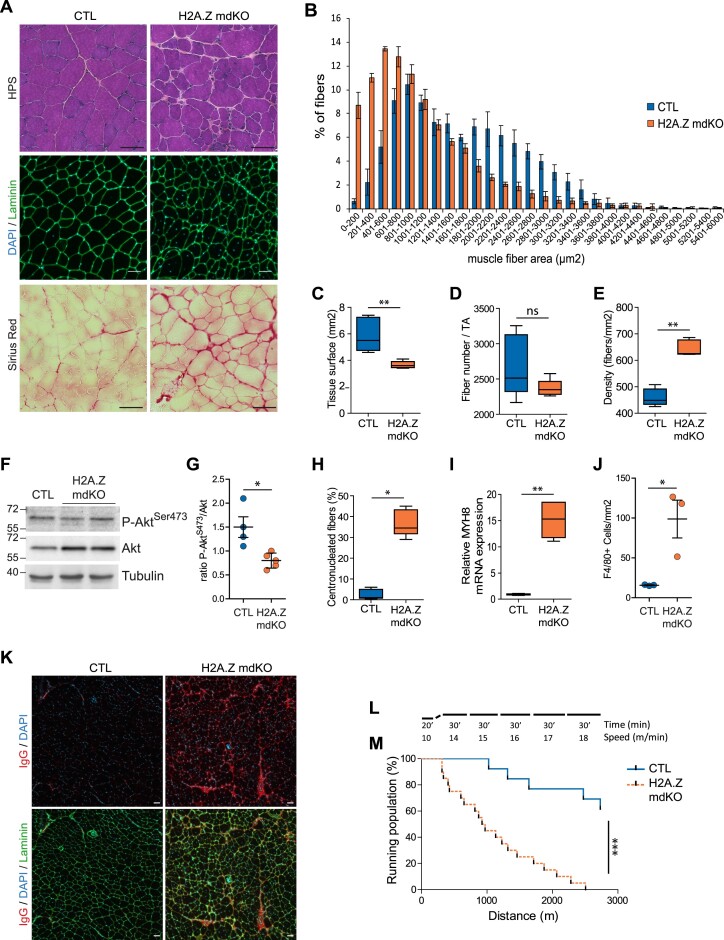
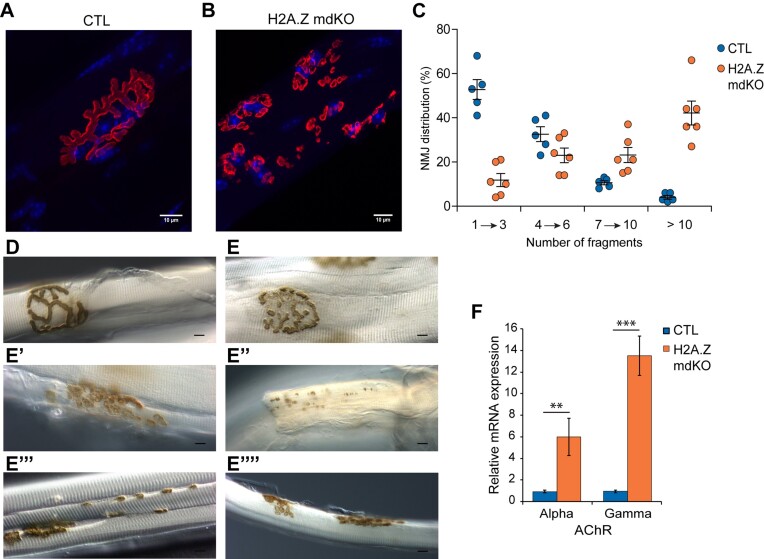
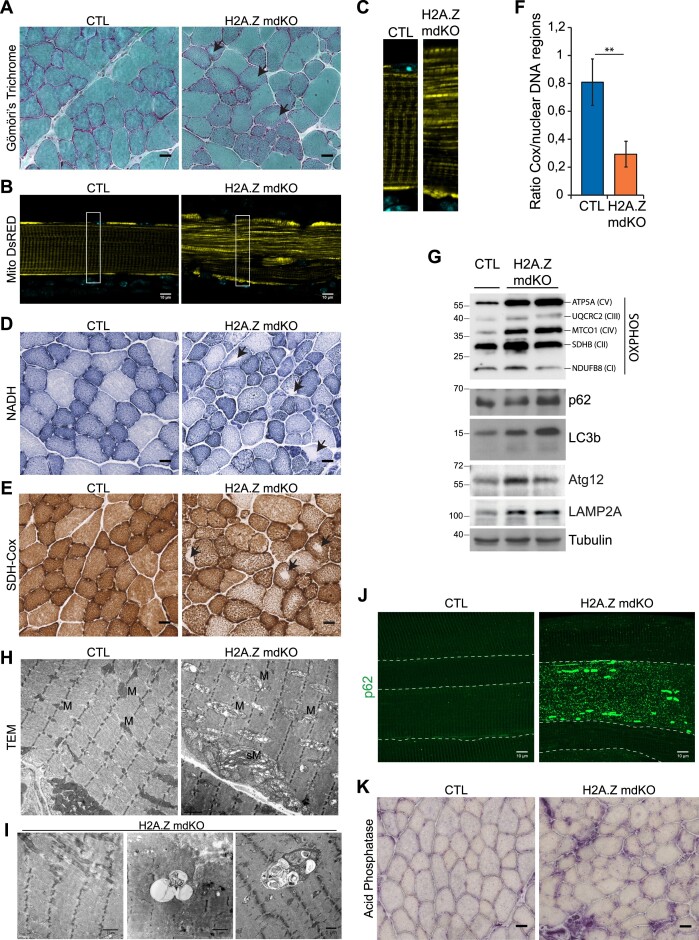
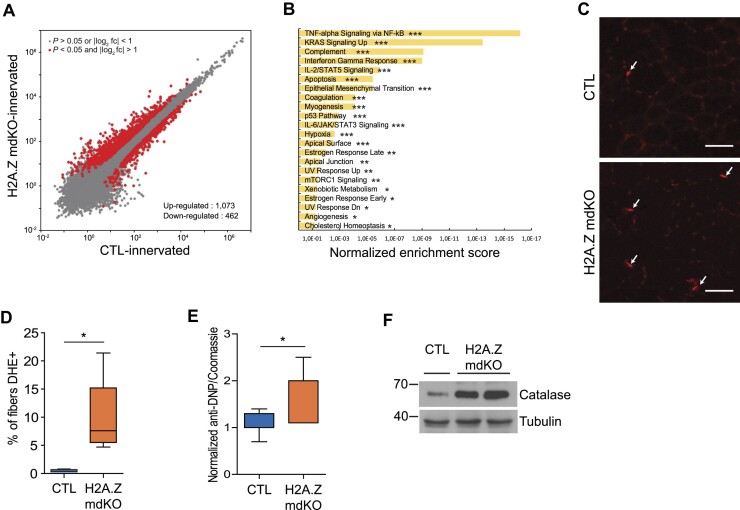
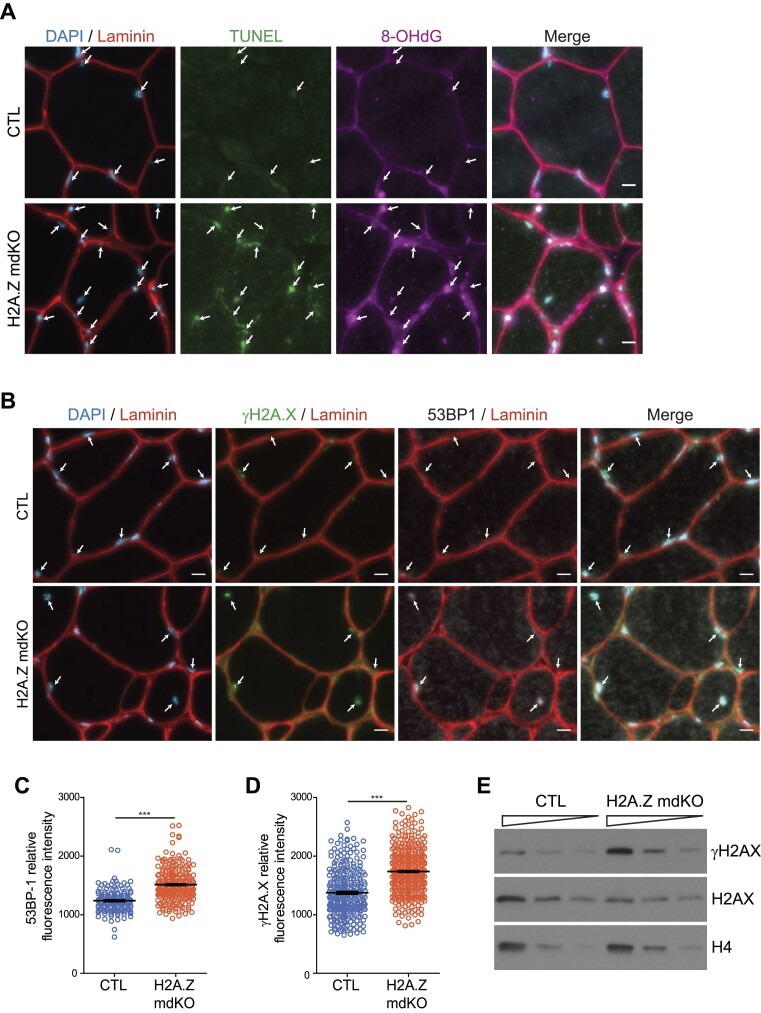
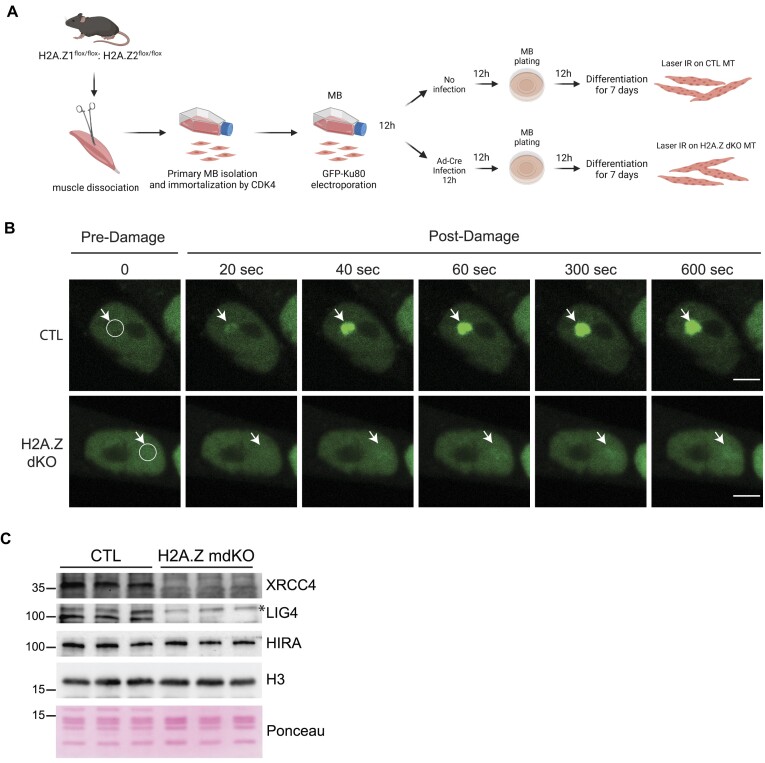
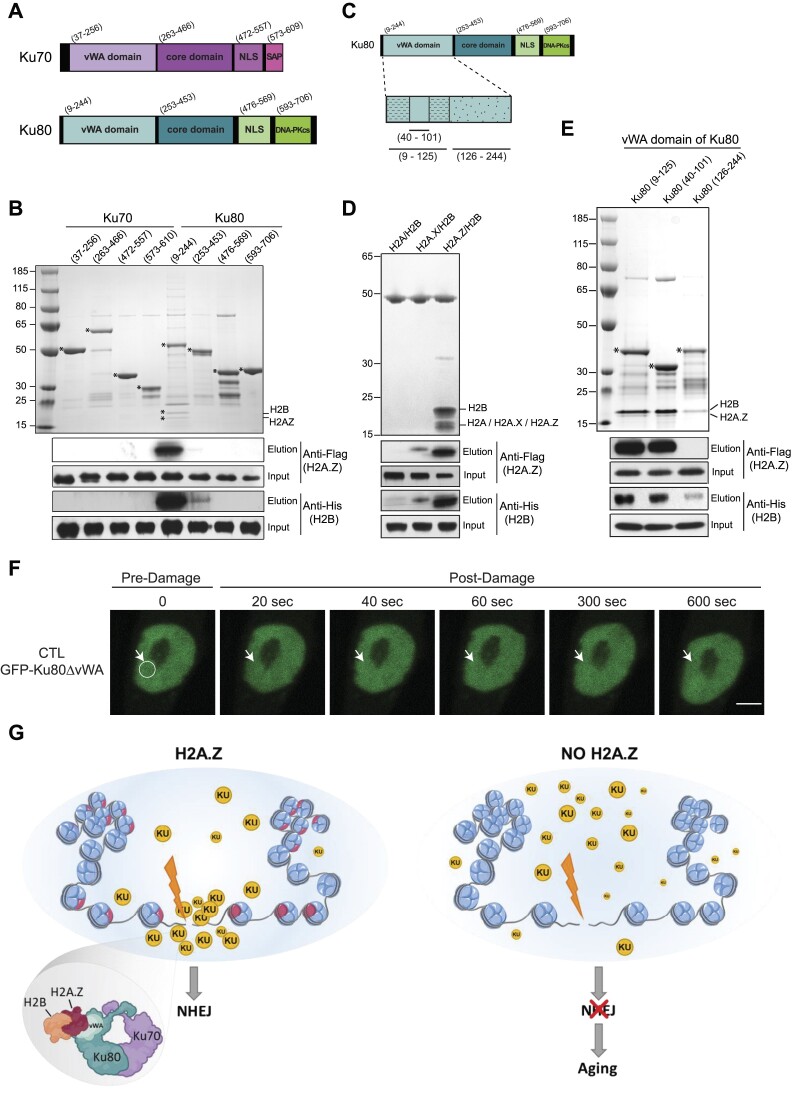
Histone variants are key epigenetic players, but their functional and physiological roles remain poorly understood. Here, we show that depletion of the histone variant H2A.Z in mouse skeletal muscle causes oxidative stress, oxidation of proteins, accumulation of DNA damages, and both neuromuscular junction and mitochondria lesions that consequently lead to premature muscle aging and reduced life span. Investigation of the molecular mechanisms involved shows that H2A.Z is required to initiate DNA double strand break repair by recruiting Ku80 at DNA lesions. This is achieved via specific interactions of Ku80 vWA domain with H2A.Z. Taken as a whole, our data reveal that H2A.Z containing nucleosomes act as a molecular platform to bring together the proteins required to initiate and process DNA double strand break repair.


Figures

Graphical Abstract
Graphical Abstract
Figure 1.
Figure 1.
H2A.Z loss in muscle fibers leads to reduced lifespan and display physical changes. (A) TA muscle extracts from 12-month-old mice were immunoblotted with the indicated antibodies. (B) Kaplan–Meier survival curves of males and females CTL (n = 24) and H2A.Z mdKO (n = 23) mice. The cumulative survival rate was plotted against age in months. The Log-rank test was performed to compare the two mouse groups (***P < 0.0001). (C) Dorsal (upper panel), lateral (middle panel) and dissected tibialis anterior (TA) muscles (lower panel) photographs of 12-month-old mice reveal a thinner body, loss of hair quality, a kyphosis and muscle loss of H2A.Z mdKO mice compare to their CTL littermate. (D) Body weight in 12-old-month males (CTL n = 9; H2A.Z mdKO n = 10). Whole body fat mass (E) and lean mass (F) evaluated by TD-NMR (n = 12, *P < 0.05, Mann–Whitney test).
Figure 2.
Figure 2.
H2A.Z loss in muscle fibers leads to muscle alterations at 12-month-old. (A) Representative image of hematoxylin phloxine saffron (upper panel), laminin/Dapi staining (middle panel) and Sirius Red (lower panel) in transversal sections of TA muscle (scale bar = 50 μm). (B) Quantification of cross-sectional area (CSA) of the whole TA with the measure of tissue surface in μm2 (C). The density (D), and the fiber number per tissue. (E) The data are shown as box-and-whisker plot with tukey style. Statistical analysis was performed using Mann–Whitney test. (*P < 0.05, **P < 0.01, ns: not significant, n = 5 per genotype). (F) Representative immunoblots for phosphorylated and total proteins of PKB/Akt in H2A.Z mdKO and CTL TA muscles. Tubulin was shown as loading control. (G) Densitometry quantification of phosphorylated bands relative to the total bands. Error bars are the SEM calculated from four independent CTL and 5 H2A.Z mdKO. Statistical analysis was performed using Mann–Whitney test. (*P < 0.05; ns: not significant). (H) Percentage of centronucleated fibers. (I) Relative mRNA expression of the regenerative marker MYH8. The data are shown as box-and-whisker plot with tukey style. Statistical analysis was performed using Mann–Whitney test (*P < 0.05, **P < 0.01, ns: not significant, n = 5 per genotype). (J) Quantification of F4/80+ cells/mm2 in the CTL and H2A.Z mdKO TA muscles. Error bars are the SEM calculated from 3 mice per group. Statistical analysis was performed using unpaired t test (*P < 0.05). (K) Representative images of IgG immunostaining in CTL and H2A.Z mdKO TA muscles. (L) Protocol of exercise to exhaustion test on the treadmill. (M) Percentage of running population on the treadmill by the distance of CTL (n = 13) and H2A.Z mdKO (n = 20) mice. The Log-rank test was performed to compare the two mouse groups (***P < 0.0001).
Figure 3.
Figure 3.
H2A.Z loss in muscle fibers leads to NMJ alterations. α-BTX staining of post-synaptic nAChRs (red) with nuclei (blue) in CTL (A) and H2A.Z mdKO (B) mice of 12-month-old. (C) Percentage of NMJ distribution in function of fragment number. Acethylcholinesterase activity by Koelle staining of CTL (D) and H2A.Z mdKO (E–E’’’’) mice. Neocluster of AChRs (E’’), «en passante» junction (E’’’) and double-innervated fiber (E’’’’) in H2A.Z mdKO mice (n = 5 CTL and 6 H2A.Z mdKO). (F) Relative mRNA expression of nAChRs subunits (n = 3; unpaired t-test, **P < 0.01, ***P < 0.001).
Figure 4.
Figure 4.
H2A.Z loss exhibits enhanced mitochondrial alteration. Transversal sections stained with Modified Gomori's Trichrome (A), NADH (D), SDH-Cox (E) and acid phosphatase (K) (scale bar 20μm). Black arrows indicate fibers with abnormal mitochondria distribution. (B) Fibers electroporated with MitoDsRed (false color: yellow) in CTL and H2A.Z mdKO mice, and with higher magnification (C). (F) Mitochondrial DNA content determined on DNA from CTL and H2A.Z mdKO mice by quantitative PCR analysis using primers for COX2 (mitochondrial gene) and 3 nuclear control genes (n = 3, unpaired t-test, **P< 0.01). (G) Immunoblot analysis of steady-state levels of respiratory chain subunits, autophagic and lysosomal components in TA lysates of CTL and H2A.Z mdKO mice. (H) Representative electron microscopy of CTL and H2A.Z mdKO mice muscle structure of longitudinal sections. M: mitochondria, sM: subsarcollema mitochondria. (I) Representative tissue abnormalities observed in H2A.Z mdKO mice with a higher proportion: of minicore (left) and autophagic vacuoles with debris and multilamellar material (middle and right). (J) Representative immunostaining of p62 on EDL myofibers of CTL and H2A.Z mdKO mice. Each fiber is delimited by a dash line (scale bar: 10 μm).
Figure 5.
Figure 5.
H2A.Z loss leads to the transcriptional signature of premature aging and oxidative damages. (A) Scatter plots comparing global gene expression levels between CTL and H2A.Z mdKO in TA muscle of 12-month-old mice. (B) Bar plots of significant MSigDB hallmark signatures of up-regulated genes with a log2FC (H2A.Z mdKO/CTL) > 1 and P-value adjusted < 0.05. MSigDB Hallmark pathway enrichment was analyzed using Enrichr server (Bonferroni adjusted P-value: *P < 0.1; **P < 0.05; ***P < 0.001). Data are from three biologically independent replicates. (C) DHE staining of tibialis anterior muscle section of CTL and H2A.Z mdKO mice and quantification of nuclei with high DHE intensity (D) (n = 5; scale bar = 50 μm). (E) Protein carbonylation was detected by Oxyblot assay. TA muscle extracts were derivatized with DNP and oxidized proteins were detected by western blot analysis using an anti-DNP antibody. The histogram represents the quantification and normalization of the anti-DNP on the coomassie staining (n = 3 CTL and 4 H2A.Z mdKO). (F) Representative western blot of Catalase expression in CTL and H2A.Z mdKO TA muscle. Tubulin was used as loading control.
Figure 6.
Figure 6.
H2A.Z loss leads to increase DNA damages. (A) Representative image of TUNEL (A488) and 8-OHdG (A647) staining in transversal sections of TA muscle. (B) Representative image of 53BP1 and γH2A.X staining (scale bar 10 μm). Each myonucleus is spotted with an arrow. (C, D) Quantification of the fluorescence intensity of each myonucleus on 500 μm2 of the 53BP1 (C) and γH2A.X staining (D). (Error bars are the SEM calculated from 4 mice per group, Mann–Whitney test ***P< 0.0001). (E) Representative Western blot analysis of total protein extract of 12-month-old TA muscle from CTL and H2A.Z mdKO mice immunoblotted with H2AX and γH2AX. H4 was used as loading control.
Figure 7.
Figure 7.
H2A.Z is necessary for GFP-Ku80 recruitment at DNA lesions sites. (A) Scheme of the sequential steps to obtain immortalized myoblasts (MB) and differentiated myotubes (MT) expressing the GFP-Ku80 in presence or absence of both H2A.Z for Frap analysis. (B) Accumulation of GFP-Ku80 after laser irradiation in CTL or H2A.Z dKO nuclei of seven-day differentiated myotubes. The damaged area has been delimited by a circle area and was spotted with a white arrow for each time point (scale bar 5 μm). (C) Chromatin extract fraction of isolated muscle nuclei immunoblotted with the indicated antibodies.
Figure 8.
Figure 8.
The von Willebrand factor type A domain of Ku80 recognizes and binds specifically to H2A.Z/H2B histone dimer. (A) Functional domains of Ku70 and Ku80 proteins. Both proteins consist of an N-terminal von Willebrand factor type A (vWA) domain, a central DNA binding core domain and a nuclear localization sequence (NLS). C-terminal domain of Ku70 comprises an SAP (SAF-A/B, Acinus and PIAS) domain while C-terminal domain Ku80 comprises of sequence responsible for binding with DNA-PKcs. (B) The various deletion mutants of Ku70 and Ku80 fused to GST were assayed for interaction with H2A.Z/H2B histone dimer using GST pull-down assays. The eluates were analyzed by both SDS PAGE (top panel) and Western blotting (bottom panels). (C) Schematic representation of the different deletion mutants of the vWA domain of Ku80 analyzed in GST pull-down assays. (D) GST pull-down assays using GST-tagged vWA domain (09–244) of Ku80 as bait. Upper panel, the vWA domain of Ku80 specifically interacts with H2A.Z/H2B but not with H2A/B or H2A.X/H2B dimers. Lower panels, immunoblotting using anti-Flag (H2A, H2A.X or H2A.Z) and antis-His (H2B) antibodies. (E) Same as in (B) using different the GST tagged subdomains of vWA domain presented in C. (F) Accumulation of GFP-Ku80ΔvWA domain after laser irradiation in CTL nuclei of seven-day differentiated myotubes. The damaged area has been delimited by a circle area and was spotted with a white arrow for each time point (scale bar 5 = μm). (G) Schematic representation of the role of the H2A.Z nucleosome in the repair of DSBs in muscle fibres.

References

    1. Luger K. Crystal structure of the nucleosome core particle at 2.8 Å resolution. Nature. 1997; 389:251–260. - PubMed
    1. Ausió J. Histone variants–the structure behind the function. Brief. Funct. Genomic. Proteomic. 2006; 5:228–243. - PubMed
    1. Doyen C.-M., An W., Angelov D., Bondarenko V., Mietton F., Studitsky V.M., Hamiche A., Roeder R.G., Bouvet P., Dimitrov S.. Mechanism of polymerase II transcription repression by the histone variant macroH2A. Mol. Cell Biol. 2006; 26:1156–1164. - PMC - PubMed
    1. Ouararhni K., Hadj-Slimane R., Ait-Si-Ali S., Robin P., Mietton F., Harel-Bellan A., Dimitrov S., Hamiche A.. The histone variant mH2A1.1 interferes with transcription by down-regulating PARP-1 enzymatic activity. Genes Dev. 2006; 20:3324–3336. - PMC - PubMed
    1. Cheema M.S., Ausió J.. The structural determinants behind the epigenetic role of histone variants. Genes (Basel). 2015; 6:685–713. - PMC - PubMed