. 2024 Apr 5:968:176343.
doi: 10.1016/j.ejphar.2024.176343. Epub 2024 Jan 26.

Phenanthroline relaxes uterine contractions induced by diverse contractile agents by decreasing cytosolic calcium concentration

Affiliations

Phenanthroline relaxes uterine contractions induced by diverse contractile agents by decreasing cytosolic calcium concentration

Mingzi Qu et al. Eur J Pharmacol. .

Abstract

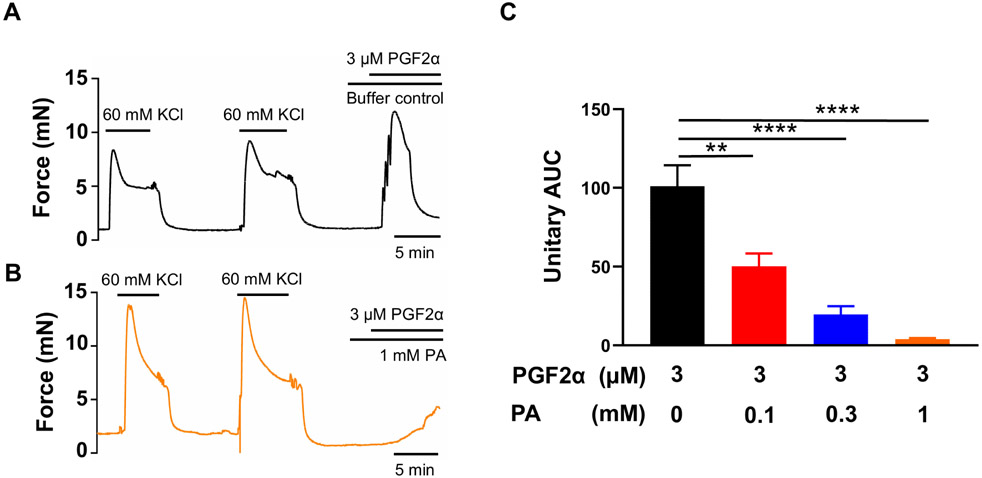
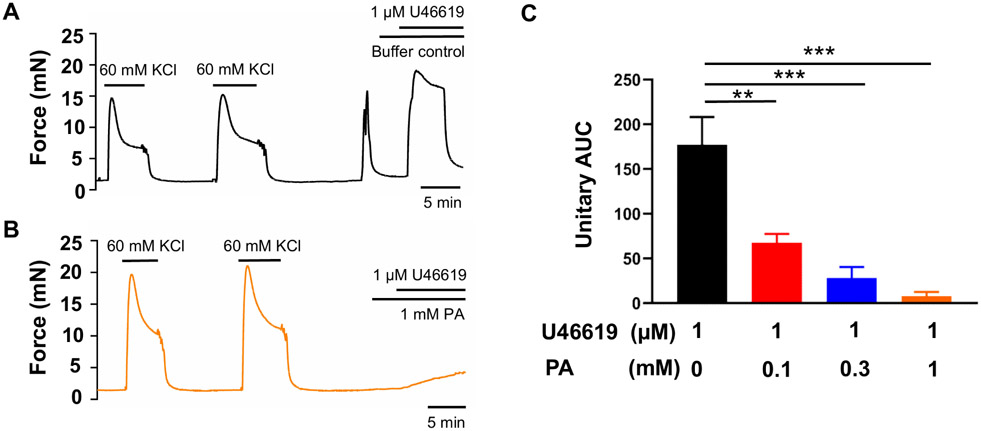
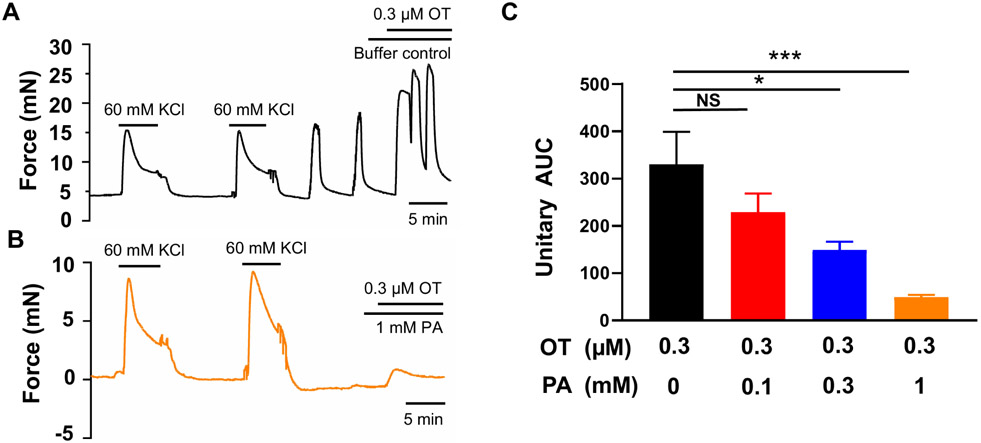
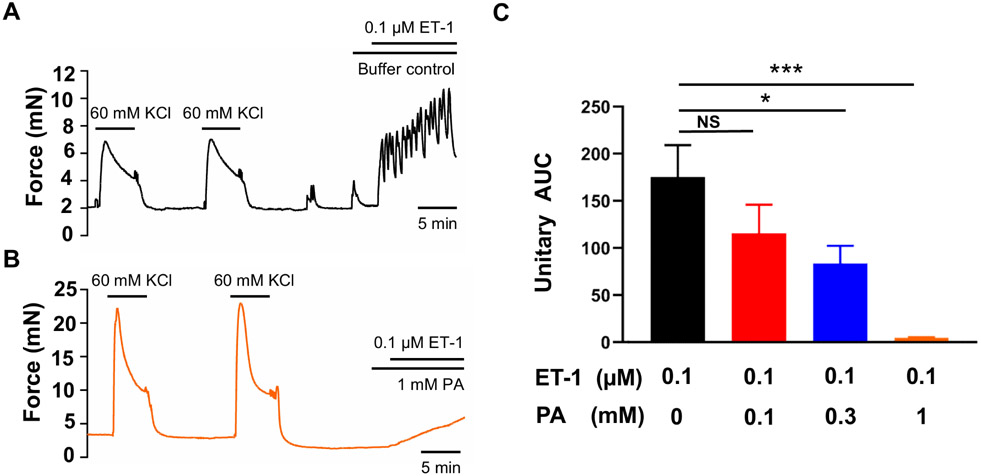
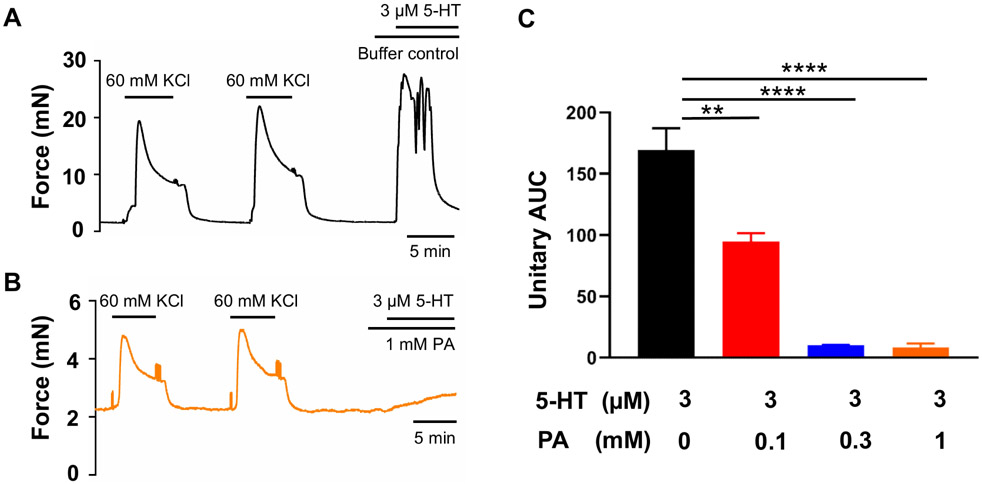
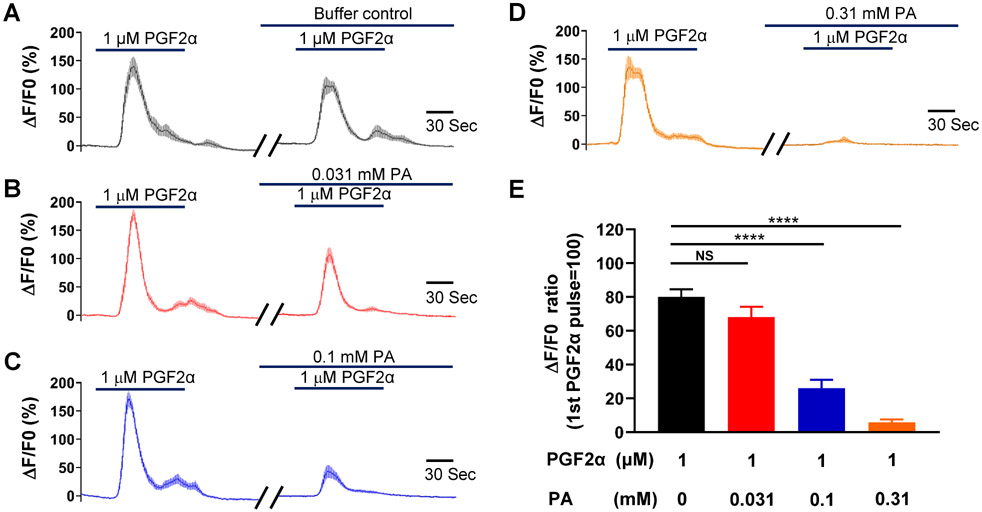
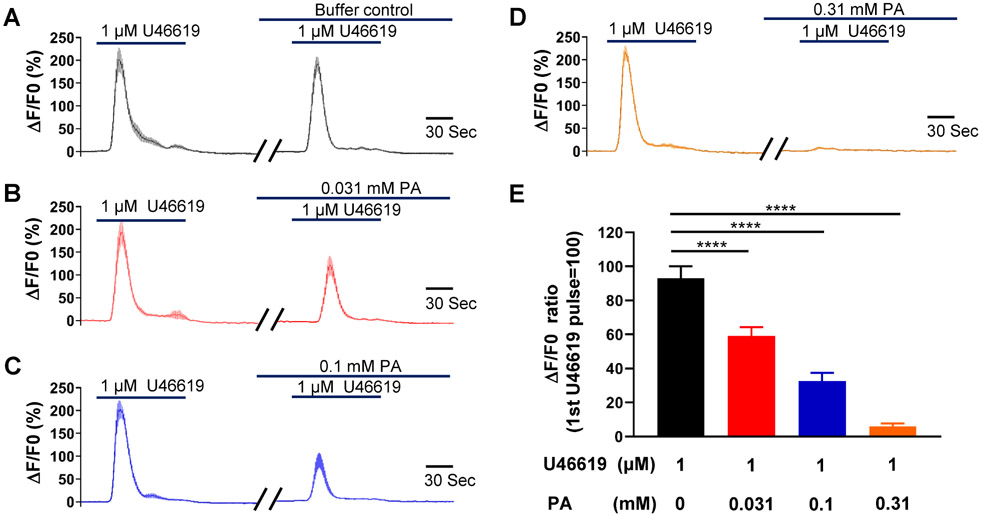
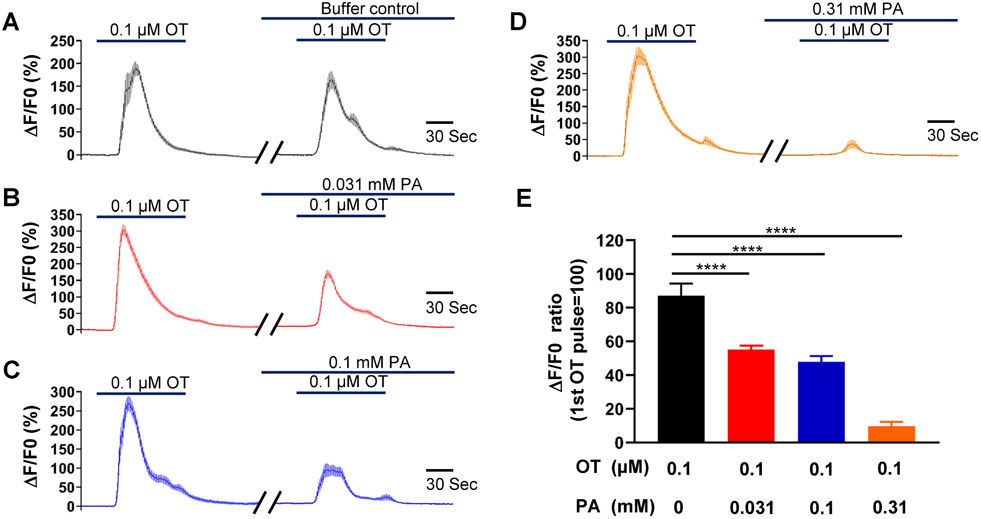
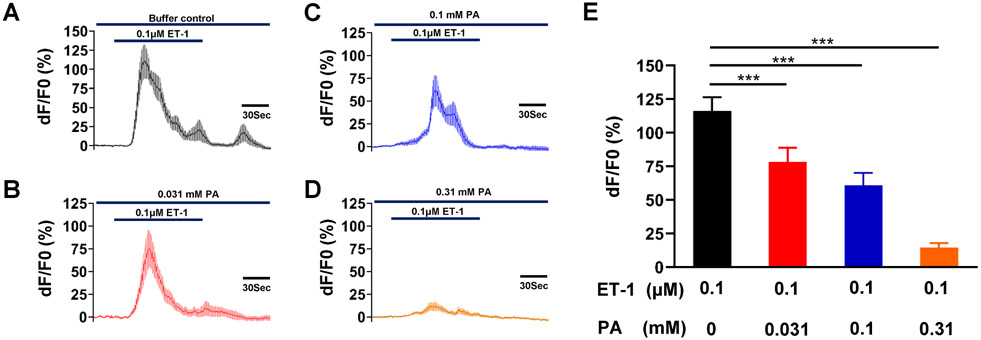
Uterine contractions during labor and preterm labor are influenced by a complex interplay of factors, including hormones and inflammatory mediators. This complexity may contribute to the limited efficacy of current tocolytics for preterm labor, a significant challenge in obstetrics with 15 million cases annually and approximately 1 million resulting deaths worldwide. We have previously shown that the myometrium expresses bitter taste receptors (TAS2Rs) and that their activation leads to uterine relaxation. Here, we investigated whether the selective TAS2R5 agonist phenanthroline can induce relaxation across a spectrum of human uterine contractions and whether the underlying mechanism involves changes in intracellular Ca2+ signaling. We performed experiments using samples from pregnant women undergoing scheduled cesarean delivery, assessing responses to various inflammatory mediators and oxytocin with and without phenanthroline. Our results showed that phenanthroline concentration-dependently inhibited contractions induced by PGF2α, U46619, 5-HT, endothelin-1 and oxytocin. Furthermore, in hTERT-infected human myometrial cells exposed to uterotonics, phenanthroline effectively suppressed the increase in intracellular Ca2+ concentration induced by PGF2α, U46619, oxytocin, and endothelin-1. These results suggest that the selective TAS2R5 agonist may not only significantly reduce uterine contractions but also decrease intracellular Ca2+ levels. This study highlights the potential development of TAS2R5 agonists as a new class of uterine relaxants, providing a novel avenue for improving the management of preterm labor.

Keywords: Bitter taste receptors; Phenanthroline; Preterm birth; Uterine contraction; Uterine relaxant.


Conflict of interest statement

Declaration of competing interest All authors declare that there are no conflicts of interest associated with the content of this paper.

Figures

Figure 1.
Figure 1.. TAS2R5 agonist phenanthroline (PA) concentration-dependently inhibits PGF2α-induced human uterine contractions.
Representative traces of uterine strip tension changes in response to 3 μM PGF2α in the absence of PA (A), and in its presence at 1 mM (B). (C) Summarized results of PA’s inhibition of PGF2α-induced contraction. Data are represented as means ± SEM (n= 6 strips from 6 donors) and expressed as unitary AUC, i.e., AUC/treatment duration for PGF2α /AUC/treatment duration for 2nd KCl x 100. **P < 0.01; ****P < 0.0001 by the post hoc dunnett's test following ANOVA at the statistically significant level.
Figure 2.
Figure 2.. Phenanthroline (PA) concentration-dependently inhibits U46619-induced human uterine contractions.
Representative traces of uterine strip tension changes in response to 1 μM U46619 in the absence of PA (A), and in its presence at 1 mM (B). (C) Summarized results of PA’s inhibition of U46619-induced contraction. Data are represented as means ± SEM (n= 6 strips from 6 donors) and expressed as unitary AUC as defined in the Methods and Figure 1. **P < 0.01; ***P < 0.001 by the post hoc dunnett's test following ANOVA at the statistically significant level.
Figure 3.
Figure 3.. Phenanthroline (PA) concentration-dependently inhibits oxytocin (OT)-induced human uterine contractions.
Representative traces of uterine strip tension changes in response to 0.3 μM OT in the absence of PA (A), and in its presence at 1 mM (B). (C) Summarized results of PA’s inhibition of OT-induced contraction. Data are means ± SEM (n= 5 strips from 5 donors) and expressed as unitary AUC as defined in the Methods and Figure 1. NS, P>0.05; *P < 0.05; ***P < 0.001 by the post hoc dunnett's test following ANOVA at the statistically significant level.
Figure 4.
Figure 4.. Phenanthroline (PA) concentration-dependently inhibits ET-1-induced human uterine contractions.
Representative traces of uterine strip tension changes in response to 0.1 μM ET-1 in the absence of PA (A), and in its presence at 1 mM (B). (C) Summarized results of PA’s inhibition of ET-1-induced contraction. Data are means ± SEM (n= 5 strips from 5 donors) and expressed unitary AUC as defined in the Methods and Figure 1. NS, P>0.05; *P < 0.05; ***P < 0.001 the post hoc dunnett's test following ANOVA at the statistically significant level.
Figure 5.
Figure 5.. Phenanthroline (PA) concentration-dependently inhibits 5-HT-induced human uterine contractions.
Representative traces of uterine strip tension changes in response to 3 μM 5-HT in the absence of PA (A), and in its presence at 1 mM (B). (C) Summarized results of PA’s inhibition of 5-HT-induced contraction. Data are means ± SEM (n= 5 strips from 5 donors) and expressed unitary AUC as defined in the Methods and Figure 1. **P < 0.01; ****P < 0.0001 by the post hoc dunnett's test following ANOVA at the statistically significant level.
Figure 6:
Figure 6:. Phenanthroline (PA) concentration-dependently inhibits PGF2α-induced increase in intracellular calcium in hTERT-HM cells.
Time courses of calcium concentration changes in response to 1 μM PGF2α in the absence of PA (A), and in its presence at 0.031 mM (B), 0.1 mM (C), and 0.31 mM (D). The gaps between two PGF2α treatments were 15 min. (E) Summarized results of PA’s inhibition of PGF2α-induced increase in cytosolic calcium level. Data are means ± SEM (n = 20-28 cells) and expressed as the ratio of calcium increase peak induced by the second PGF2α application to that induced by the first PGF2α in A-D. NS, P >0.05; ****P < 0.0001 by the post hoc dunnett's test following ANOVA at the statistically significant level.
Figure 7:
Figure 7:. Phenanthroline (PA) concentration-dependently inhibits U46619-induced increase in intracellular calcium in hTERT-HM cells.
Time courses of calcium concentration changes in response to 1 μM U46619 in the absence of PA (A), and in its presence at 0.031 mM (B), 0.1 mM (C), and 0.310 mM (D). The gaps between two U46619 treatments are 15 min. (E) Summarized results on PA’s inhibition of U46619-induced increase in cytosolic calcium level. Data are means ± SEM (n = 20-30 cells) and expressed as the ratio of calcium increase peak by the second U46619 application to that by the first U46619 application in A-D. ****P < 0.0001 by the post hoc dunnett's test following ANOVA at the statistically significant level.
Figure 8:
Figure 8:. Phenanthroline (PA) concentration-dependently inhibits oxytocin (OT)-induced increase in cytosolic calcium concentration in hTERT-HM cells.
Time courses of calcium concentration changes in response to 0.1 μM OT in the absence of PA (A), and in its presence at 0.031 mM (B), 0.1 mM (C), and 0.31 mM (D). (E) Summarized results of PA’s inhibition of OT-induced increase in cytosolic calcium level. Data are means ± SEM (n = 20-28 cells) and expressed as the ratio of calcium increase peak induced by the second OT application to that induced by the first OT application in A-D. ****P < 0.0001 by the post hoc dunnett's test following ANOVA at the statistically significant level.
Figure 9:
Figure 9:. Phenanthroline (PA) concentration-dependently inhibits ET-1-induced increase in cytosolic calcium concentration in hTERT-HM cells.
Time courses of calcium concentration changes in response to 0.1 μM ET-1 in the absence of PA (A), and in its presence at 0.031 mM (B), 0.1 mM (C), and 0.310 mM (D). (E) A comparison of the averaged calcium peaks calculated from the cells similar to those shown in A-D. Data are means ± SEM; n = 20 cells. *P<0.05, ****P < 0.0001 by the post hoc dunnett's test after ANOVA at the statistically significant level.

Similar articles

Cited by

References

    1. Aguilar HN, Mitchell BF, 2010. Physiological pathways and molecular mechanisms regulating uterine contractility. Hum Reprod Update 16, 725–744. - PubMed
    1. Arman BM, Binder NK, de Alwis N, Kaitu'u-Lino TJ, Hannan NJ, 2023. Repurposing existing drugs as a therapeutic approach for the prevention of preterm birth. Reproduction 165, R9–R23. - PubMed
    1. Avau B, Depoortere I, 2016. The bitter truth about bitter taste receptors: beyond sensing bitter in the oral cavity. Acta Physiol (Oxf) 216, 407–420. - PubMed
    1. Behrens M, Lang T, 2022. Extra-Oral Taste Receptors-Function, Disease, and Perspectives. Front Nutr 9, 881177. - PMC - PubMed
    1. Behrens M, Meyerhof W, 2009. Mammalian bitter taste perception. Results Probl Cell Differ 47, 203–220. - PubMed