. 2024 Mar:234:102575.
doi: 10.1016/j.pneurobio.2024.102575. Epub 2024 Jan 26.

The Reelin receptor ApoER2 is a cargo for the adaptor protein complex AP-4: Implications for Hereditary Spastic Paraplegia

Affiliations

The Reelin receptor ApoER2 is a cargo for the adaptor protein complex AP-4: Implications for Hereditary Spastic Paraplegia

Mario O Caracci et al. Prog Neurobiol. 2024 Mar.

Erratum in

Abstract

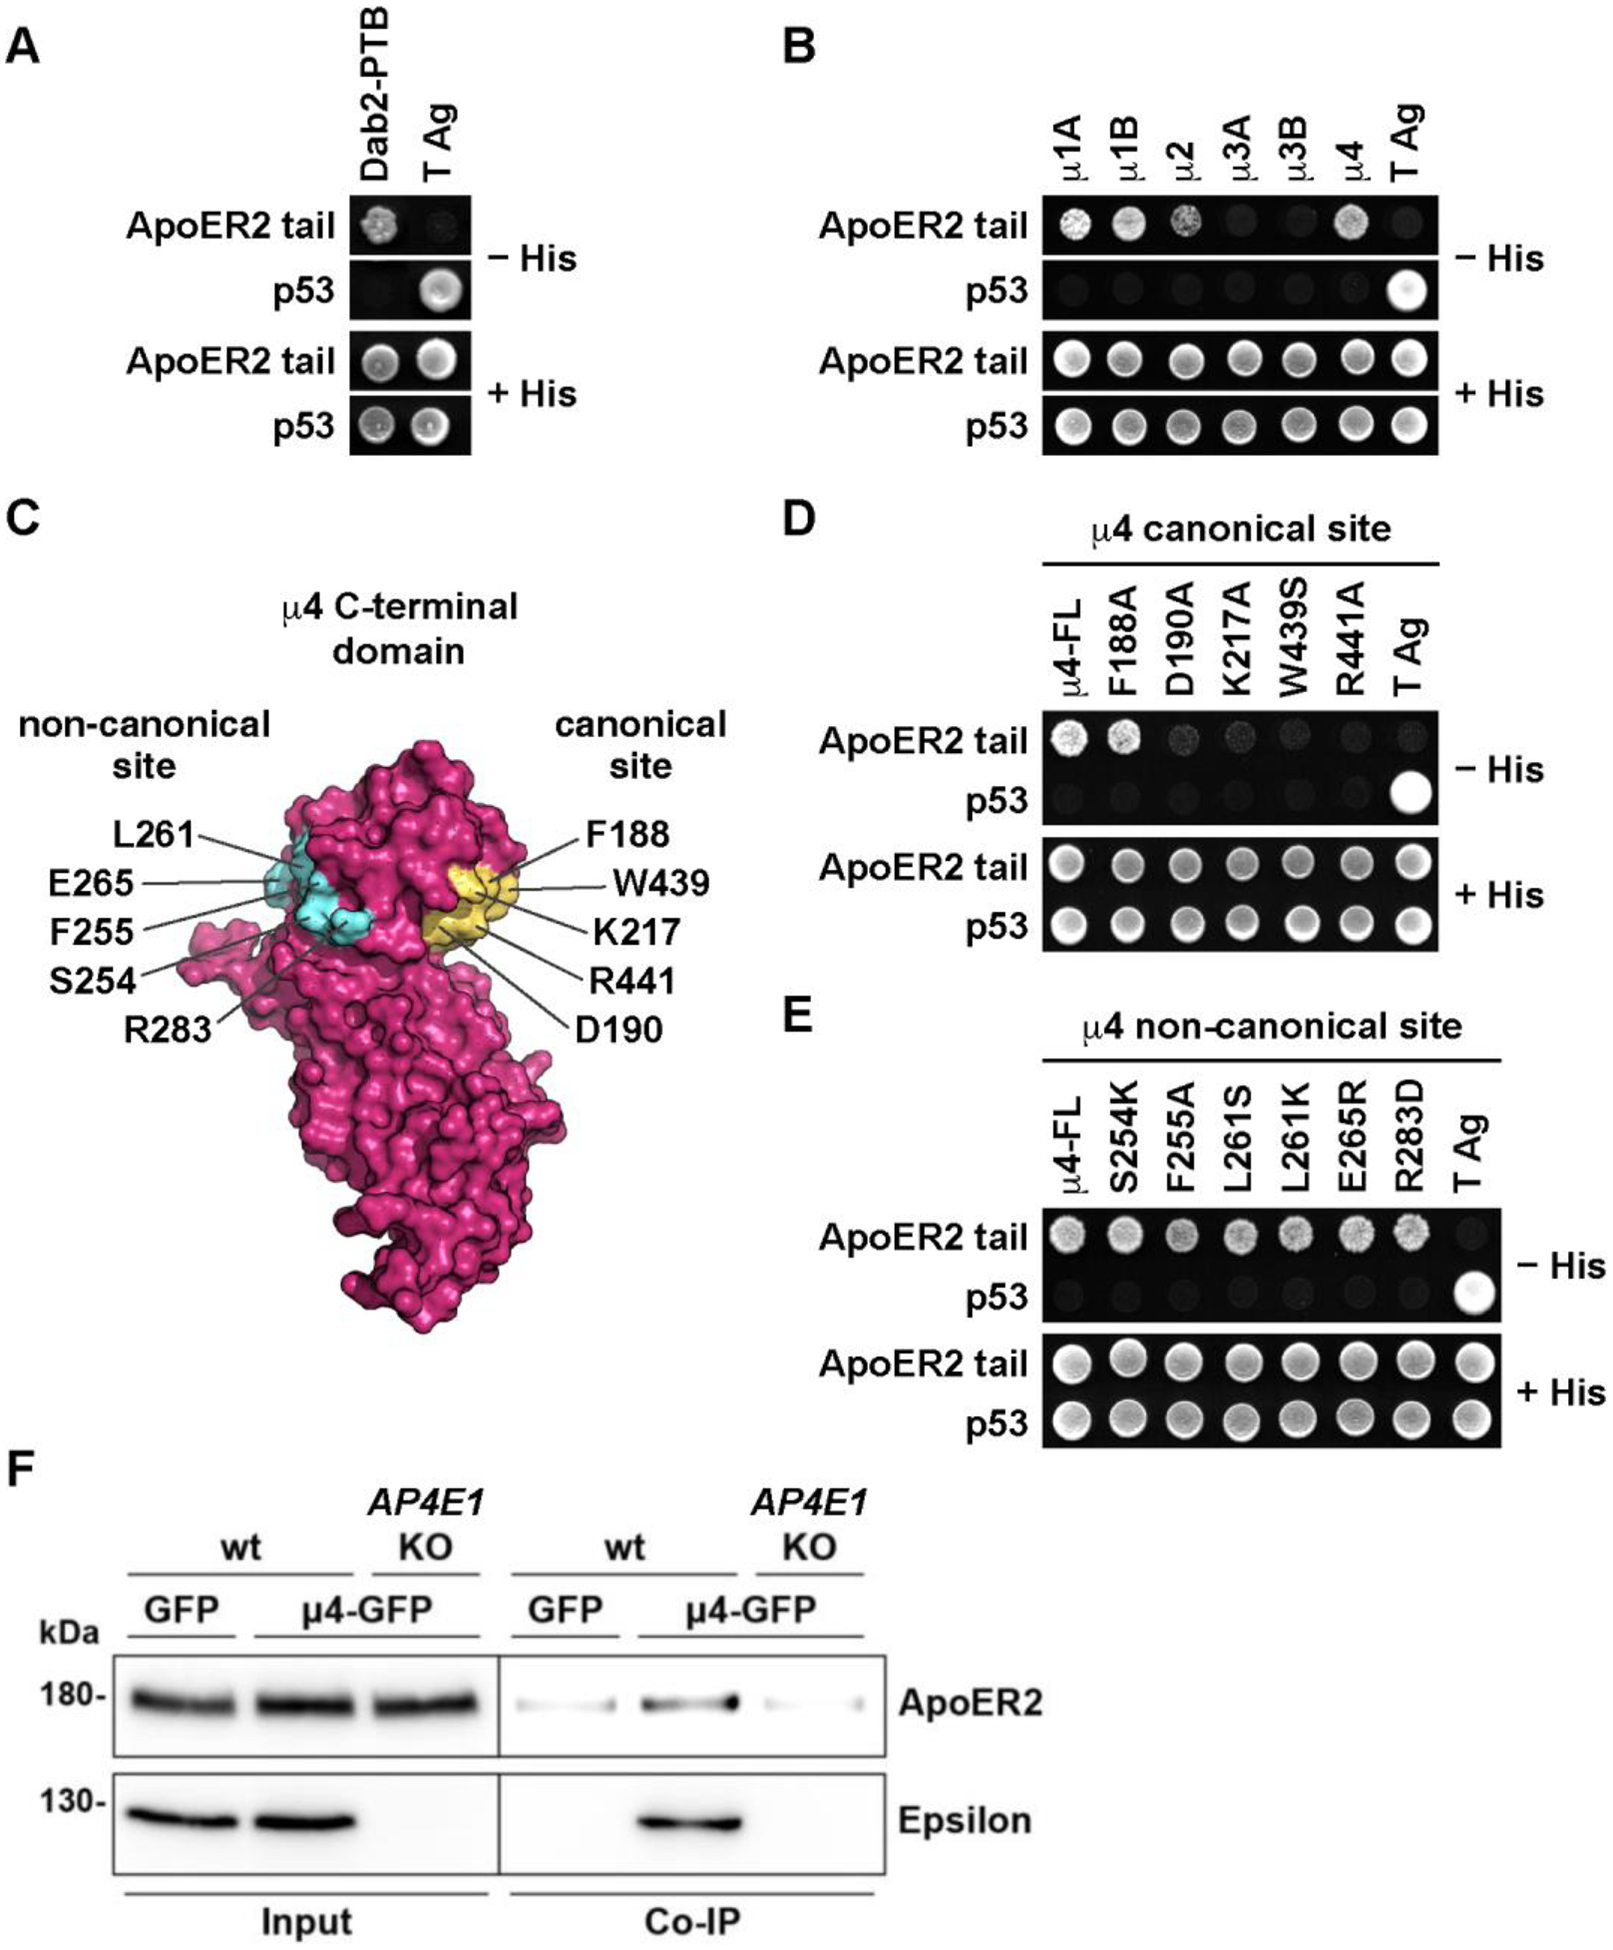
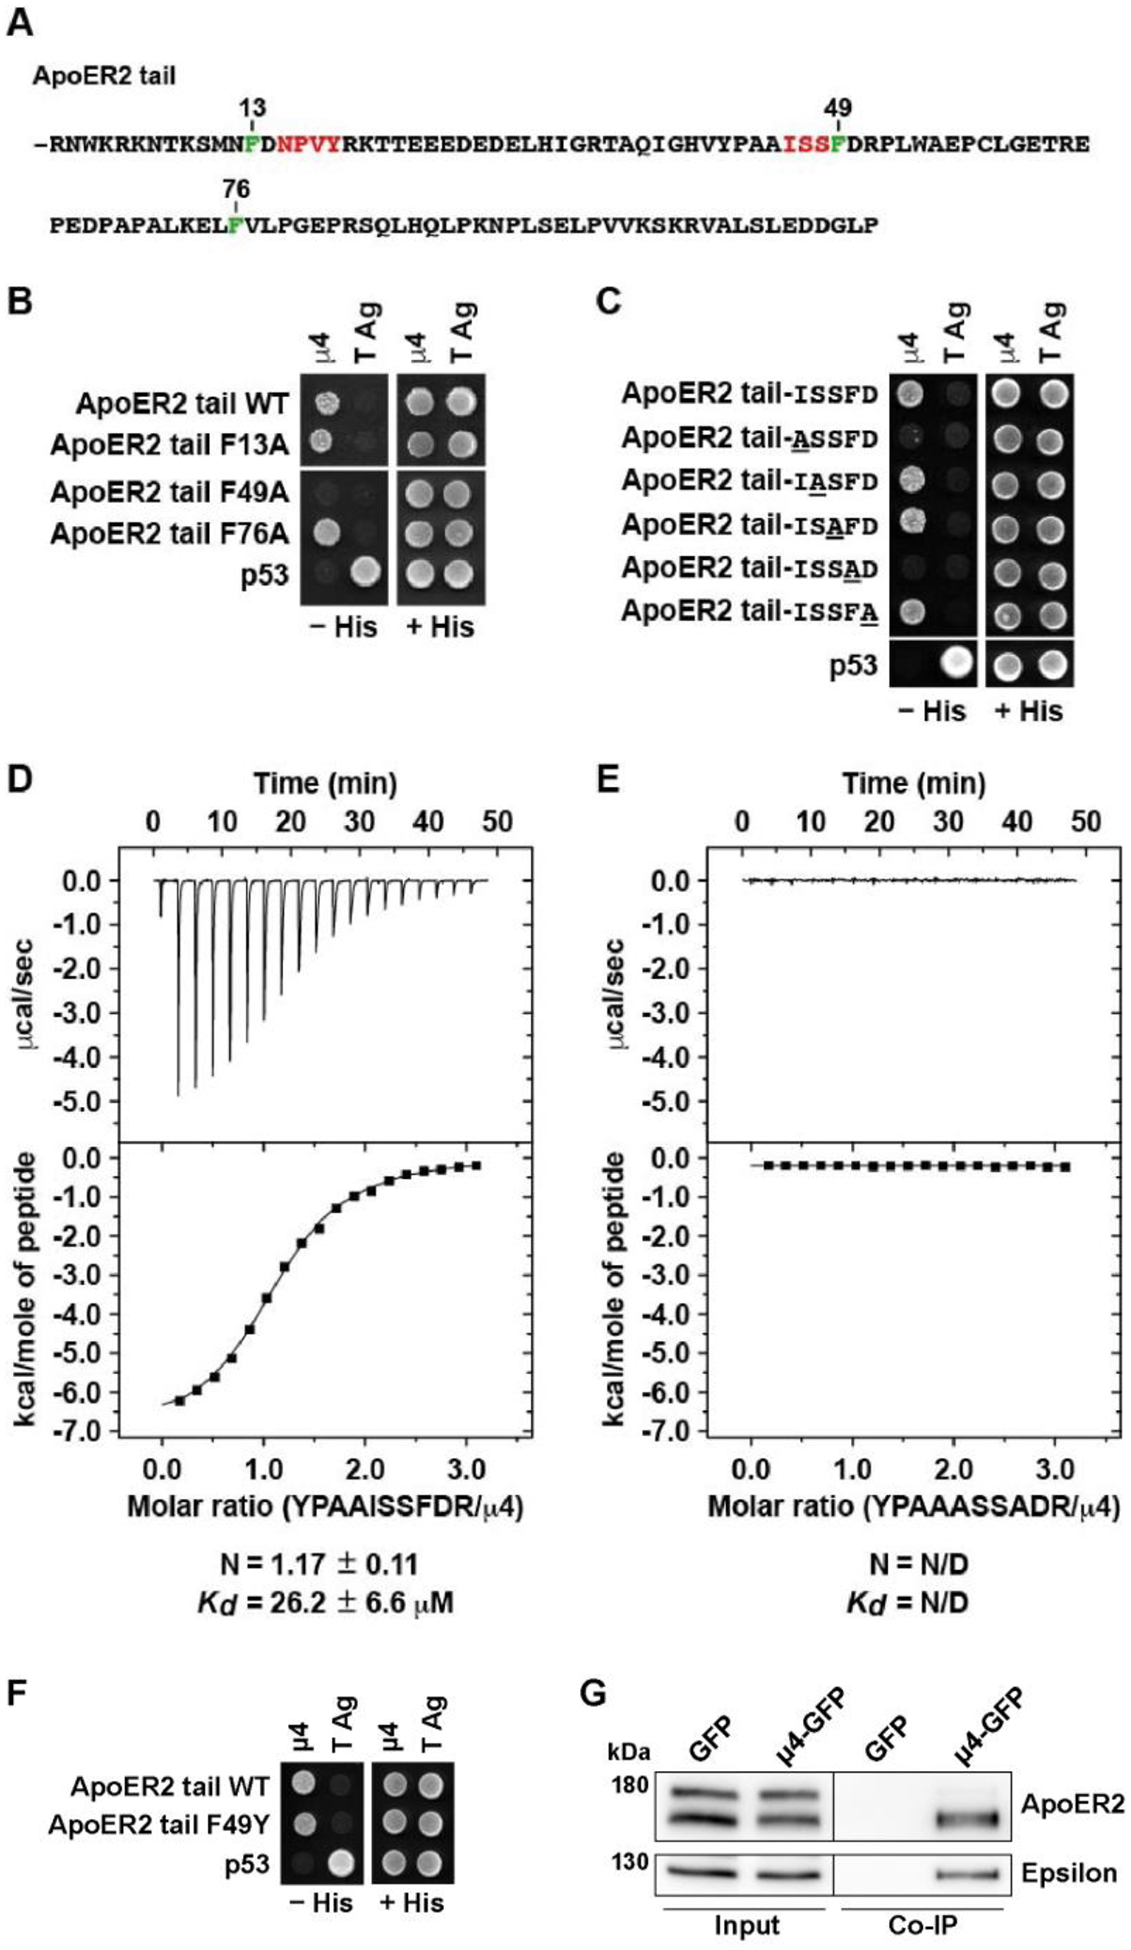
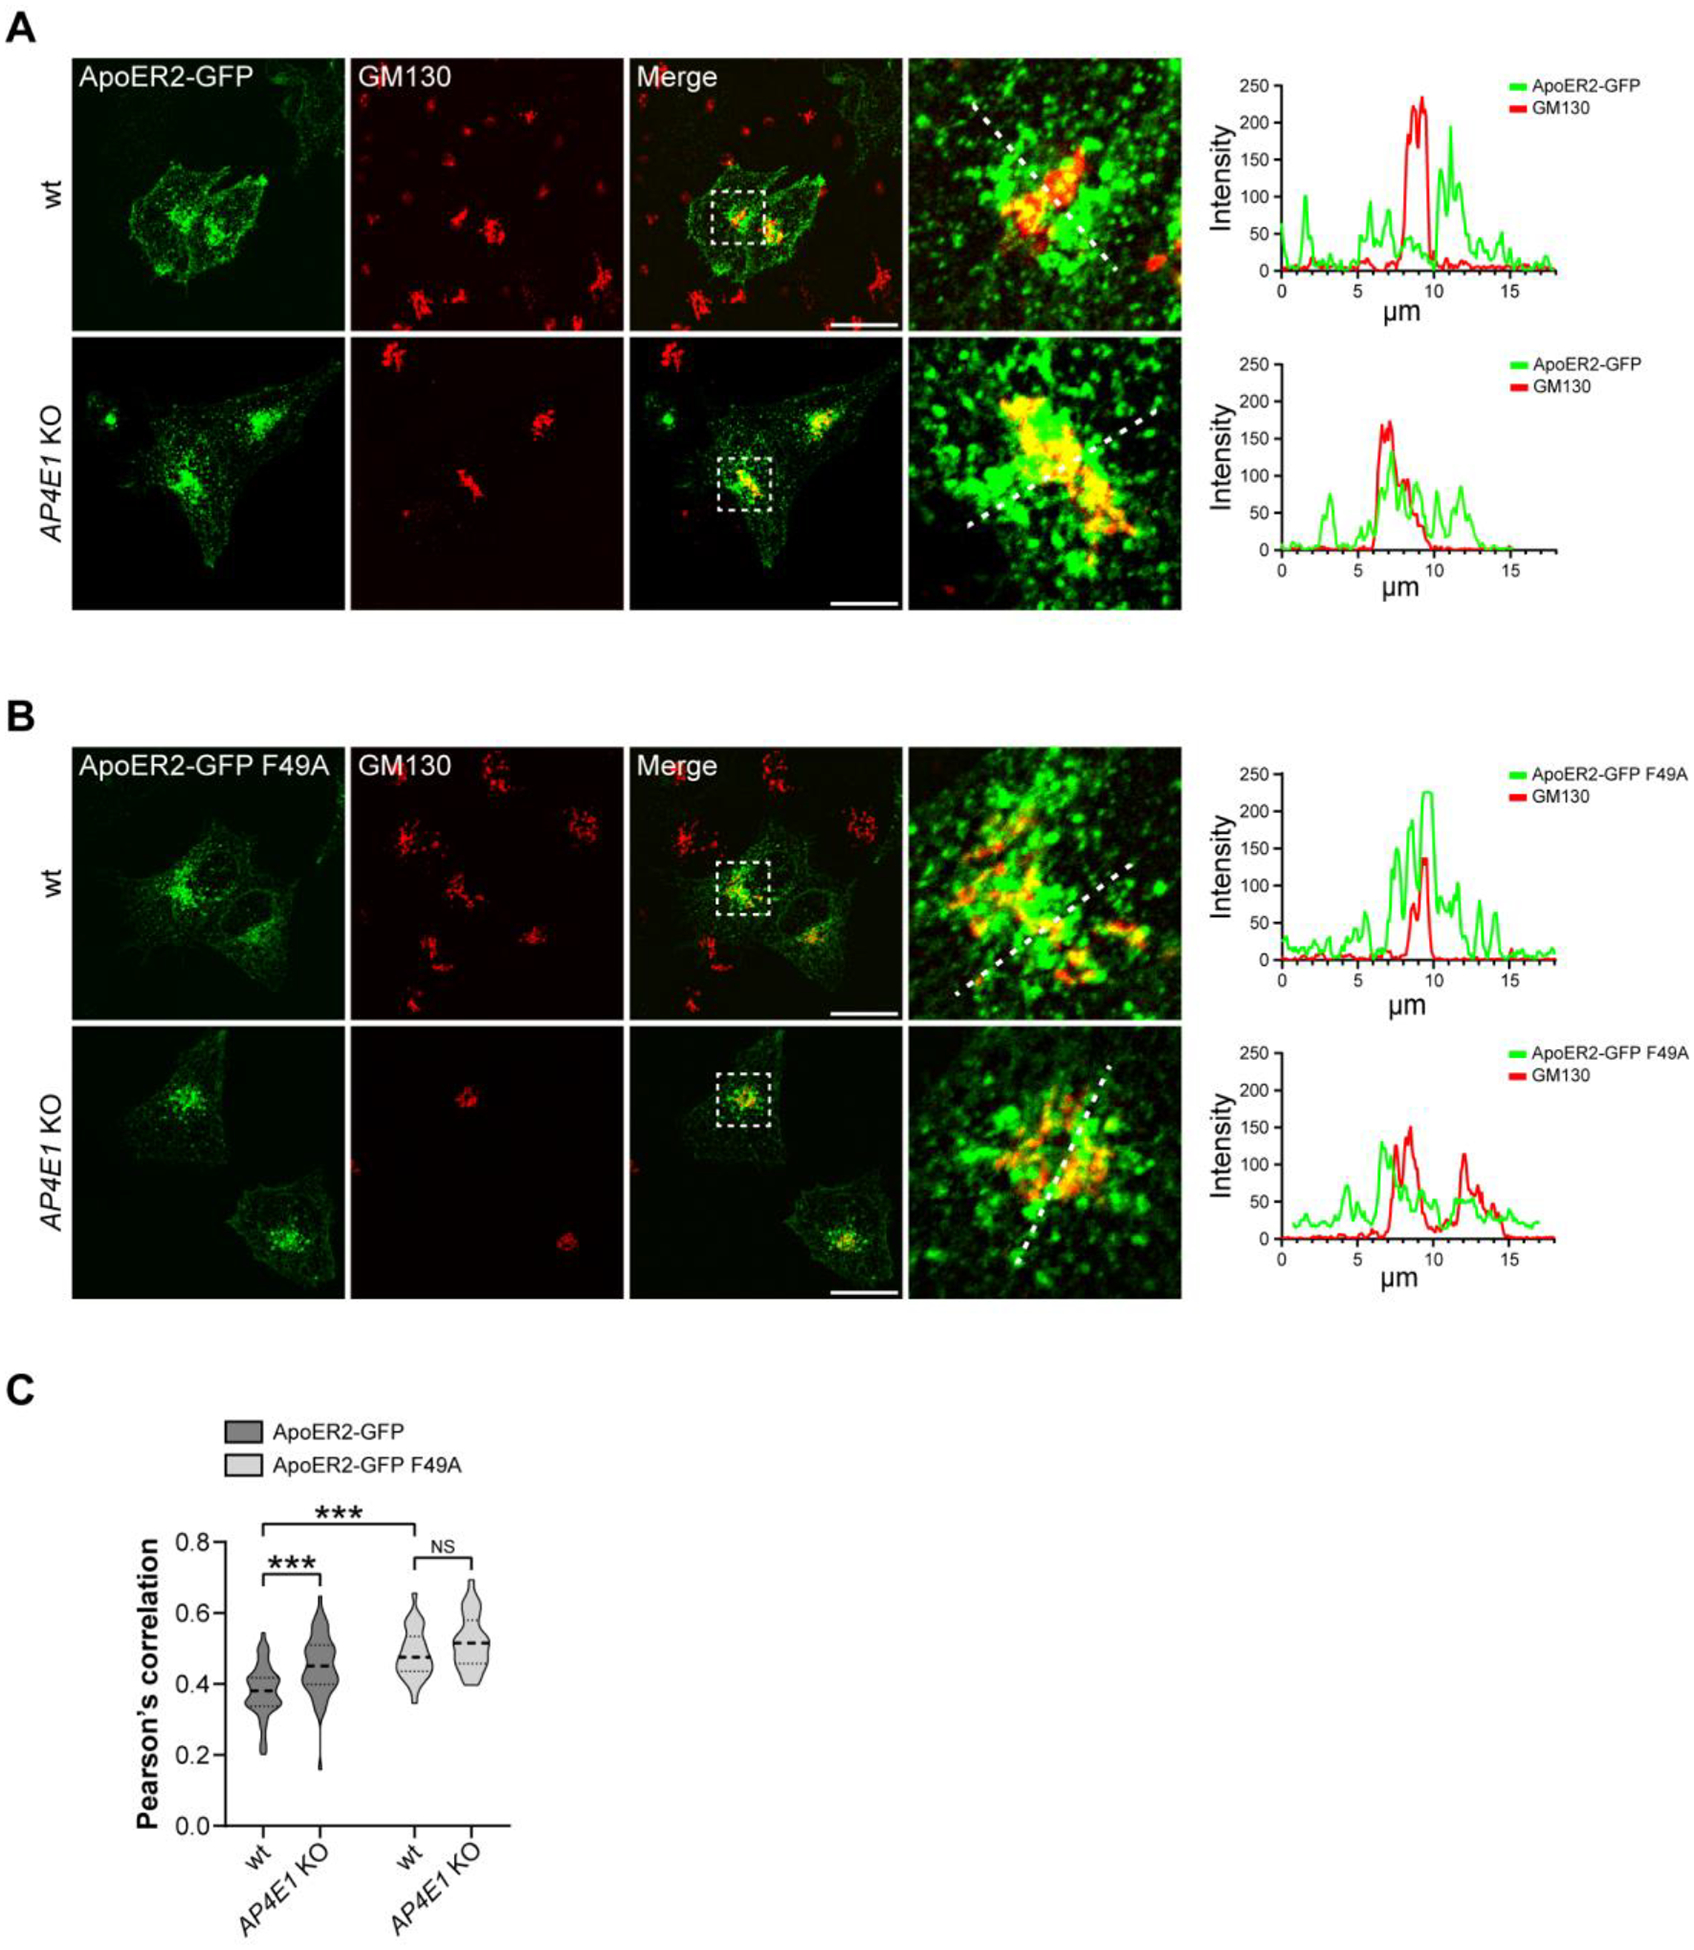
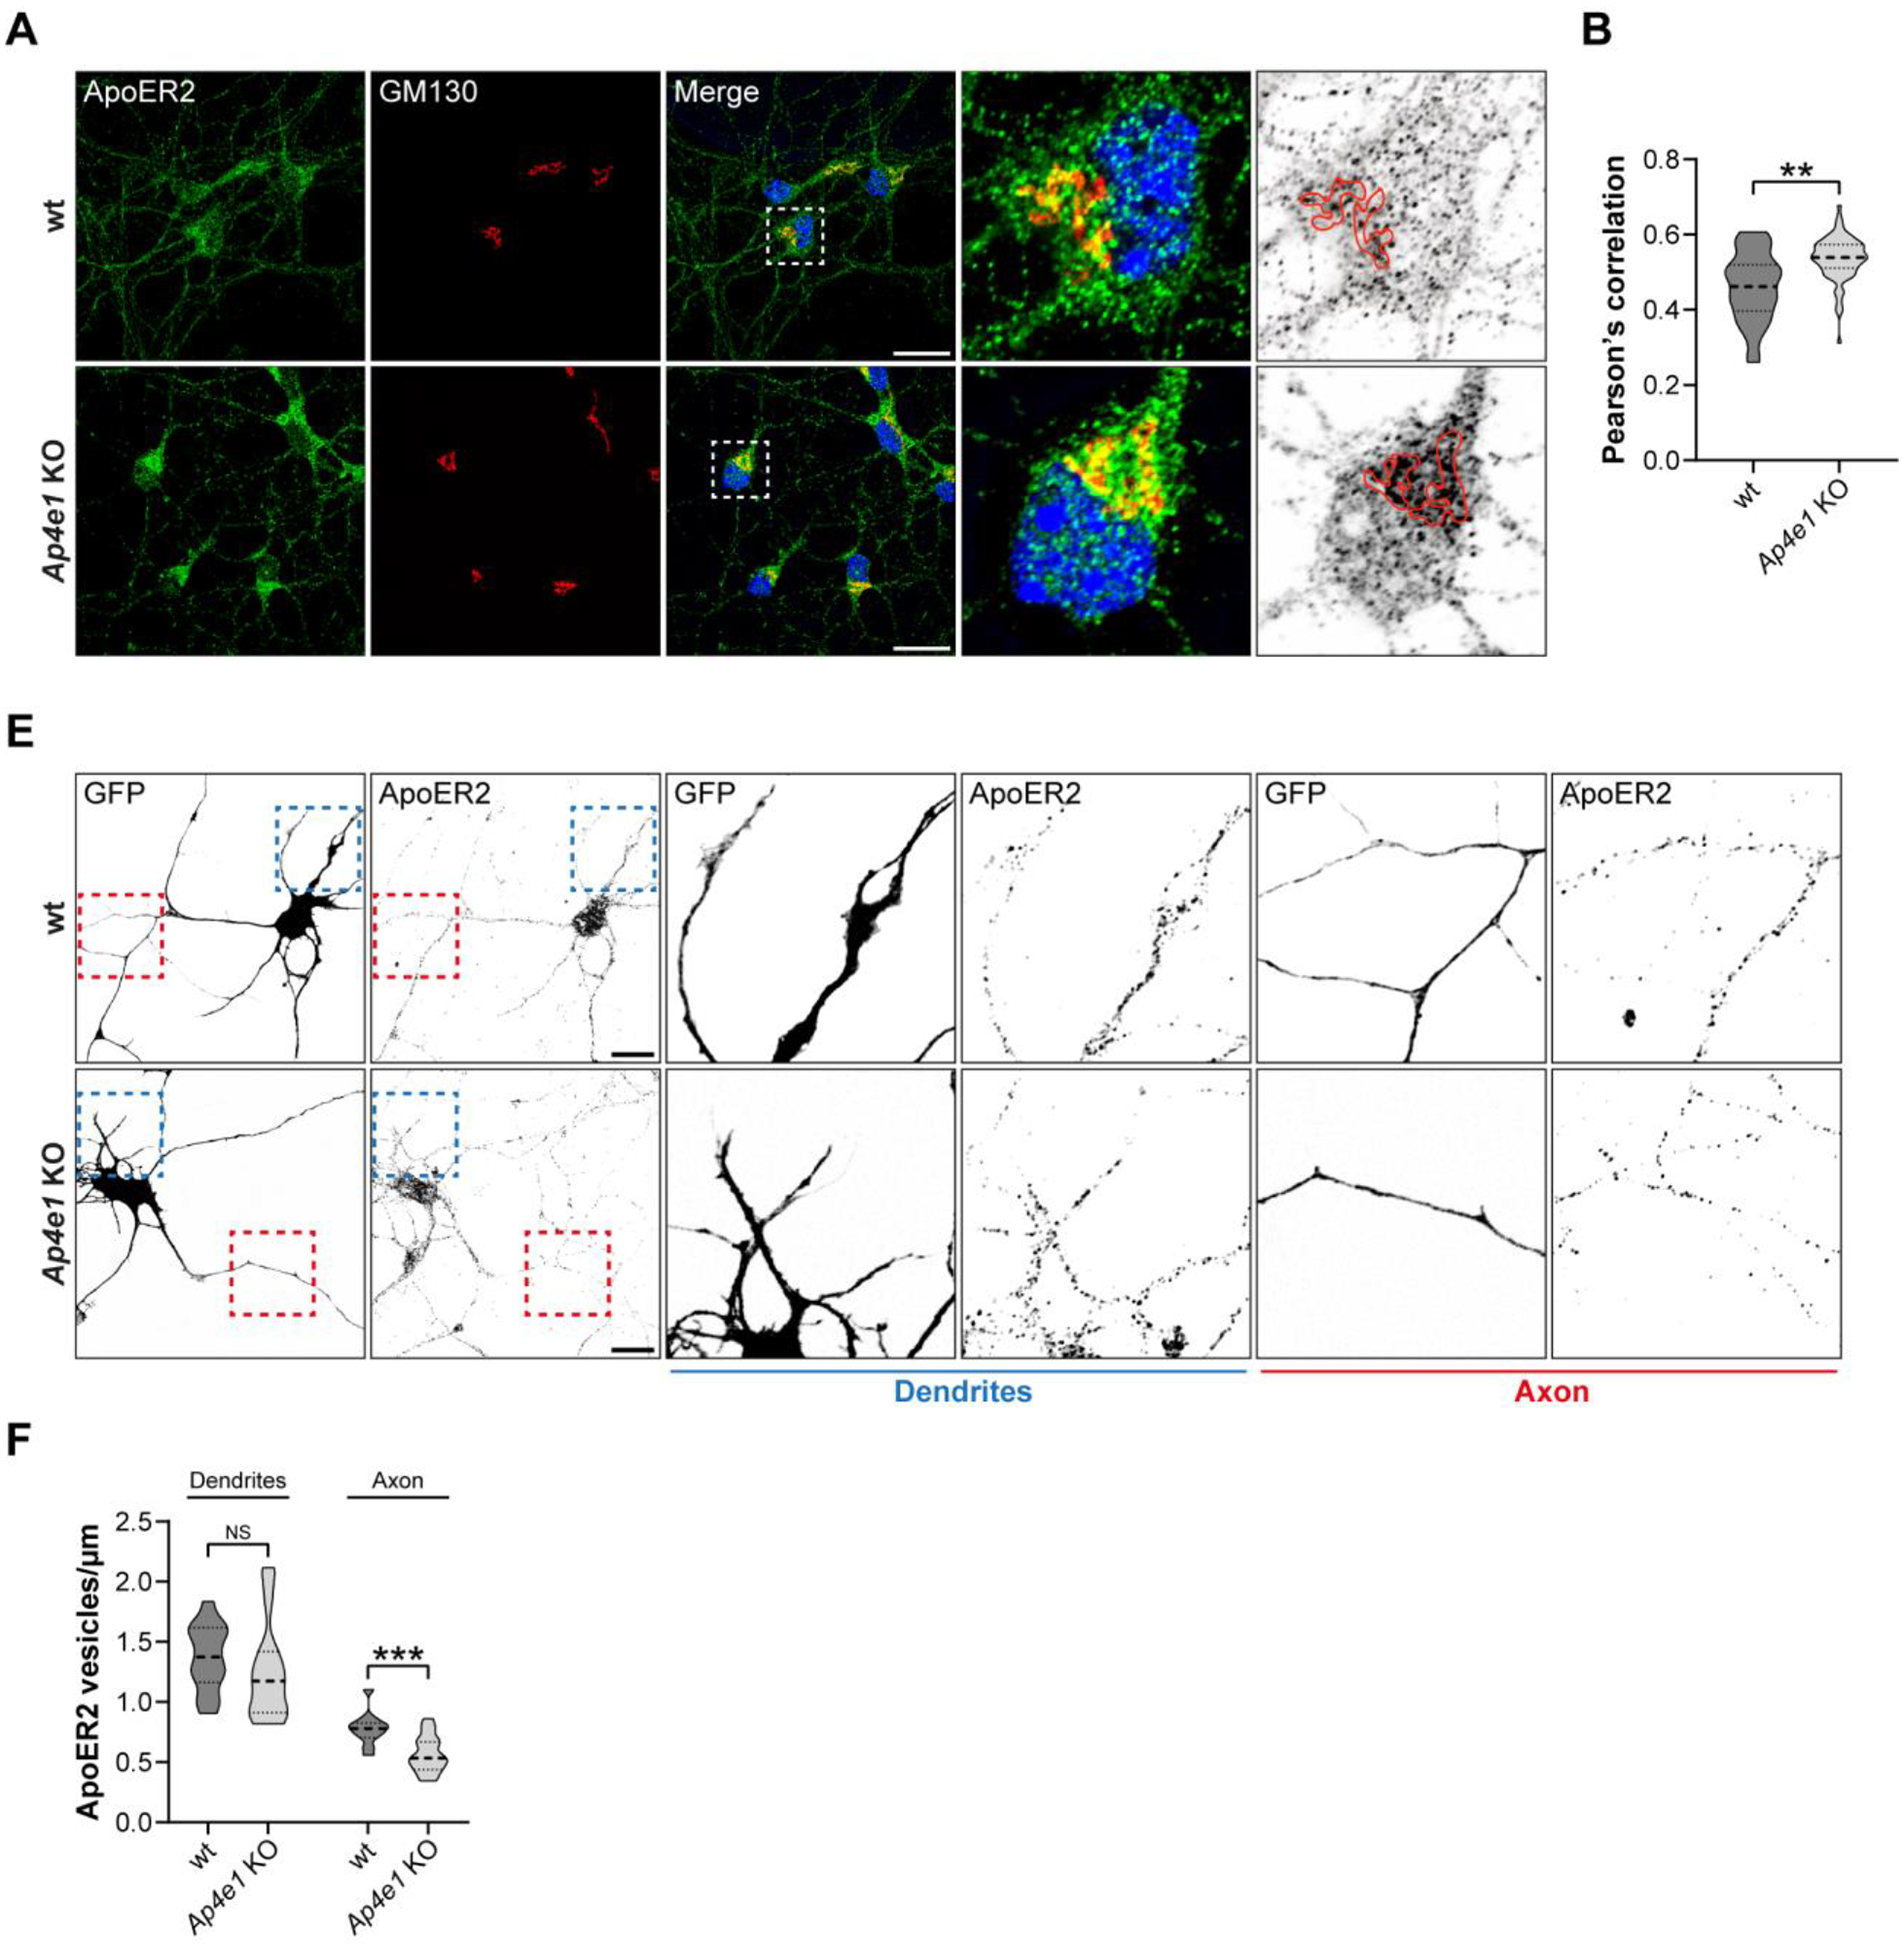
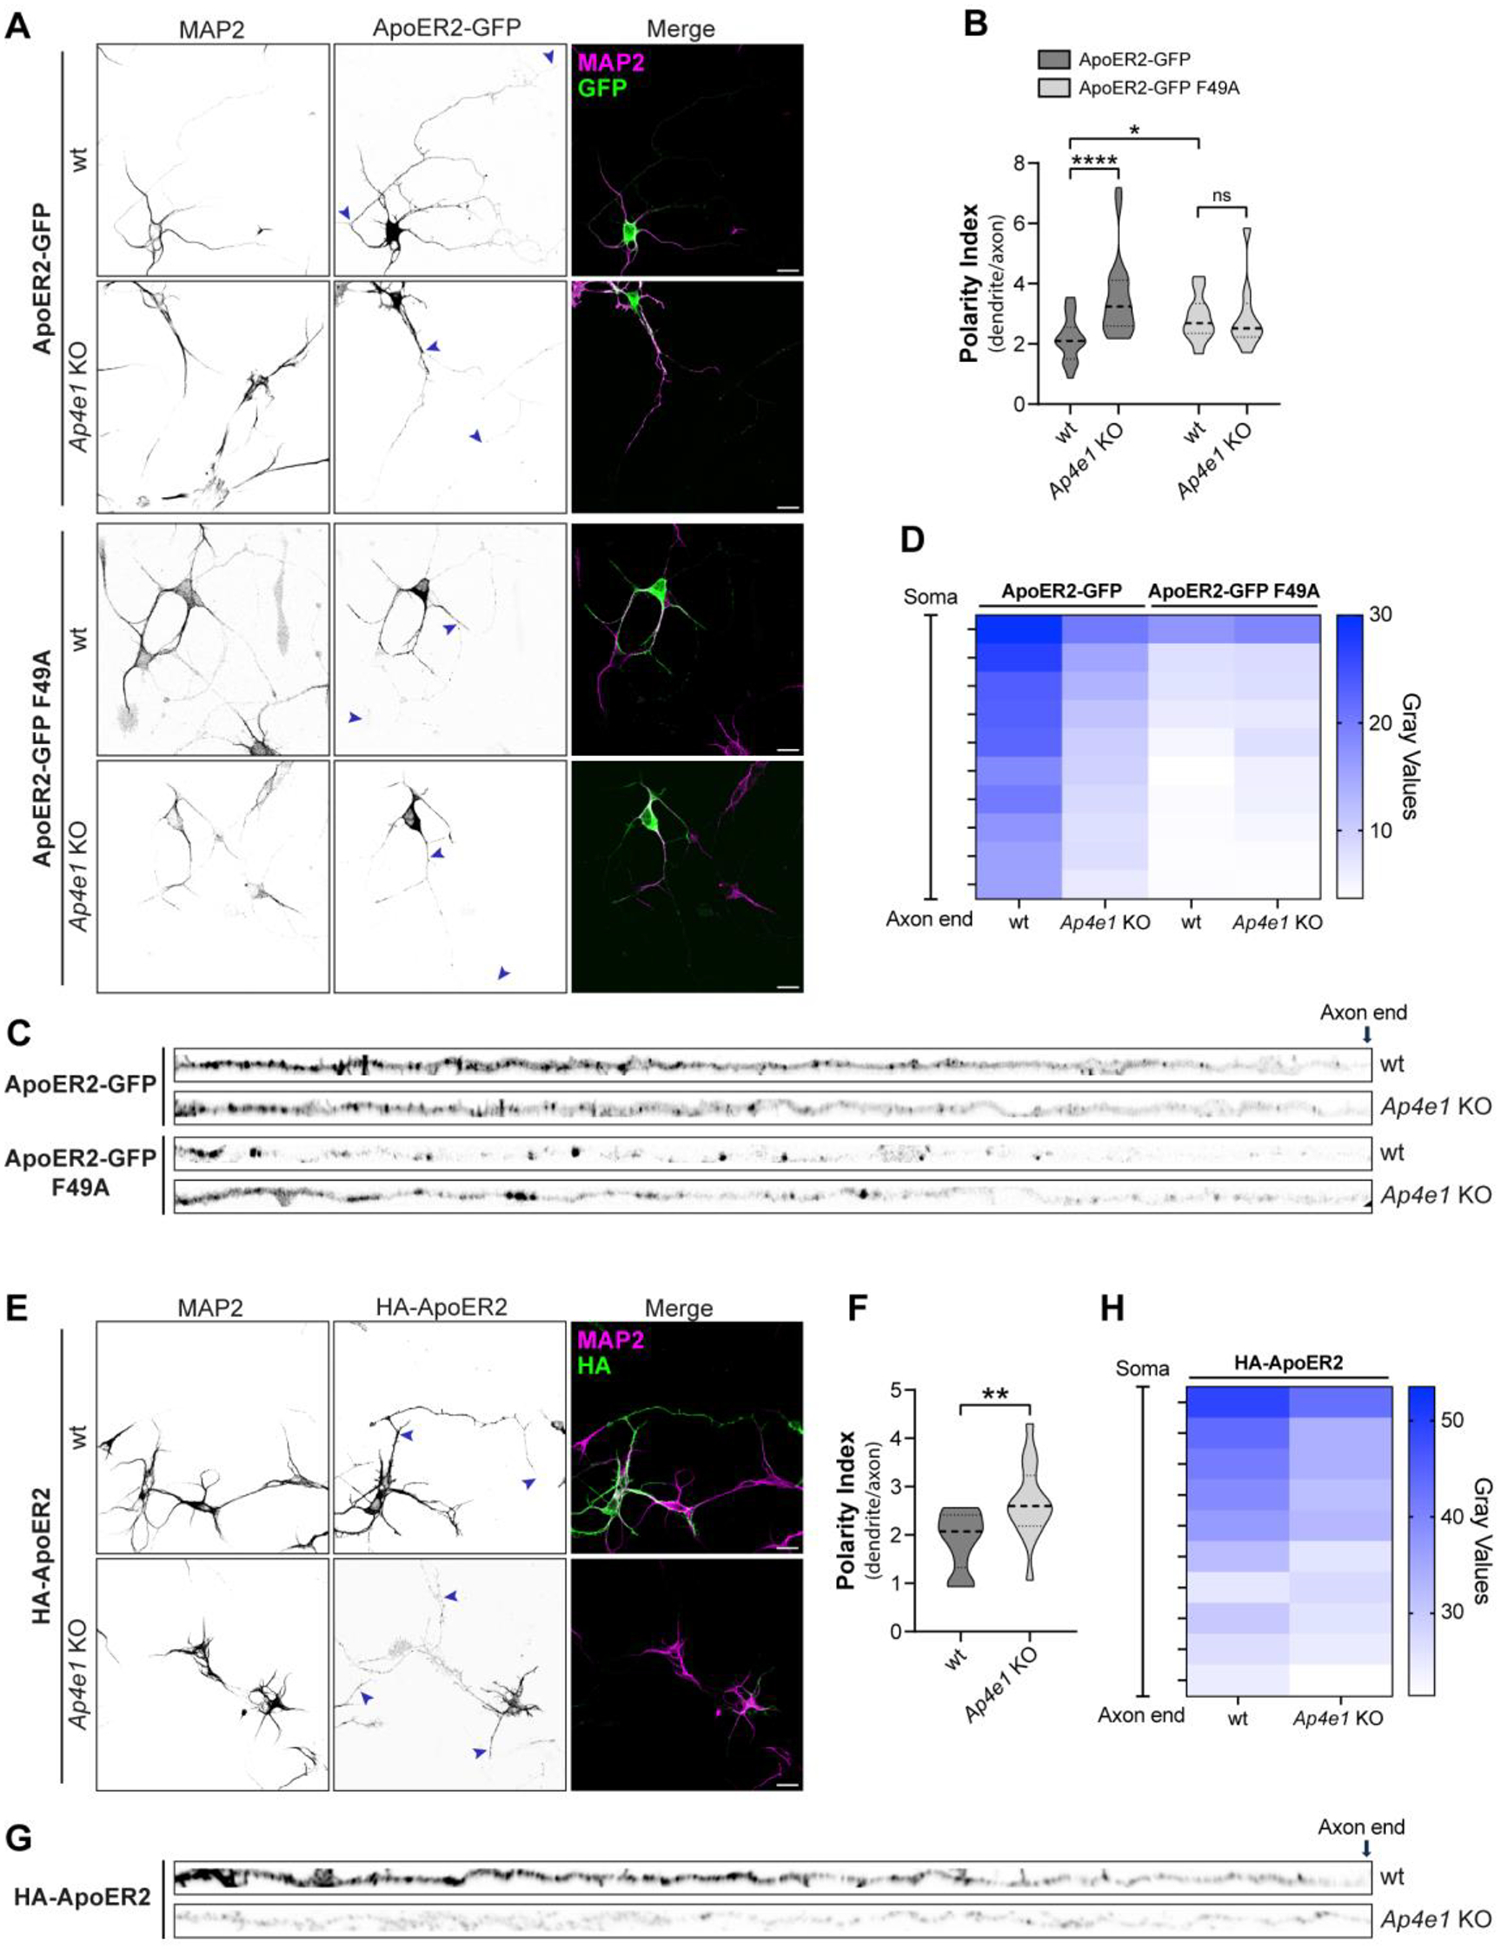
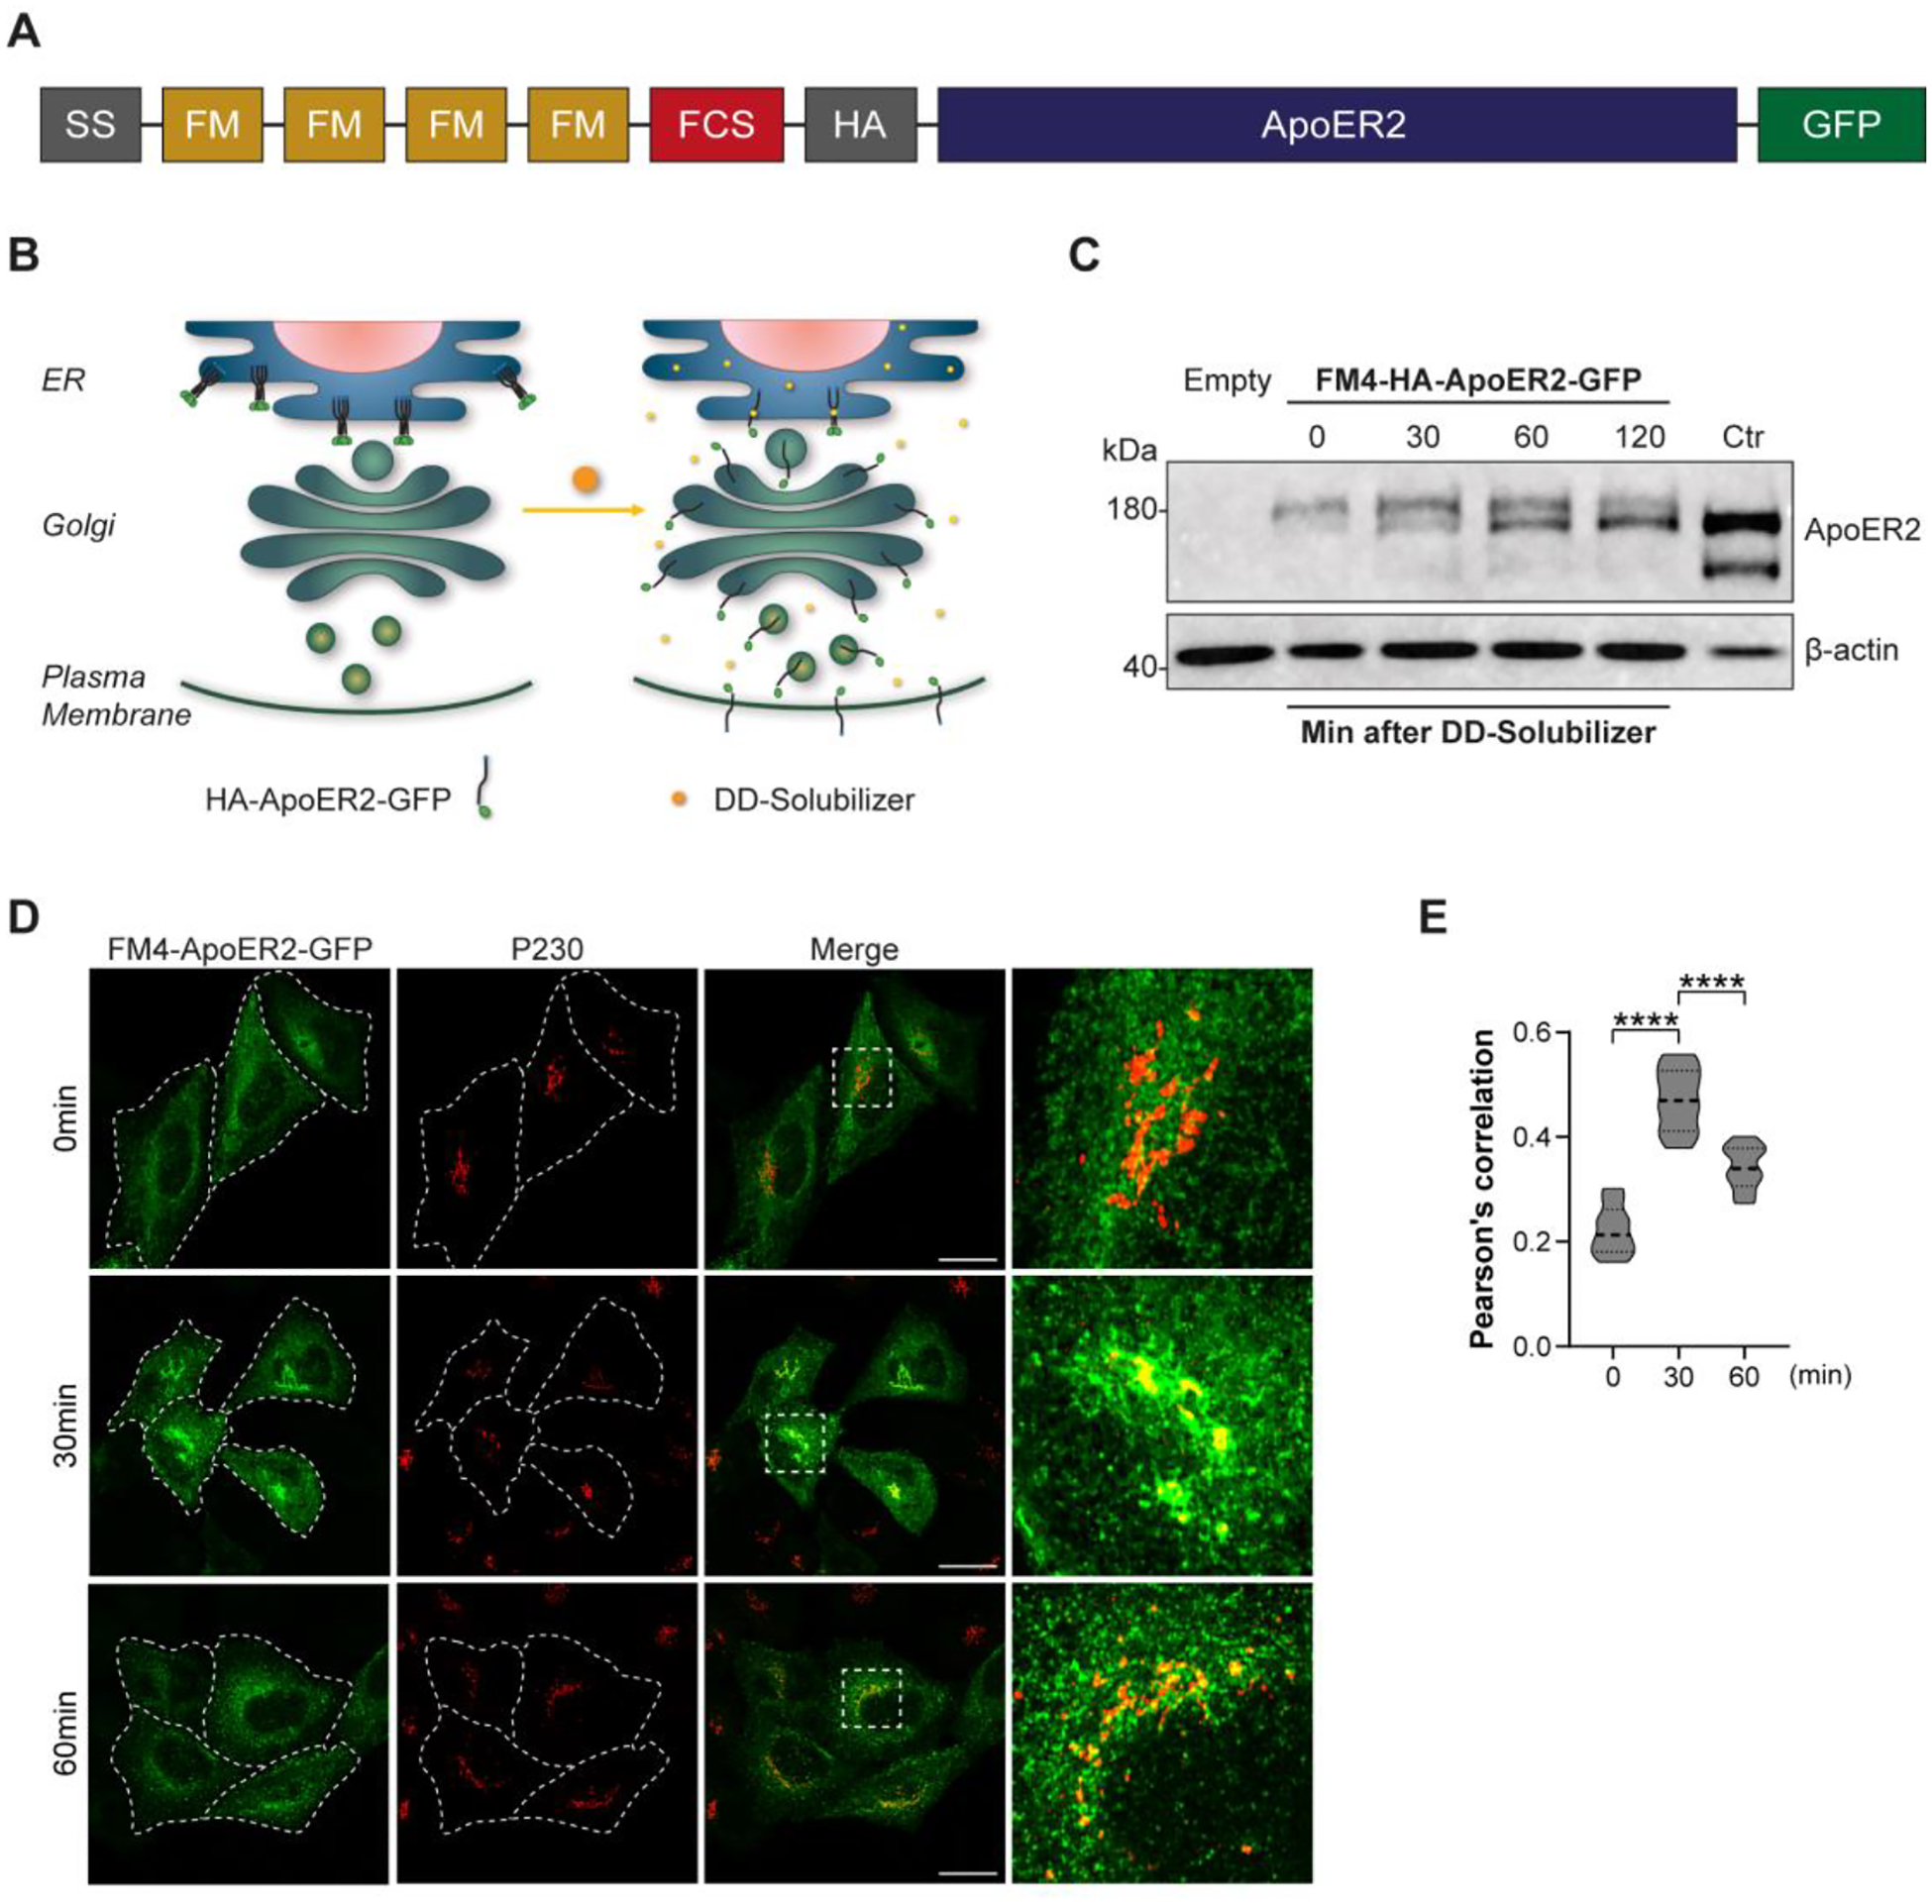
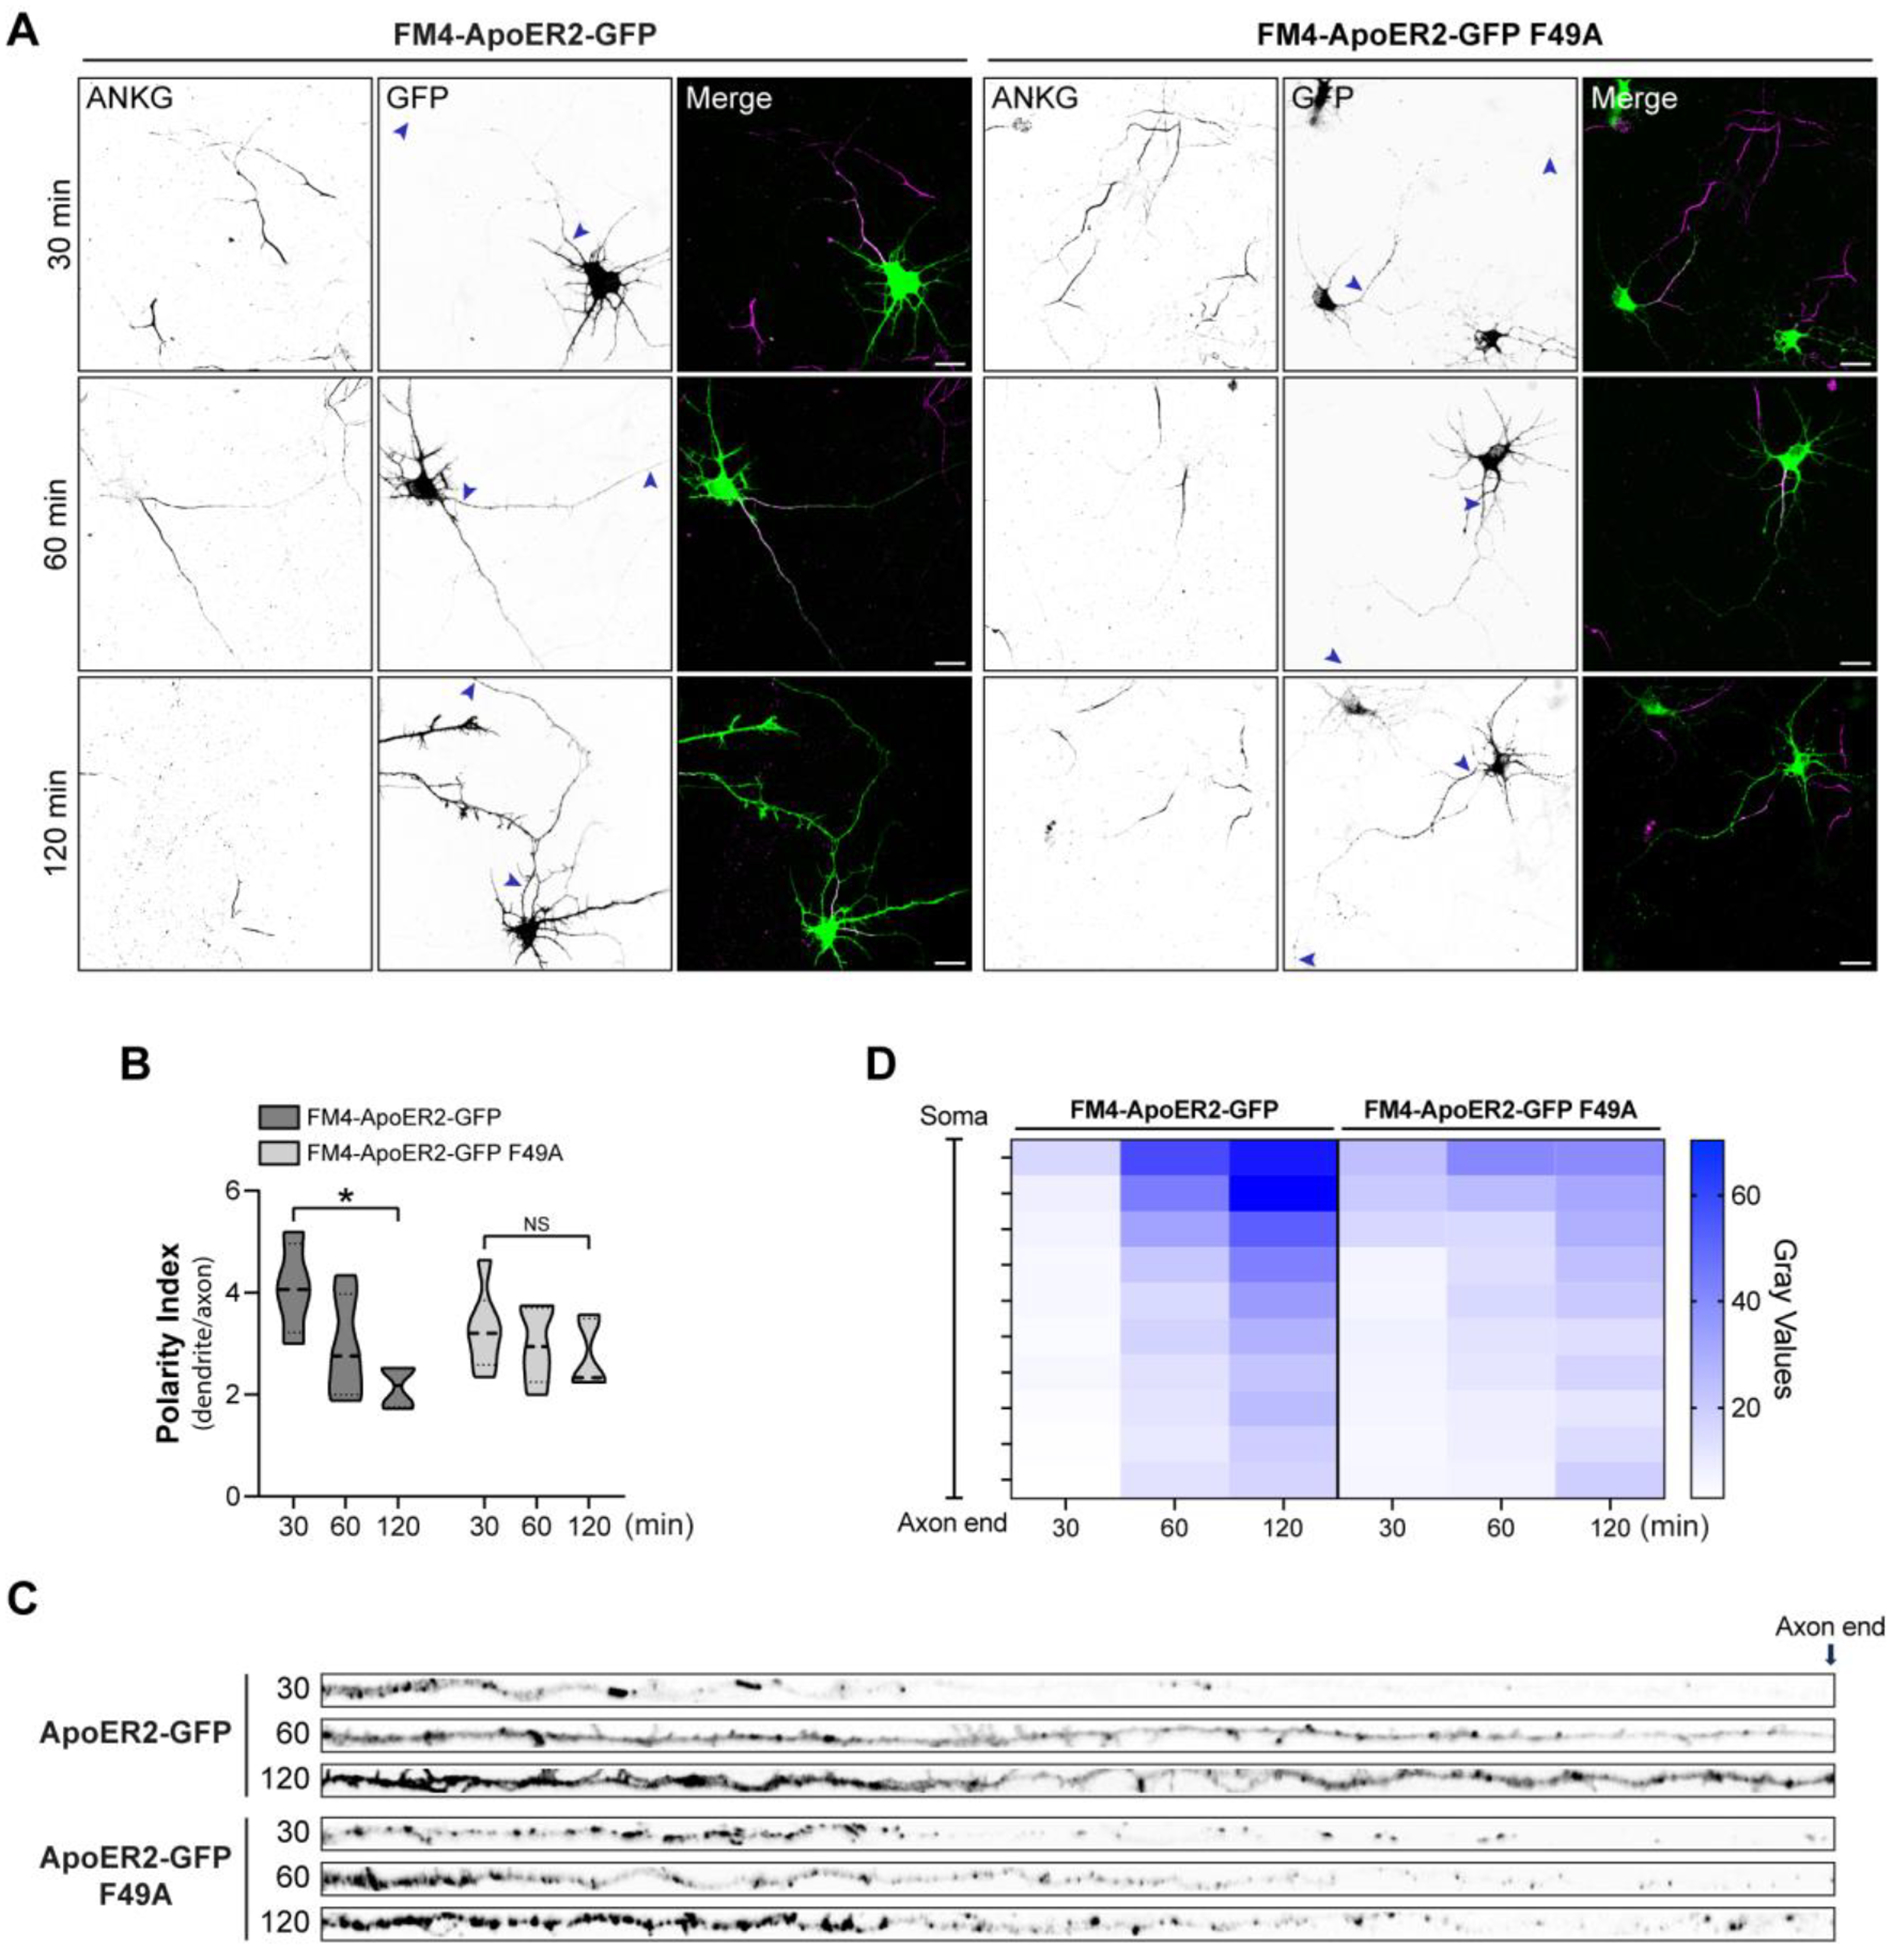
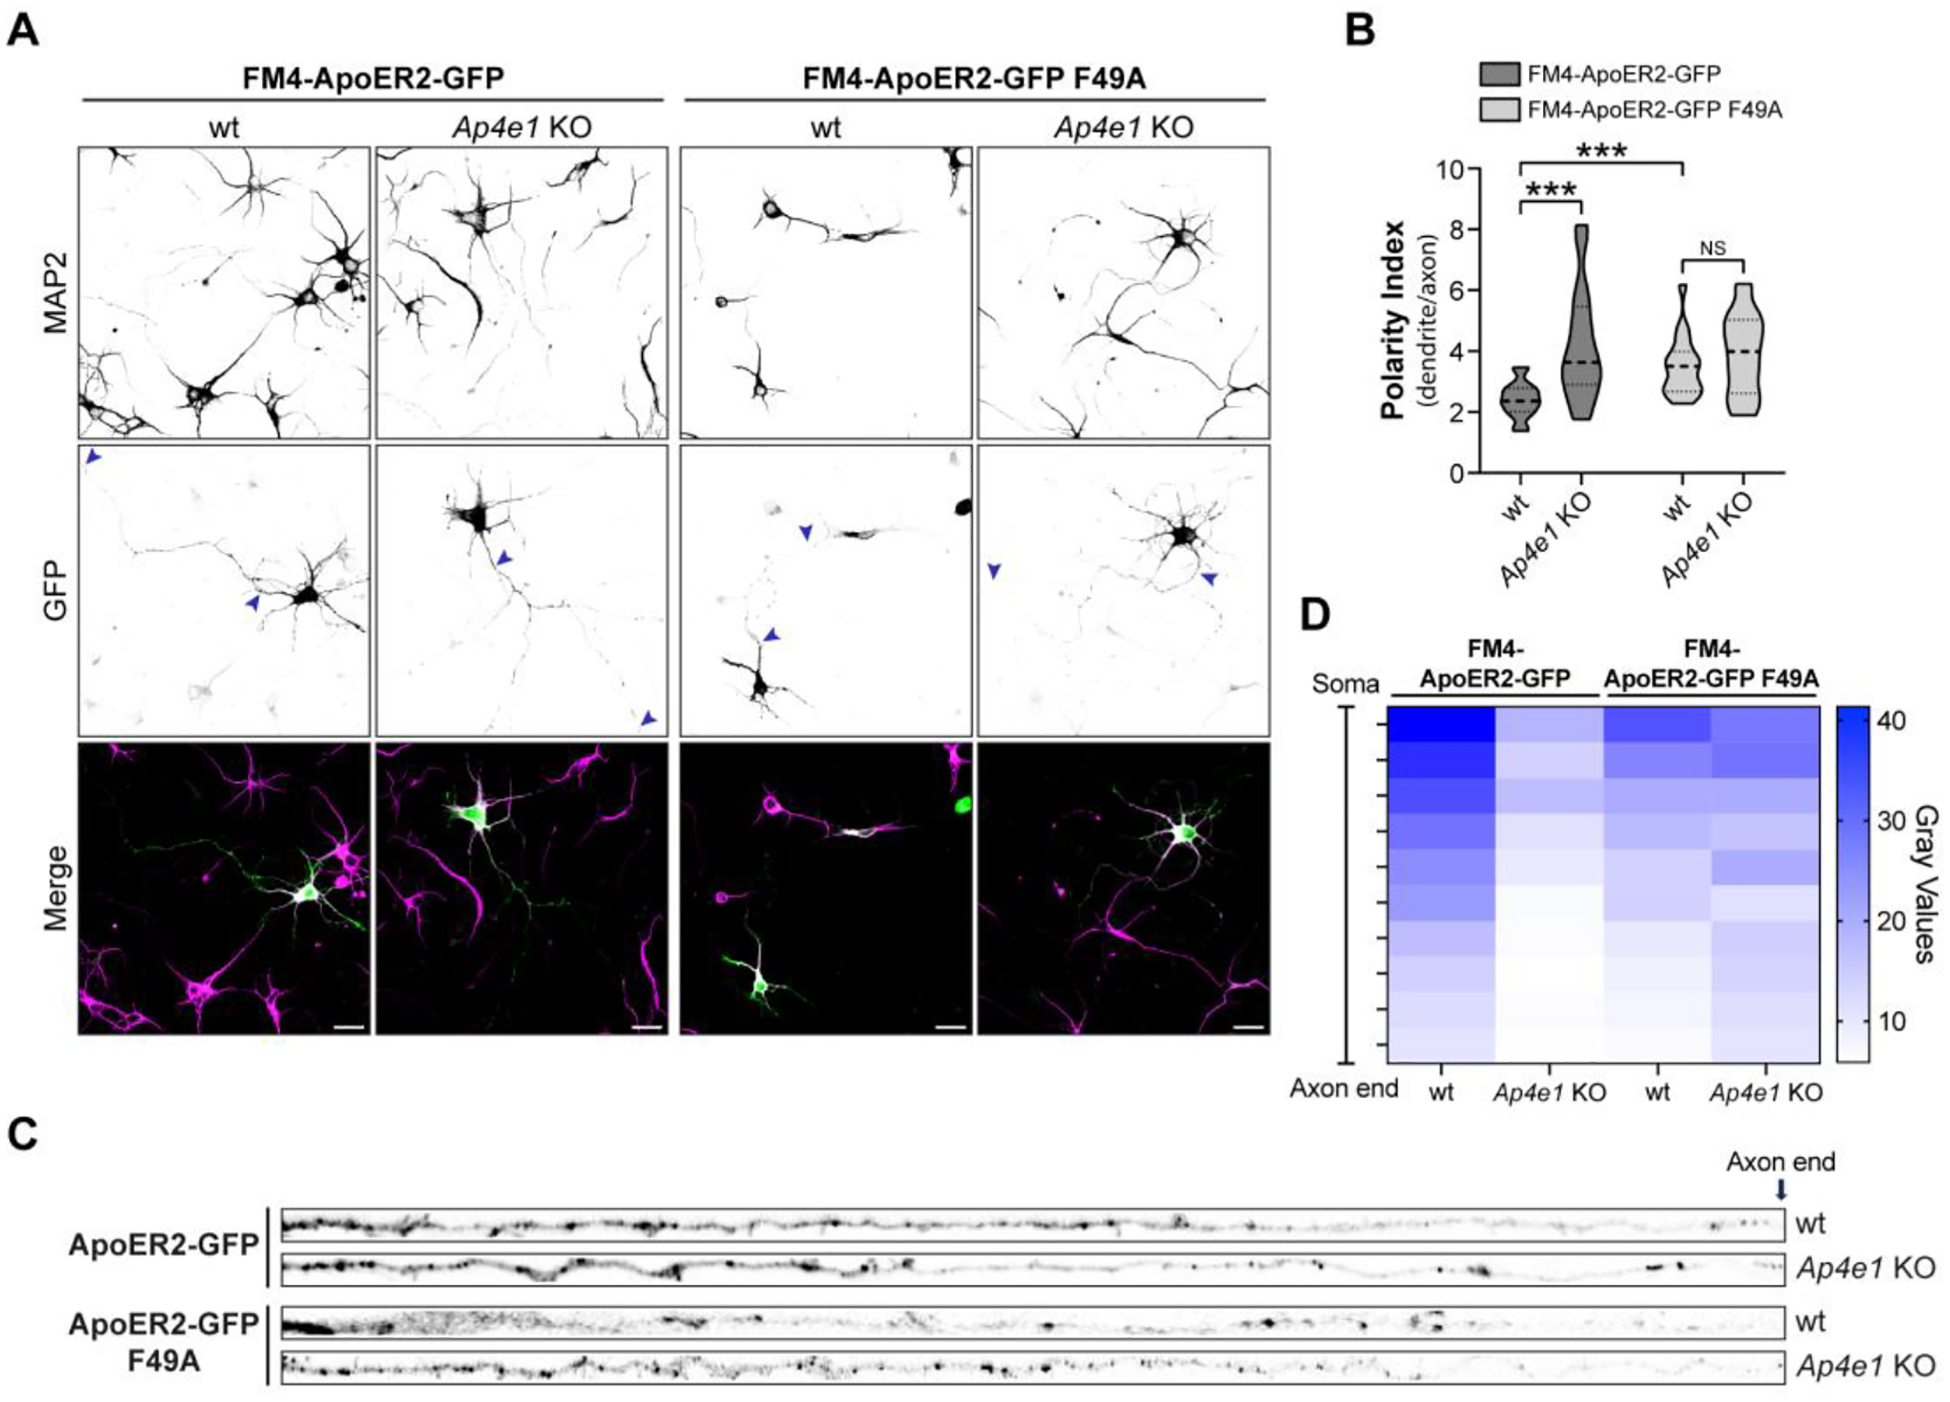
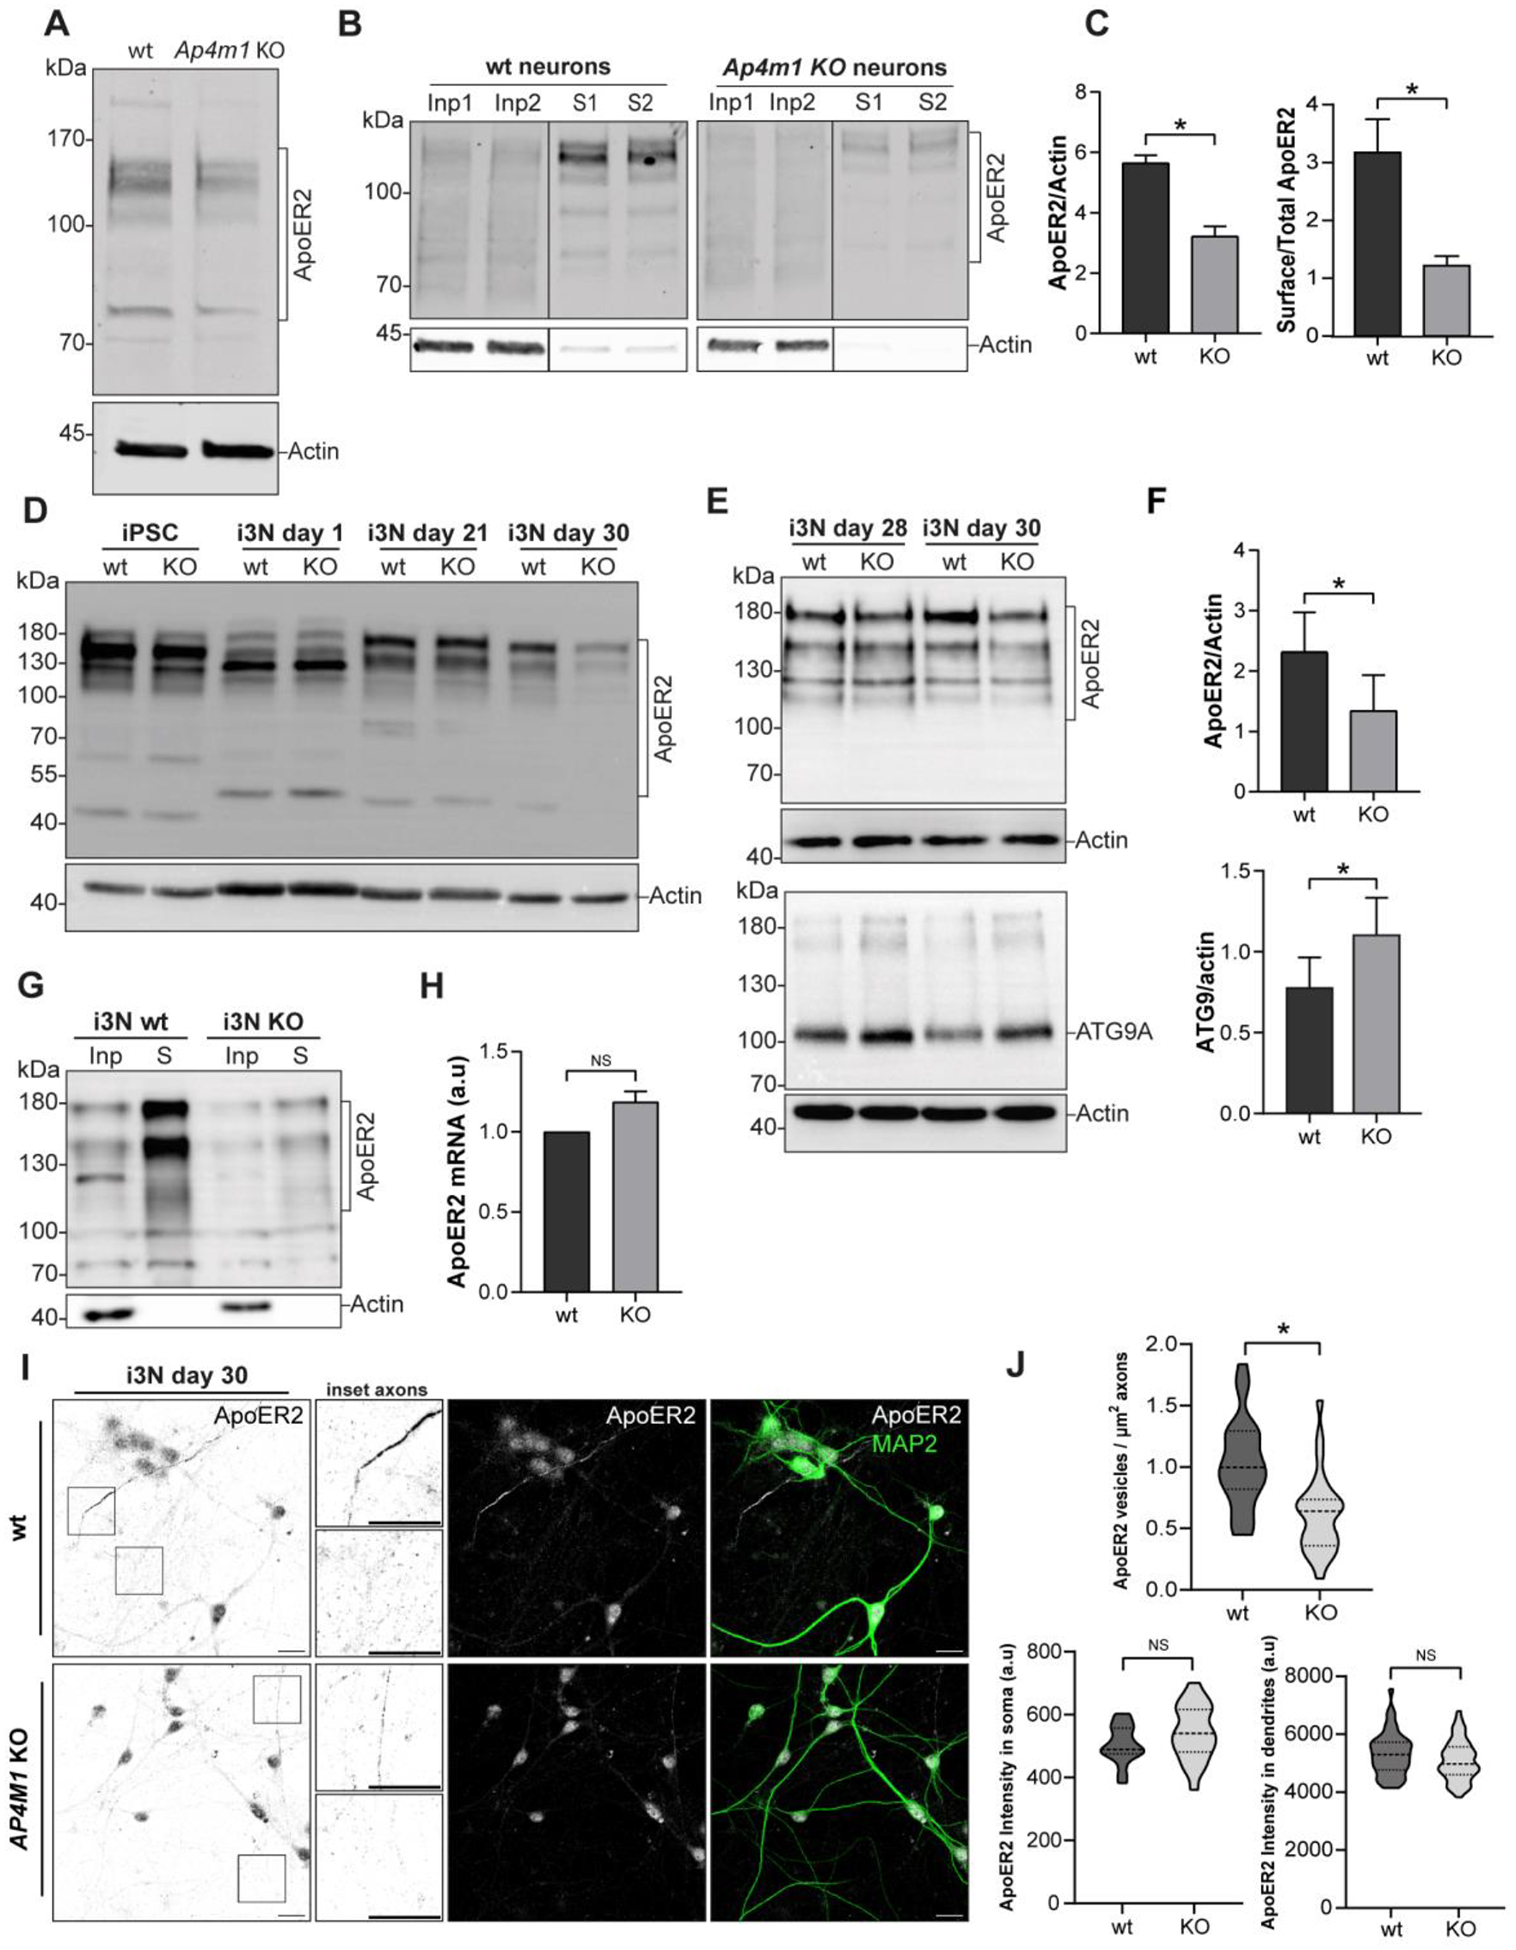
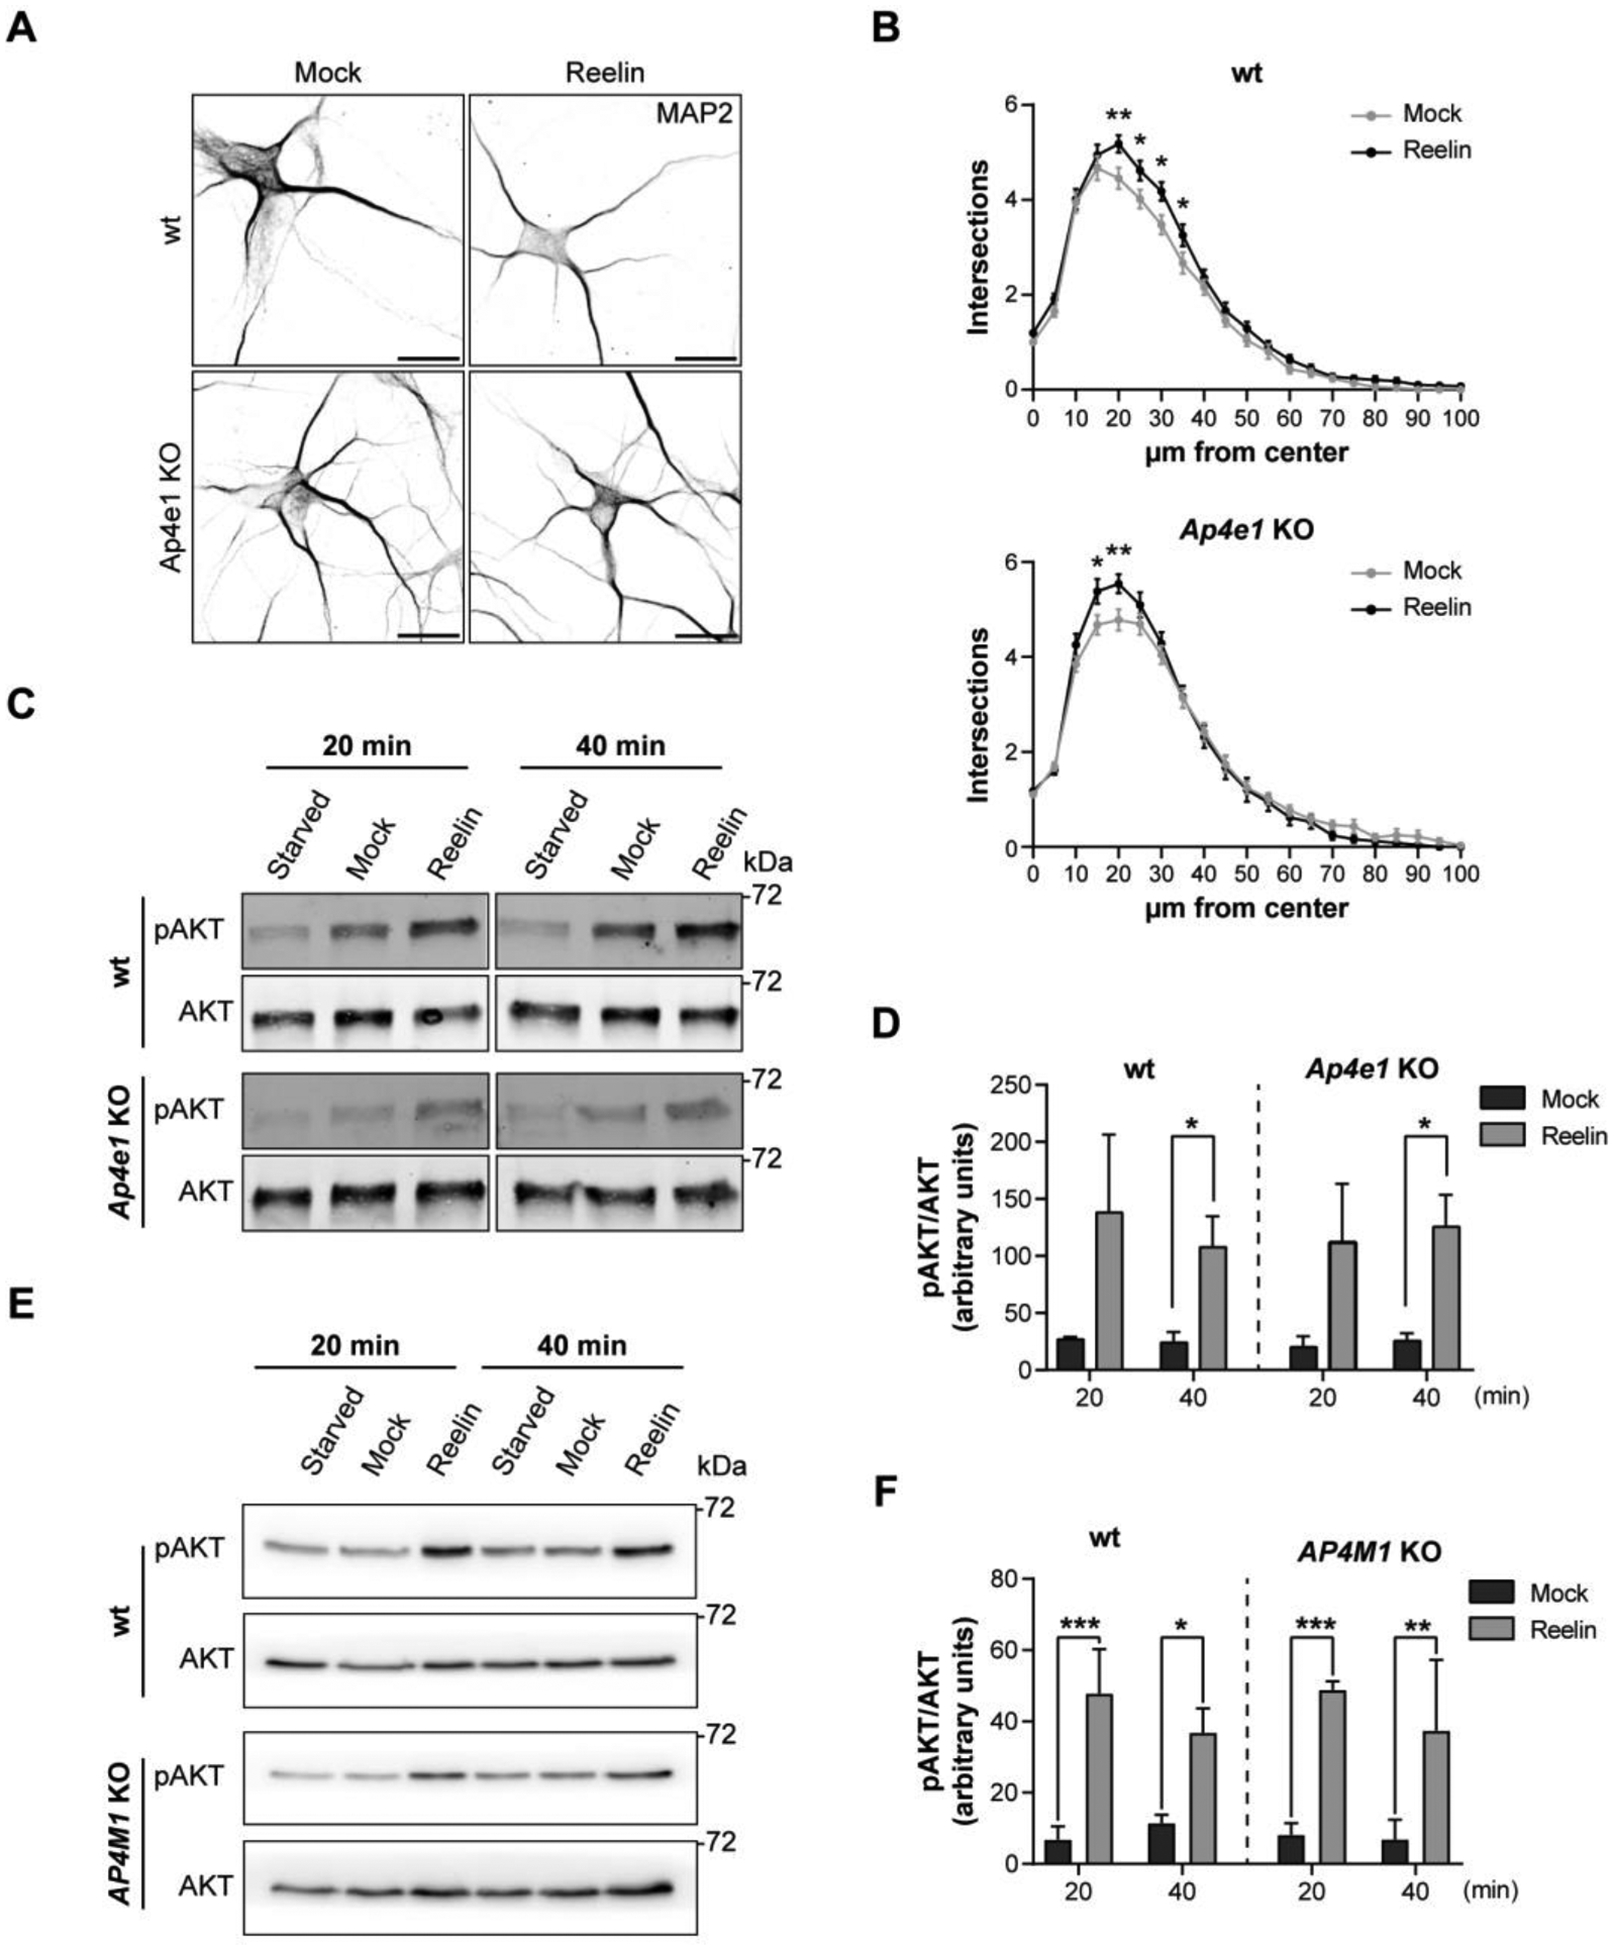
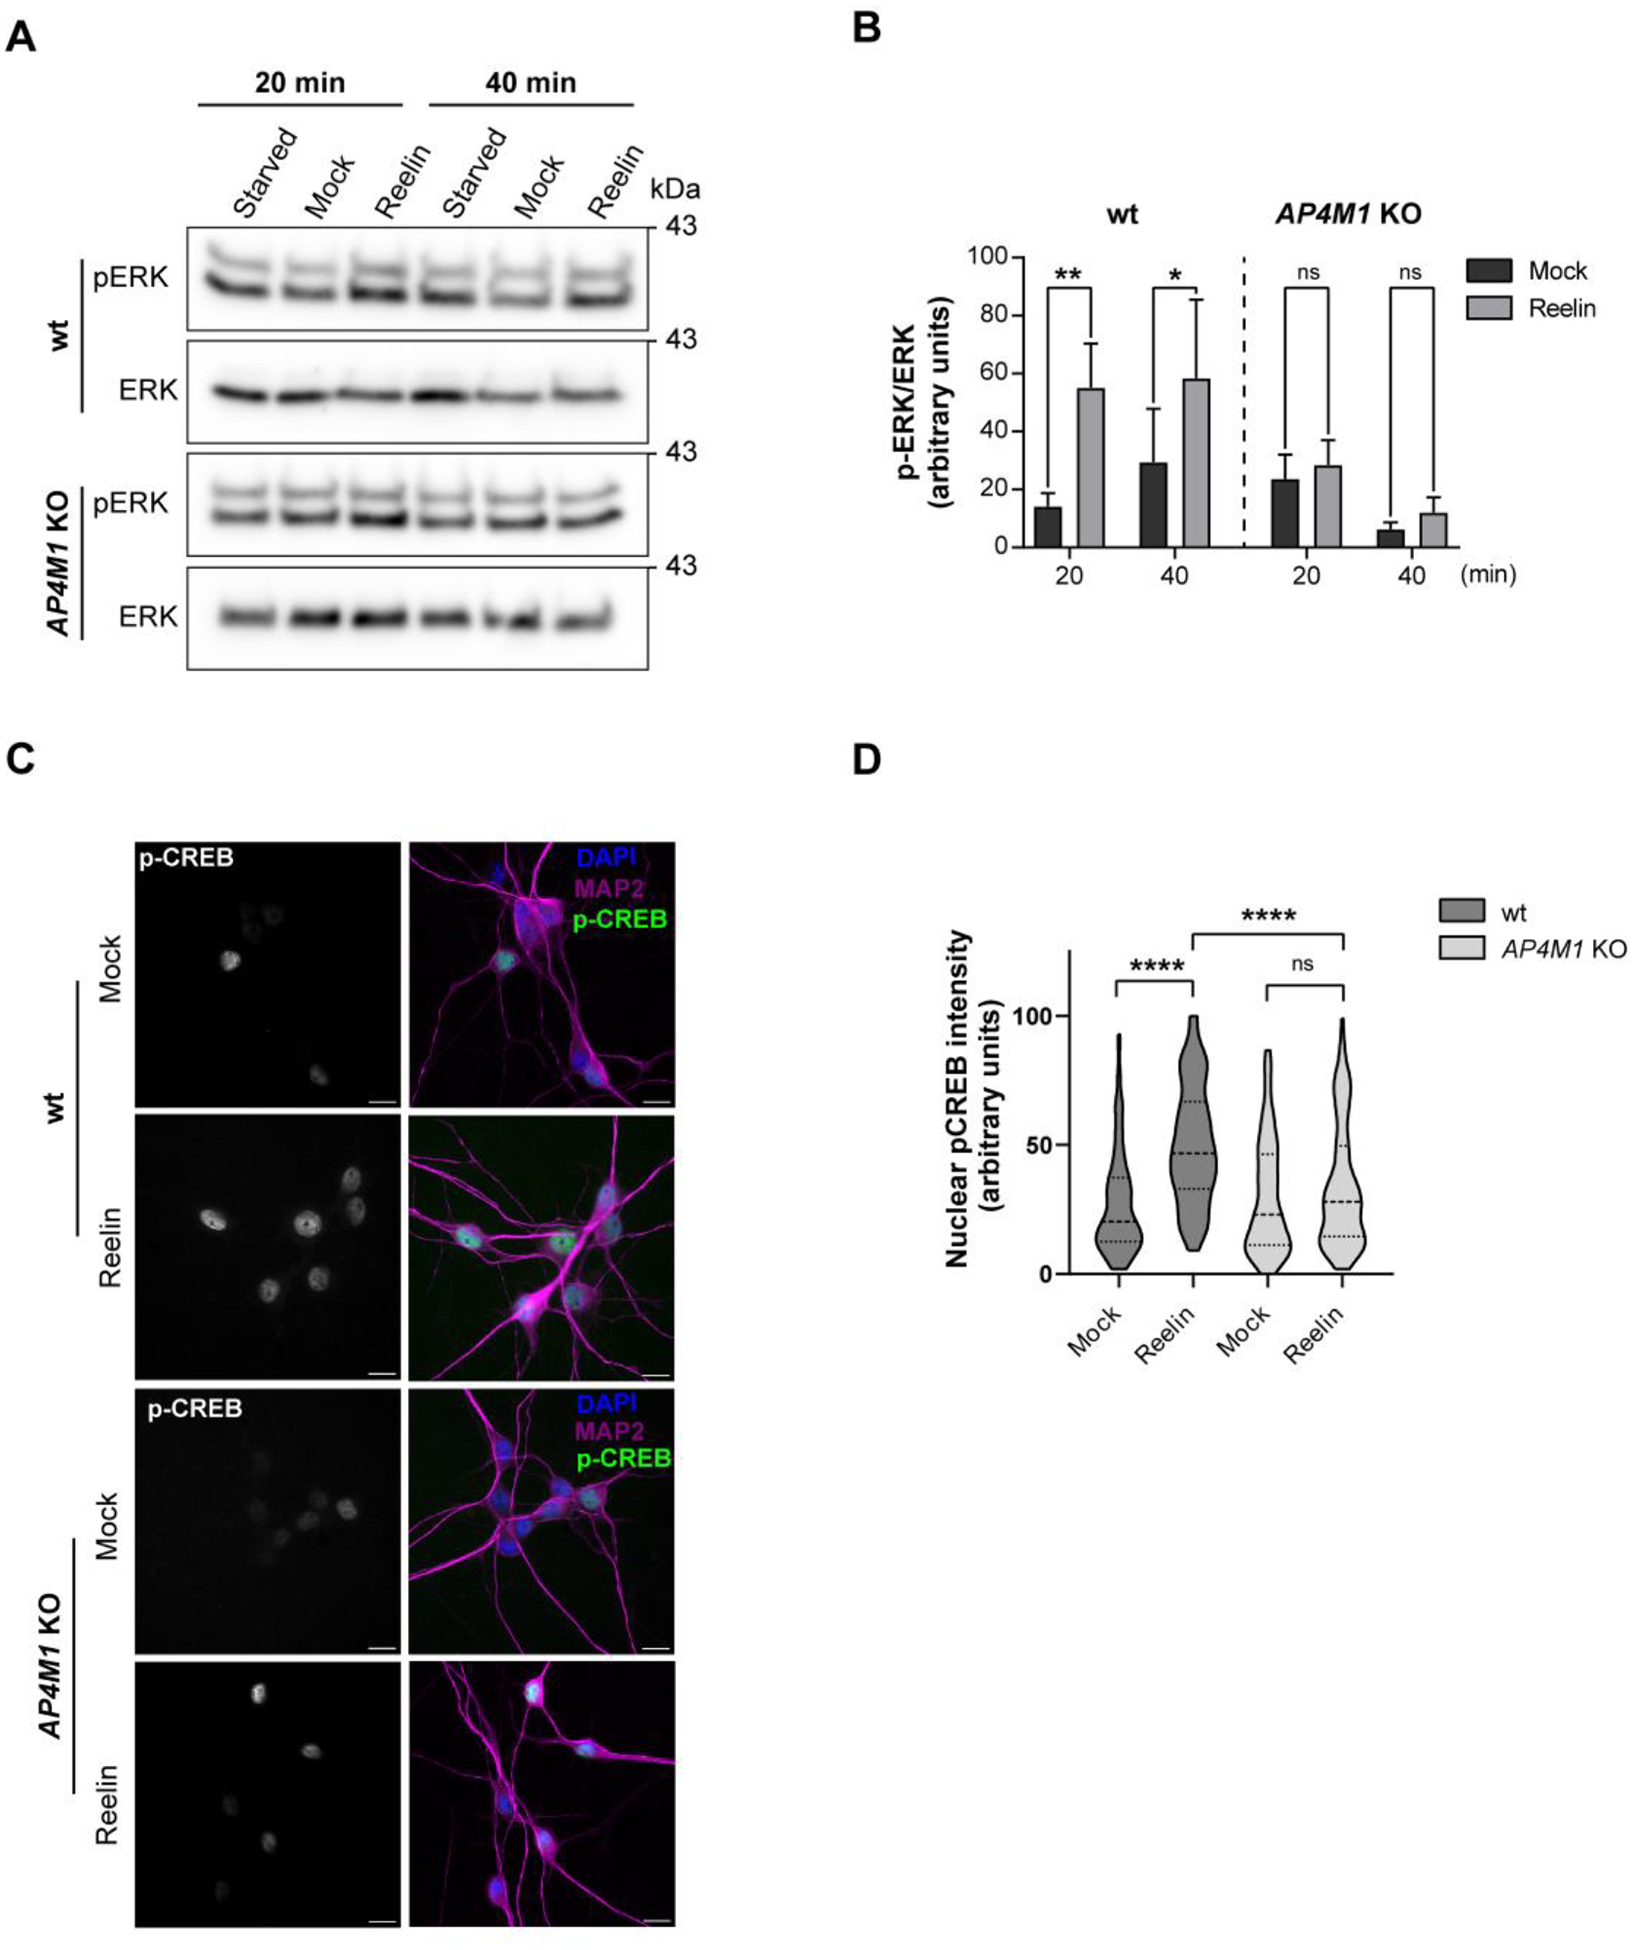
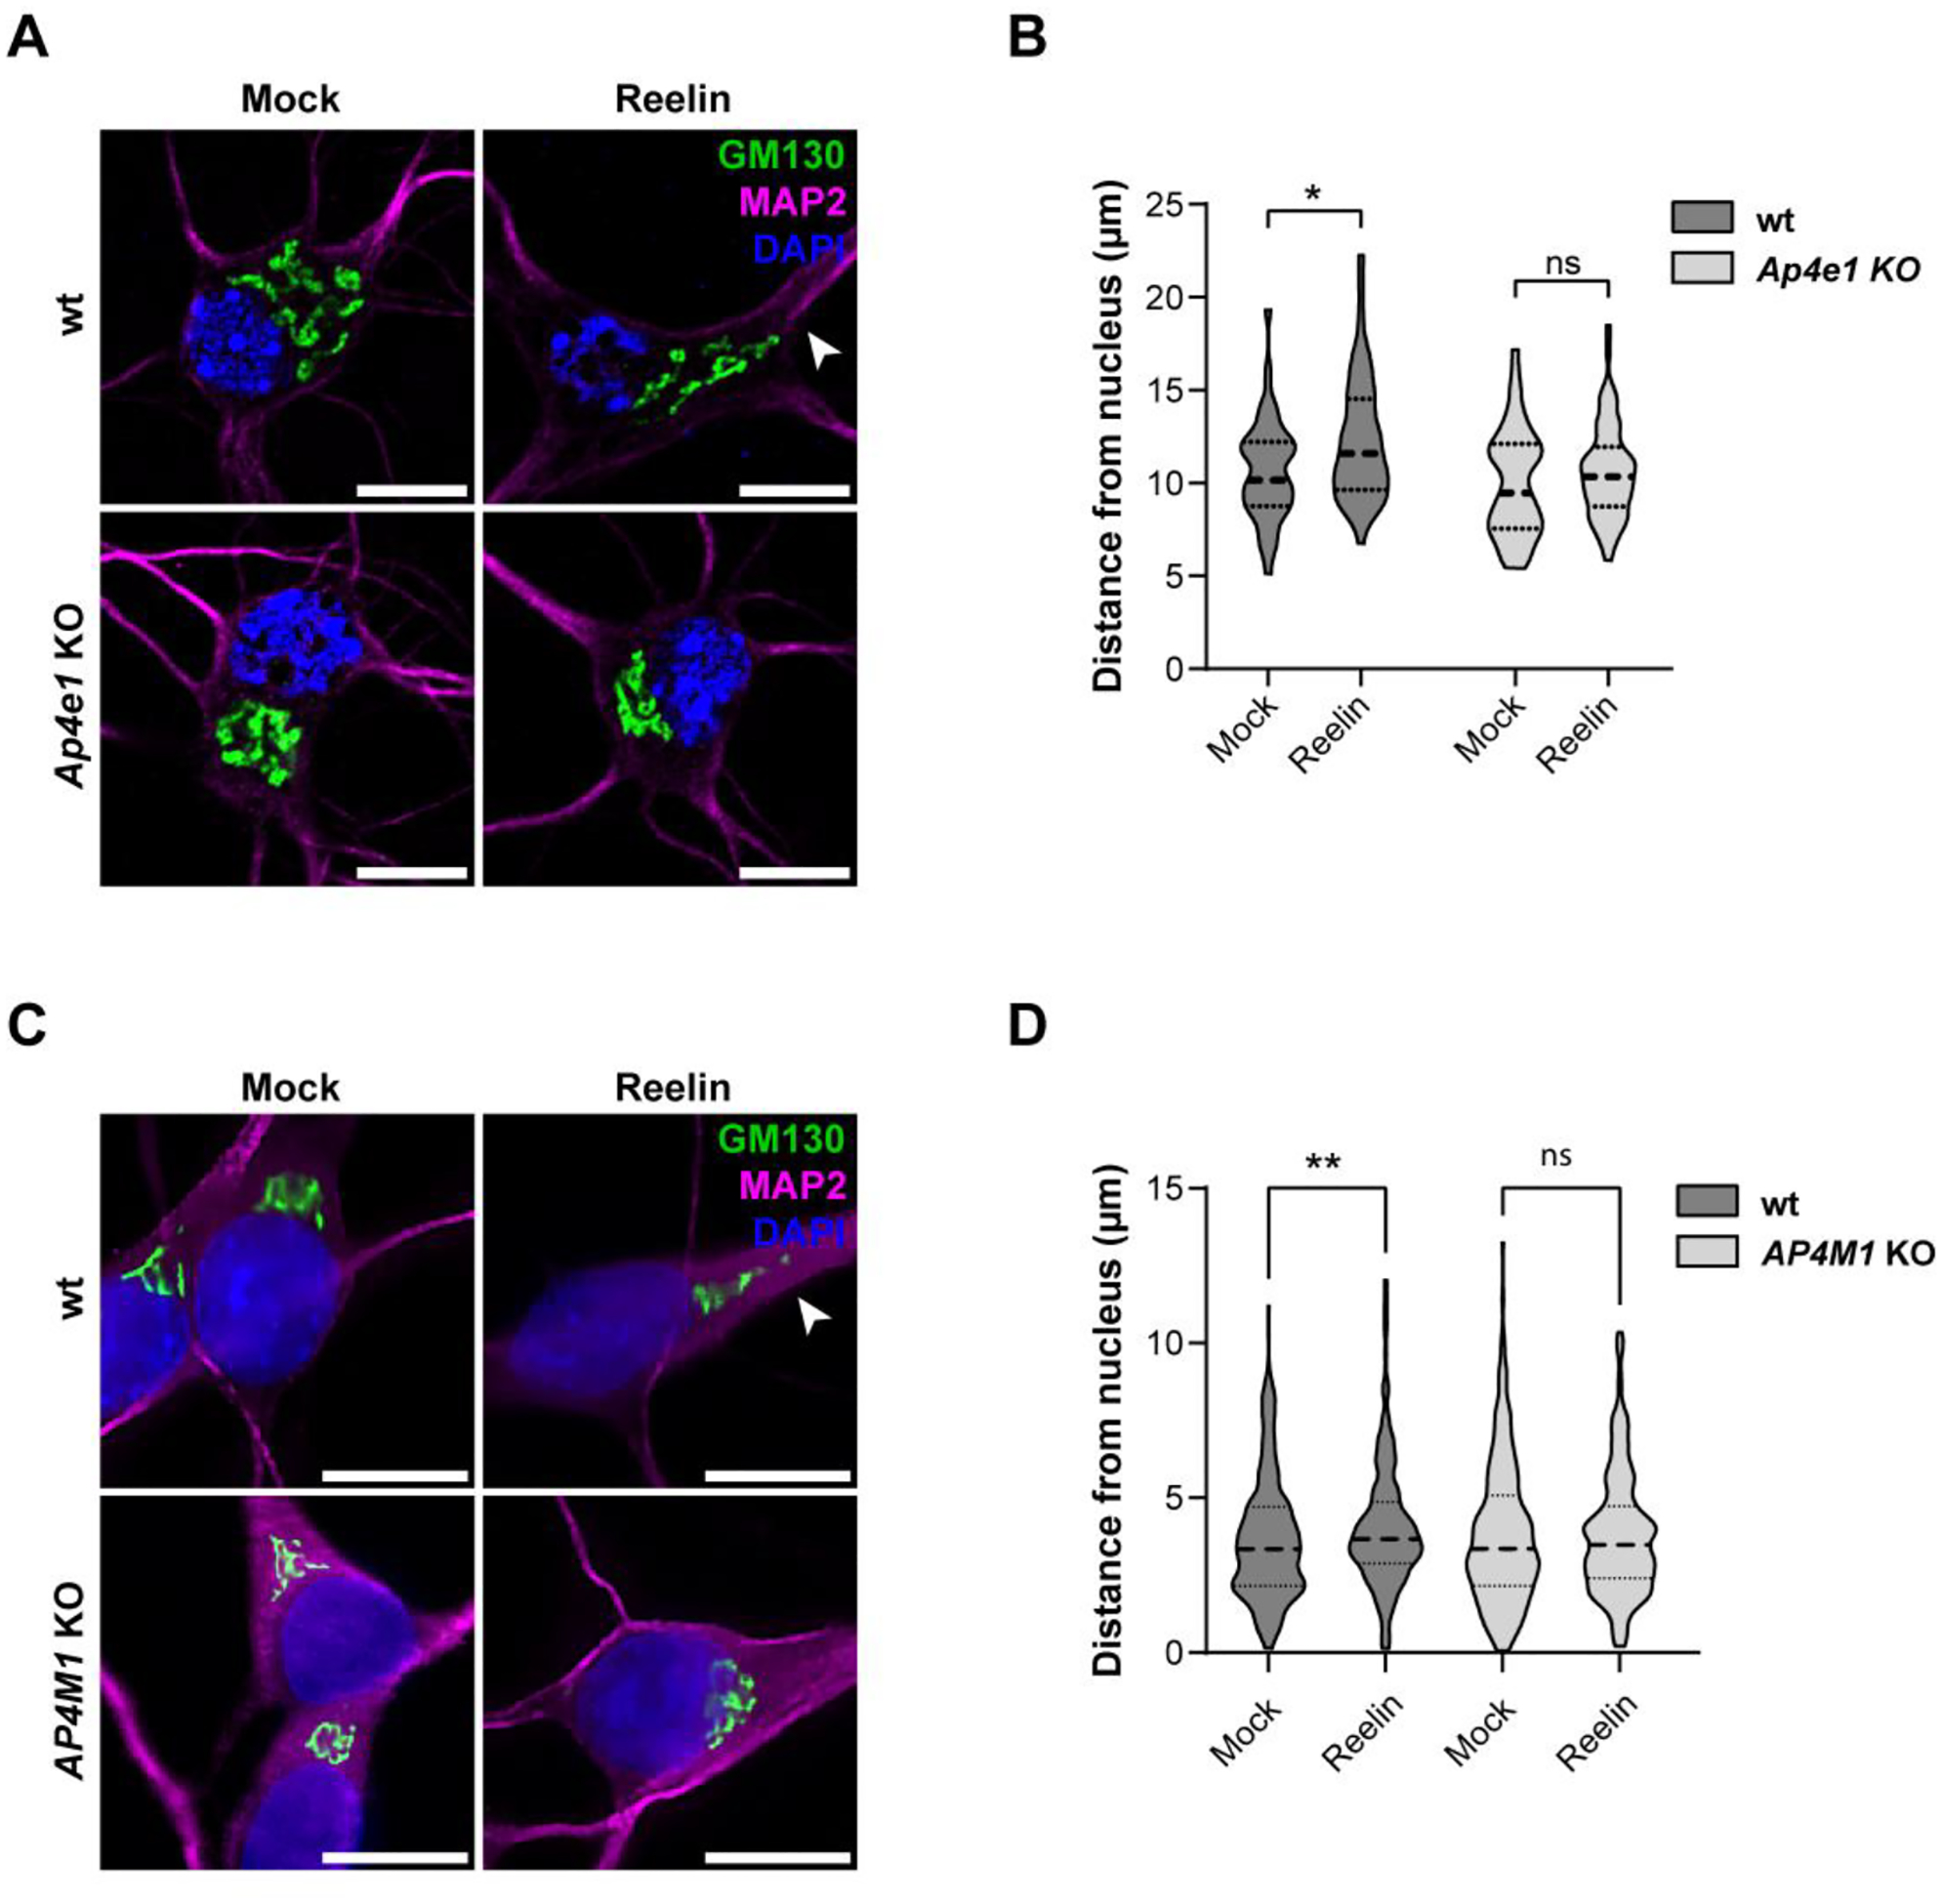
Adaptor protein complex 4 (AP-4) is a heterotetrameric complex that promotes export of selected cargo proteins from the trans-Golgi network. Mutations in each of the AP-4 subunits cause a complicated form of Hereditary Spastic Paraplegia (HSP). Herein, we report that ApoER2, a receptor in the Reelin signaling pathway, is a cargo of the AP-4 complex. We identify the motif ISSF/Y within the ApoER2 cytosolic domain as necessary for interaction with the canonical signal-binding pocket of the µ4 (AP4M1) subunit of AP-4. AP4E1- knock-out (KO) HeLa cells and hippocampal neurons from Ap4e1-KO mice display increased co-localization of ApoER2 with Golgi markers. Furthermore, hippocampal neurons from Ap4e1-KO mice and AP4M1-KO human iPSC-derived cortical i3Neurons exhibit reduced ApoER2 protein expression. Analyses of biosynthetic transport of ApoER2 reveal differential post-Golgi trafficking of the receptor, with lower axonal distribution in KO compared to wild-type neurons, indicating a role of AP-4 and the ISSF/Y motif in the axonal localization of ApoER2. Finally, analyses of Reelin signaling in mouse hippocampal and human cortical KO neurons show that AP4 deficiency causes no changes in Reelin-dependent activation of the AKT pathway and only mild changes in Reelin-induced dendritic arborization, but reduces Reelin-induced ERK phosphorylation, CREB activation, and Golgi deployment. This work thus establishes ApoER2 as a novel cargo of the AP-4 complex, suggesting that defects in the trafficking of this receptor and in the Reelin signaling pathway could contribute to the pathogenesis of HSP caused by mutations in AP-4 subunits.

Keywords: AP-4; ApoER2; Golgi; Hereditary Spastic Paraplegia; Neuron; Reelin.


Conflict of interest statement

Declaration of Competing Interest The authors state that this research was conducted in the absence of any commercial or financial relationships that could be construed as a potential conflict of interest.

Figures

Figure 1.
Figure 1.. Analysis of the interaction between the ApoER2 cytosolic tail and adaptor proteins.
(A, B) For Y2H analysis, yeast cells were co-transformed with plasmids encoding Gal4bd fused to wt ApoER2 cytosolic tail (residues 849–963; see Fig. 2A), and Gal4ad fused to Dab2-PTB (A) or to the indicated wt μ subunits of the adaptor protein complexes AP-1, AP-2, AP-3, and AP-4 (B). (C) Surface representation of human μ4 C-terminal domain (pdb entry 3L81) highlighting the position of residues at the canonical and non-canonical sites chosen for the Y2H analysis. The image was prepared with PyMOL Molecular Graphics System, version 2.0.6 Schrödinger, LLC. (D, E) Y2H analysis after transformation with plasmids encoding Gal4bd fused to wt ApoER2 cytosolic tail and Gal4ad fused to the indicated mutants of the μ4 subunit of AP-4. (F) Wild-type and AP4E1-KO HeLa cells were co-transfected with plasmids encoding human HA-tagged ApoER2 and μ4-GFP. In addition, cells were co-transfected with plasmids encoding the receptor with GFP as control. Twenty-four h later, cells were lysed, and cell extracts were immunoprecipitated using GFP-trap. The presence of the receptor was detected by immunoblotting. Notice that the receptor was present in all cell extracts (10 % of input), but was immunoprecipitated only from cells expressing μ4-GFP and the ε subunit of AP-4.
Figure 2.
Figure 2.. ApoER2 binds via an IXXF/Y motif to a canonical site on the μ4 subunit of AP-4.
(A) Sequence of the ApoER2 cytosolic tai (residues 849–963), highlighting in green three phenylalanine residues at positions 13, 49 and 76 relatives to R849 as residue 1 of the indicated cytosolic tail sequence. Highlighted in red are an NPXY motif and the sequence ISS adjacent to F49 that is important for interaction to μ4. (B, C) Y2H analysis of critical residues on the ApoER2 cytosolic tail for interaction with μ4. Yeast cells were co-transformed with plasmids encoding Gal4bd fused to wt or the indicated mutants of the ApoER2 cytosolic tail, and Gal4ad fused to the wt μ4 subunit of the AP-4 complex. Mouse p53 fused to Gal4bd and SV40 large T antigen (T Ag) fused to Gal4ad were used as controls. Co-transformed cells were spotted onto His-deficient (-His) or His-containing (+His) plates and incubated at 30 °C. (D-E) Isothermal titration calorimetry of YPAAISSFDR peptide (D) or YPAAASSADR peptide (E) with recombinant μ4 C-terminal domain. The Kd and stoichiometry (N) for the μ4-YPAAISSFDR interaction are expressed as the mean ± SD (n = 3). N/D: not determined. (F) Y2H analysis of the effect of substituting tyrosine for F49 in the cytosolic tail of human ApoER2 on interaction with μ4. The analysis was performed as described for panels B and C. (G) Wild-type HeLa cells were co-transfected with plasmids encoding FLAG-tagged mouse ApoER2 and μ4-GFP or GFP as control. Twenty-four h later, cells were lysed, and cell extracts were immunoprecipitated using GFP-trap. The presence of the receptor was detected by immunoblotting. Notice that the receptor was present in both cell extracts (8% of input) but was immunoprecipitated only from cells expressing μ4-GFP.
Figure 3.
Figure 3.. Increased co-localization of ApoER2 with Golgi marker GM130 in AP4E1-KO Hela cells.
(A, B) HeLa cells were transfected with plasmids encoding wt HA-ApoER2-GFP wt (green) (A) or HA-ApoER2-GFP F49A (green) (B) and immunostained 24 h later with anti-GM130 (red). Scale bar 20 μm. Magnified views of boxed areas are shown on the right. 20 μm-dotted lines were drawn to calculate the intensity profile using Fiji. (C) Graphs showing the Pearson’s correlation coefficient obtained from 39–58 cells pooled from 3–4 independent experiments. Statistical significance was calculated by ANOVA with Tukey’s multiple comparisons test, ***p<0.001.
Figure 4.
Figure 4.. Endogenous ApoER2 shows increased Golgi localization and reduced axonal distribution in Ap4e1-KO neurons.
(A) DIV5 mouse hippocampal neurons from wt and Ap4e1-KO mice were immunostained for endogenous ApoER2 (green) and GM130 (red). Magnified views of boxed areas are shown on the right. An inverted grayscale picture of the soma shows the distribution of ApoER2 puncta relative to a superimposed Golgi perimeter (red). Scale bar: 20 μm. (B) Graph showing Pearson’s correlation coefficient obtained from 36–60 neurons from 3 independent experiments. Statistical significance was calculated using the Mann-Whitney t-test. **p<0.01. (C) neurons from wt and Ap4e1-KO mice were transfected with a plasmid encoding EGFP, fixed 24 h later, and immunostained for endogenous ApoER2. Blue and red boxes show dendrites and axons, respectively. Magnified views of these boxes are in the middle and right panels. Scale bar: 20 μm. (D) Number of vesicles per μm was quantified using the analyze particles tool in Fiji. Bar graphs are representative of 12–20 neurons from 2 independent experiments. Statistical significance was calculated using the Mann-Whitney t-test. **p<0.01; ns: not significant.
Figure 5.
Figure 5.. AP-4 promotes axonal localization of ApoER2 in hippocampal neurons.
(A) wt and Ap4e1-KO mouse neurons were transfected at DIV4 with plasmids encoding HA-ApoER2-GFP or HA-ApoER2-GFP F49A (green) and fixed 24 h later. Neurons were immunostained with antibody to MAP2 (magenta) to identify dendrites. Arrowheads show the beginning and end of the axonal segment traced for further analysis. Scale bar: 20 μm. (B) The dendrite/axon polarity index of neurons from experiments was calculated as described in Methods from 10–24 neurons in n=4 independent experiments (ApoER2-GFP) or n=2 independent experiments (F49A). Statistical significance was calculated by Mann-Whitney t-test. *p<0.001, **** p<0.0001., ns, not significant (C) Images depicting the full length of the axon straightened from the axonal segments in panel A. (D) Axonal gray values of GFP signal throughout full-length axons were binned, averaged, and plotted as a heat map to show the spatial distribution of ApoER2 relative to the neuronal soma (see Methods). (E) wt and Ap4e1-KO mouse neurons were transfected at DIV4 with plasmids encoding N-terminal tagged HA-ApoER2, fixed 24 h later, and stained with anti-HA (green) and anti-MAP2 (magenta). Arrowheads show the beginning and end of the axonal segment traced for further analysis. Scale bar: 20 μm. (F) The dendrite/axon polarity index was calculated as described in Methods from 15–17 neurons obtained in n=3 independent experiments. Statistical significance was calculated by Mann-Whitney t-test. *p<0.001. (G) Images depicting the full-length of the axon straightened from the axonal segments in panel E. (H) Axonal gray values of HA signal throughout full-length axons were binned, averaged, and plotted as a heat map to show the spatial distribution of ApoER2 relative to the neuronal soma (see Methods).
Figure 6.
Figure 6.. FM4-HA-ApoER2-GFP synchronized release from the ER and its localization to the GC over time in HeLa cells
(A) Schematic representation of the construct FM4-HA-ApoER2-GFP. Signal sequence (SS), modified FKBP12 domain (FM), furin cleavage site (FCS), hemagglutinin epitope (HA), apolipoprotein E receptor 2 (ApoER2), green fluorescent protein (GFP) are indicated. (B) Schematic representation of the biosynthetic transport of FM4-HA-ApoER2-GFP without (left) and with DD-solubilizer (right). (C) Immunoblot detection of the HA epitope (top) and β-actin (bottom) in HeLa cells transfected with plasmids encoding FM4-HA-ApoER2-GFP or the plasmid HA-ApoER2-GFP (ctr lane) without the FM4 module, or untransfected cells (empty lane). Cells extracts were obtained after addition of DD-Solubilizer at the indicated times in min. (D) HeLa cells transfected with plasmids encoding FM4-HA-ApoER2-GFP (green) were fixed at the indicated times after addition of DD-Solubilizer. Cells were stained with anti-p230 (red). Dashed white lines delineate the plasma membrane. Scale bar: 20 μm (E) Pearson’s correlation coefficient analysis from 35–40 cells pooled from 3 independent experiments for each time point and cell line. Statistical significance was calculated by ANOVA with Tukey’s multiple comparisons test. ****p<0.0001.
Figure 7.
Figure 7.. Axonal polarity of ApoER2 is established during post-Golgi biosynthetic trafficking and depends on the receptoŕs F49 cytosolic amino acid residue.
(A) DIV7 rat hippocampal neurons were transfected with plasmids encoding wt FM4-HA-ApoER2-GFP or FM4-HA-ApoER2-GFP F49A and fixed at the indicated times after addition of DD-Solubilizer. Neurons were stained with anti-ANKG to identify the axon. Arrowheads point to the beginning and end of the axon. Scale bar: 20 μm. (B) The dendrite/axon polarity index was calculated as described in Methods from 7 neurons for each time point. Statistical significance was calculated by Mann-Whitney T-test. *p<0.05. (C) Images depicting the full length of the axon straightened from the axonal segments in panel A. (D) Axonal gray values of GFP signal throughout full-length axons were binned, averaged, and plotted as a heat map to show the spatial distribution of ApoER2 relative to the neuronal soma (see Methods).
Figure 8.
Figure 8.. Axonal polarity of ApoER2 is impaired during post-Golgi biosynthetic trafficking in Ap4e1-Neurons.
(A) Wild-type or F49A FM4-HA-ApoER2-GFP were expressed by transfection in DIV4 wt or Ap4e1-KO mouse neurons. After 16 h, neurons were treated with DD-Solubilizer for 120 min. Neurons were stained for MAP2 to identify dendrites. Arrows show the beginning and end of the axonal segment traced for further analysis Scale bar: 20 μm. (B) The dendrite/axon polarity index was calculated as described in Methods from 17–22 neurons from 3 independent experiments. Statistical significance was calculated using ANOVA with Tukey’s multiple comparisons test *p<0.05. (C) Images depicting the full length of the axon straightened from the axonal segments in panel A. (D) Axonal gray values of GFP signal throughout full-length axons were binned, averaged, and plotted as a heat map to show the spatial distribution of ApoER2 relative to the neuronal soma (see Methods.)
Figure 9.
Figure 9.. ApoER2 total, axonal and surface levels are reduced in neurons lacking AP-4.
(A) Immunoblot analysis of DIV12 hippocampal neurons from wt and Ap4e1-KO mice showed reduced levels of total ApoER2. (B) Cell surface proteins were biotinylated and analyzed by immunoblotting. Input, Inp (5% of the cell extract) and cell surface (S) levels of ApoER2 are shown for wt neurons (left blot) and Ap4e1-KO neurons (right blot) (C) ApoER2 total levels (n=3) and cell surface with respect to total levels corrected by actin (lower graph) (n=2). Statistical significance was calculated using the Mann-Whitney t-test. *p<0.05. (D) Cells extracts from wt and AP4M1-KO iPSCs and i3Neurons (i3N) at 1, 21 and 30 days of differentiation were analyzed by immunoblotting for ApoER2 and actin (control). ApoER2 exhibited a differential band pattern through differentiation and a reduction in total levels of the receptor at 30 days in AP4M1-KO compared with wt i3Neurons. (E) Wild-type and AP4M1-KO i3Neurons, differentiated for 28 and 30 days were lysed and analyzed by immunoblotting. Notice that ApoER2 levels were reduced (upper panel) and ATG9A levels increased in AP4M1-KO i3Neurons (lower panel). (F) ApoER2 and ATG9A total levels (n=5) from i3 Neurons, differentiated for 30 days. Statistical significance was calculated using t-test. *p<0.05. (G) i3Neurons differentiated for 30 days were surface biotinylated and levels of surface ApoER2 analyzed by immunoblotting. Notice that AP4M1-KO i3Neurons had reduced levels of ApoER2 at the cell surface compared with wt i3Neurons. In all the immunoblots, the positions of molecular mass markers (in kDa) are indicated on the left. (H) ApoER2 mRNA levels from wt and AP4M1-KO i3Neurons differentiated for 30 days (n=3). Expression levels are normalized to GAPDH expression using the delta-delta Cq method (2-ΔΔCq). Statistical significance was calculated using the Mann-Whitney t-test, ns, not significant. (I) Wild-type and AP4M1-KO i3Neurons, differentiated for 30 days were stained with anti-ApoER2 (grey) and anti-MAP2 (dendrites, green). Boxes show axons. Magnified images of these boxes are shown next to the panels. Scale bar: 20 μm. (J) The number of ApoER2 vesicles per μm2 of axons (negative for MAP2) was quantified using the analyze particles tool in Fiji. Upper graph represents 28 axon regions for each phenotype from 2 independent replicates. The lower left graph shows mean fluorescence intensity of ApoER2 in the somatic region, 20 neurons for wt and 25 neurons for AP4M1-KO. The lower right graph shows intensity of ApoER2 fluorescence measured in several regions of MAP2-positive dendrites. 50–60 regions of interest analyzed per phenotype. (n=2). Statistical significance was calculated using unpaired t-test. *p<0.05, ns, not significant.
Figure 10:
Figure 10:. Reelin-induced activation of AKT and dendritic outgrowth are not affected in AP-4-KO neurons
(A) DIV5 hippocampal neurons from wt and Ap4e1-KO mice were incubated without (mock) or with 10 nM Reelin for 48 h to induce dendritic development. Dendrites were analyzed by immunofluorescence microscopy using an antibody to endogenous MAP2. Scale bars: 20 μm. (B) Images from experiments such as that shown in panel A were analyzed using Sholl analysis, a measurement of the number of intersections a dendritic arbor has with concentric circles drawn with an increasing 10μm radius from the neuron center of mass, and the statistical significance was calculated by two-way ANOVA, Sidak’s multiple comparisons test. Results from 50–70 neurons per condition were obtained from 3 independent experiments. *p<0.05, **p<0.01, ***p<0.001. (C, D) DIV12–14 wt and Ap4e1-KO mouse hippocampal neurons were starved for 4 h and then stimulated with 10 nM Reelin for 20- and 40-min. Neurons were lysed, and the cell extracts subjected to immunoblot analysis to detect pAKT and total AKT. The data from starvation at each time was subtracted from the mock and Reelin conditions to obtain the bar graphs, as specified in Methods. Data are from 3 independent experiments. Statistical significance was calculated with Mann-Whitney t-test- *p<0.05. (E, F) Wild-type and AP4M1-KO i3Neurons differentiated for 30 days were starved in BrainPhys for 2 h and then stimulated with 10 nM Reelin for 20 and 40 min. Neurons were lysed, and the cell extracts subjected to immunoblot analysis to detect pAKT and total AKT. The data from depletion at each time was subtracted from the mock and Reelin conditions to obtain the bar graphs, as specified in Methods. Data in the graphs correspond to 3 independent experiments. Statistical significance was calculated using Mann-Whitney t-test. *p<0.05, **p<0.01, ***p<0.001. The positions of molecular mass markers (in kDa) in panels C and E are indicated on the right.
Figure 11:
Figure 11:. Activation of ERK and CREB induced by Reelin is reduced in neurons lacking AP-4.
(A,B) Wild-type and AP4M1-KO i3Neurons differentiated for 30 days were starved in BrainPhys for 2 h and then incubated without (mock) or with 10 nM Reelin for 20 and 40 min. Neurons were lysed and the cell extracts were subjected to immunoblot analysis to detect pERK and total ERK. The data from depletion at each time was subtracted from the mock and Reelin conditions to obtain the bar graphs, as specified in Methods. Data are from 3 independent experiments. Statistical significance was calculated using Mann-Whitney t-test, * p<0.05, ** p<0.01. (C) i3Neurons were starved for 2 h in Hanks’ medium, followed by an additional 30-min incubation in the presence of 10 nM Reelin or mock-conditioned medium. Ser-133–phosphorylated nuclear CREB was detected using a polyclonal phosphorylation-site–specific antibody (red), MAP-2 (green) and nuclei using DAPI (blue). Scale bars: 50 μm. (D) Quantification of the nuclear phospho-CREB intensity in neurons treated as in panel C. Data correspond to 2 independent experiments with a total of 223 wt neurons (108 mock, 115 Reelin) and a total of 214 total AP4M1-KO neurons analyzed (109 mock, 105 Reelin). Statistical significance was calculated by Kruskal-Wallis’s test with Dunn’s multiple comparisons test, ****p<0.0001.
Figure 12.
Figure 12.. Reelin-induced Golgi deployment is reduced in neurons lacking AP-4
(A) Wild-type and Ap4e1-KO DIV5 mouse hippocampal neurons treated without (mock) or with 10 nM Reelin for 2 h were stained for GM130 (green), MAP2 (magenta) and nuclei (DAPI, blue). Scale bars: 10 μm. (B) Distance from the nucleus to the outermost Golgi was measured using the straight-line tool in Fiji. Statistical analyses were done from 40–60 neurons in 2 independent experiments. Statistical significance was calculated by ANOVA with Tukey’s multiple comparisons test. *p<0.05. (C) Wild-type and AP4M1-KO i3Neurons were differentiated for 12 days, starved in BrainPhys for 2 h, and treated without (mock) or with 10 nM Reelin for 30 min. Fixed neurons were stained for GM130 (green), MAP2 (magenta) and nuclei (DAPI, blue). Scale bars: 10 μm. (D) Distance between the outermost Golgi and the nucleus was measured using a straight-line tool in Fiji. At least 70 cells were measured from 3 independent experiments. Statistical significance was calculated by ANOVA with Tukey’s multiple comparisons test. **p<0.01.

Update of

References

    1. Abdollahpour H, Alawi M, Kortum F, Beckstette M, Seemanova E, Komarek V, Rosenberger G and Kutsche K (2015). “An AP4B1 frameshift mutation in siblings with intellectual disability and spastic tetraplegia further delineates the AP-4 deficiency syndrome.” Eur J Hum Genet 23(2): 256–259. - PMC - PubMed
    1. Al-Bassam S, Xu M, Wandless TJ and Arnold DB (2012). “Differential trafficking of transport vesicles contributes to the localization of dendritic proteins.” Cell Rep 2(1): 89–100. - PMC - PubMed
    1. Bal M, Leitz J, Reese AL, Ramirez DM, Durakoglugil M, Herz J, Monteggia LM and Kavalali ET (2013). “Reelin mobilizes a VAMP7-dependent synaptic vesicle pool and selectively augments spontaneous neurotransmission.” Neuron 80(4): 934–946. - PMC - PubMed
    1. Beffert U, Durudas A, Weeber EJ, Stolt PC, Giehl KM, Sweatt JD, Hammer RE and Herz J (2006). “Functional dissection of Reelin signaling by site-directed disruption of Disabled-1 adaptor binding to apolipoprotein E receptor 2: distinct roles in development and synaptic plasticity.” J Neurosci 26(7): 2041–2052. - PMC - PubMed
    1. Beffert U, Morfini G, Bock HH, Reyna H, Brady ST and Herz J (2002). “Reelin-mediated signaling locally regulates protein kinase B/Akt and glycogen synthase kinase 3beta.” J Biol Chem 277(51): 49958–49964. - PubMed

MeSH terms

Substances