. 2024 Apr;30(2):247-262.
doi: 10.3350/cmh.2023.0449. Epub 2024 Jan 26.

Identification of signature gene set as highly accurate determination of metabolic dysfunction-associated steatotic liver disease progression

Affiliations

Identification of signature gene set as highly accurate determination of metabolic dysfunction-associated steatotic liver disease progression

Sumin Oh et al. Clin Mol Hepatol. 2024 Apr.

Abstract

Background/aims: Metabolic dysfunction-associated steatotic liver disease (MASLD) is characterized by fat accumulation in the liver. MASLD encompasses both steatosis and MASH. Since MASH can lead to cirrhosis and liver cancer, steatosis and MASH must be distinguished during patient treatment. Here, we investigate the genomes, epigenomes, and transcriptomes of MASLD patients to identify signature gene set for more accurate tracking of MASLD progression.

Methods: Biopsy-tissue and blood samples from patients with 134 MASLD, comprising 60 steatosis and 74 MASH patients were performed omics analysis. SVM learning algorithm were used to calculate most predictive features. Linear regression was applied to find signature gene set that distinguish the stage of MASLD and to validate their application into independent cohort of MASLD.

Results: After performing WGS, WES, WGBS, and total RNA-seq on 134 biopsy samples from confirmed MASLD patients, we provided 1,955 MASLD-associated features, out of 3,176 somatic variant callings, 58 DMRs, and 1,393 DEGs that track MASLD progression. Then, we used a SVM learning algorithm to analyze the data and select the most predictive features. Using linear regression, we identified a signature gene set capable of differentiating the various stages of MASLD and verified it in different independent cohorts of MASLD and a liver cancer cohort.

Conclusion: We identified a signature gene set (i.e., CAPG, HYAL3, WIPI1, TREM2, SPP1, and RNASE6) with strong potential as a panel of diagnostic genes of MASLD-associated disease.

Keywords: Biomarker; MASLD; Machine learning; Multi-omics; Signature gene set.


Conflict of interest statement

Conflicts of Interest

The authors have no conflicts to disclose.

Figures

Figure 1.
Figure 1.
MASLD-associated somatic variants identified through comprehensive WGS and WES analysis. (A) Overall research strategy for identifying MASLD-associated features via a multi-omics approach. (B) Pipeline for calling somatic variants. (C) Distribution of genes with MASLD-associated somatic variations across the chromosomes. (D) Pie chart showing genes with exclusive or non-exclusive variants. (E) Dot plot presenting the types of mutations in genes with exclusive or non-exclusive variants. (F) Dot plot showing gene expression changes between the altered and non-altered groups. MASLD, metabolic dysfunction-associated steatotic liver disease; WES, whole exome sequencing; WGBS, whole genome bisulfite sequencing; WGS, whole genome sequencing; DEGs, differentially expressed genes; DMRs, differentially methylated regions.
Figure 2.
Figure 2.
Identification of differentially methylated regions associated with MASLD progression. (A) Scatter plot showing genes with a methylation ratio that is significantly different between steatosis and MASH samples. (B) Correlation between DNA methylation status and gene expressions. (C) Representative loci showing hypermethylation in the PACS2 and hypomethylation in the PEG10 promoter. MASLD, metabolic dysfunction-associated steatotic liver disease; MASH, metabolic dysfunction-associated steatohepatitis.
Figure 3.
Figure 3.
Transcriptomic profiling of MASLD progression. (A) Line plot representing gene expression fold change in the comparison between steatosis and MASH samples. (red, MASH-enriched genes; blue, steatosis-enriched genes). Heat map showing the expression levels of 1,393 genes in 133 MASLD patients. (B) Bar plots showing the results of GO analysis for steatosis- and MASH-enriched genes. (C) Representative results of a motif search analysis and TRRUST analyses. Left bar, motif search results based on known or de novo motif sequences; right bar, the results of the enrichment analysis by TRRUST. MASLD, metabolic dysfunction-associated steatotic liver disease; MASH, metabolic dysfunctionassociated steatohepatitis; GO, Gene ontology; DEGs, differentially expressed genes.
Figure 4.
Figure 4.
Comprehensive networks of MASLD-associated features within functional modules. (A) Representative MASLD-associated functional modules. The proportion of genes with MASLD-associated somatic variants (blue), DMRs (red), and DEGs (black) in each individual functional module (The range for black is 0–20%, for blue is 0–5%, and for red is 0–1%). (B) Circular plot indicating that individual functional modules included genetic, epigenetic, and transcriptomic features. (C) Bar plot showing the proportion of MASLD-associated somatic variations, DMRs, and DEGs assigned to functional modules. (D) Line plot showing that MASLD-associated features were simultaneously related with one another in functional modules. (E) Maps of the PPI networks of MASLD-associated features involved in the response to cytokines and regulation of immune system processes modules. MASLD, metabolic dysfunction-associated steatotic liver disease; DMRs, differentially methylated regions; DEGs, differentially expressed genes; PPI, protein-protein interaction.
Figure 5.
Figure 5.
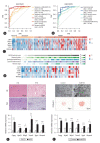
Using machine learning modeling to select features that permit MASLD stage discrimination. (A) Feature selection via machine learning modeling. (B) 203 stacked features obtained from 16 independent models. (C) Designing the signature gene set consisting of the topranked genes that provided the highest accuracy. (D) Dot plot of signature gene sets of various sizes against their accuracy in discriminating MASLD stages. The chosen gene set is indicated (ACC=0.955). (E) ROC curve plots showing the accuracy of the 6 signature gene set and individual genes (6 signature set P-value=1.04E-19; CAPG P-value=2.48E-14; HYAL3 P-value=1.26E-11; WIPI1 P-value=1.57E-10; TREM2 P-value=3.64E-13; SPP1 P-value=1.28E-12; RNASE6 P-value=9.19E-07). (F) ROC curve plots indicating the accuracy of non-invasive indices and the signature gene set (6 signature set P-value=1.04E-19; FIB-4 P-value=4.48E-04; Hepatic Steatosis Index P-value=5.11E-02; NAFLD fibrosis score P-value=5.50E-02). MASLD, metabolic dysfunction-associated steatotic liver disease; ACC, accuracy; ROC, receiver operating characteristic.
Figure 6.
Figure 6.
Application of the signature gene set to MASLD progression. (A) ROC curve plots describing the ratio of the true positive rate (TPR) and false positive rate (FPR) for the GLM designed using the signature gene set when predicting results from an independent cohort of normal (n=10), steatosis (n=51) and MASH (n=155) samples (Steatosis vs. MASH(F0-F4) P-value=1.28E-10; Steatosis vs. MASH(F0-F2) P-value=9.03E-08; Steatosis vs. MASH(F3-F4) P-value=7.00E-12; Normal vs. MASLD P-value=3.07E-07; Normal vs. Steatosis P-value=4.67E-06; Normal vs. MASH P-value=2.00E-07). (B) Validation of the accuracy of the signature gene set between various histological features related to MASLD (Steatosis grade P-value=2.29E-05; Lobular inflammation P-value= 1.48E-05; NAFLD activity score P-value=4.31E-09; Fibrosis stage P-value=8.51E-07; Cytological ballooning P-value=2.75E-05). (C) Heatmap showing the expression levels of the signature genes from normal, steatosis, and MASH samples. (D) The expression levels of signature genes in subgroups of histological features related to MASLD. (E) H&E and PAS staining showing liver morphology changes in an in vivo model fed an HFD compared to an LFD (Top). Expression levels of the signature genes in an in vivo model measured by qRT-PCR (Bottom). (F) Representative bright-field images showing morphology changes in mouse hepatic organoids treated with 1 mM FFA. Oil red O staining showed lipid accumulation in organoids treated with 1 mM FFA, mimicking hepatic steatosis (Top). Relative mRNA expression levels of the signature genes in mouse hepatic organoids treated with 1 mM FFA (Bottom). (Student’s t-test, P-value; *<0.05, **<0.01, ***<0.001). MASLD, metabolic dysfunction-associated steatotic liver disease; ROC, receiver operating characteristic; GLM, generalized linear regression model; MASH, metabolic dysfunction-associated steatohepatitis; FFA, free fatty acid.
Figure 7.
Figure 7.
Validation of the signature gene set in HCC. (A) ROC curve plots illustrating the ratio between the TPR and FPR of GLM designed with the signature genes in predicting the status of an independent cohort of samples for control (n=50) and liver cancer (n=50) (6 signature set P-value=2.66E-16; CAPG P-value=3.00E-13; HYAL3 P-value=1.34E-03; WIPI1 P-value=5.68E-02; TREM2 P-value=9.64E-12; SPP1 P-value=1.34E-03; RNASE6 P-value=9.91E-01). (B) Kaplan-Meier survival plots showing the survival rates according to the expression levels of the signature genes in liver cancer. HCC, hepatocellular carcinoma; ROC, receiver operating characteristic; TPR, true positive rate; FPR, false positive rate; GLM, generalized linear regression model.
Figure 8.
Figure 8.
Altered chromatin accessibility of signature genes in MASLD progression. (A) Density plot of chromatin accessibility in the promoter regions of MASH-enriched genes. (B) Heatmap showing enrichment of open chromatin structures in regions associated with the signature genes scaled according to their z-score. (C) PCA plot representing the ability of chromatin accessibility status to discriminate MASLD stages. (D) Snapshots showing increased chromatin accessibility at open chromatin regions annotated to CAPG and HYAL3 in MASH samples compared to steatosis samples. MASLD, metabolic dysfunction-associated steatotic liver disease; MASH, metabolic dysfunction-associated steatohepatitis; PCA, principal component analysis.
None

Comment in

References

    1. Eslam M, Sanyal AJ, George J, International Consensus Panel MAFLD: A consensus-driven proposed nomenclature for metabolic associated fatty liver disease. Gastroenterology. 2020;158:1999–2014.e1. - PubMed
    1. Badmus OO, Hillhouse SA, Anderson CD, Hinds TD, Stec DE. Molecular mechanisms of metabolic associated fatty liver disease (MAFLD): functional analysis of lipid metabolism pathways. Clin Sci (Lond) 2022;136:1347–1366. - PMC - PubMed
    1. Yew KC, Wong SH, Wong VW, Oon HH. Letter regarding “Waiting for the changes after the adoption of steatotic liver disease”. Clin Mol Hepatol. 2024;30:118–120. - PMC - PubMed
    1. Nassir F, Rector RS, Hammoud GM, Ibdah JA. Pathogenesis and prevention of hepatic steatosis. Gastroenterol Hepatol (N Y) 2015;11:167–175. - PMC - PubMed
    1. Mazzolini G, Sowa JP, Atorrasagasti C, Kücükoglu Ö, Syn WK, Canbay A. Significance of simple steatosis: An update on the clinical and molecular evidence. Cells. 2020;9:2458. - PMC - PubMed