. 2024 Jan 29;16(1):1.
doi: 10.1186/s13073-023-01272-6.

Single-cell analysis of immune and stroma cell remodeling in clear cell renal cell carcinoma primary tumors and bone metastatic lesions

Affiliations

Single-cell analysis of immune and stroma cell remodeling in clear cell renal cell carcinoma primary tumors and bone metastatic lesions

Shenglin Mei et al. Genome Med. .

Abstract

Background: Despite therapeutic advances, once a cancer has metastasized to the bone, it represents a highly morbid and lethal disease. One third of patients with advanced clear cell renal cell carcinoma (ccRCC) present with bone metastasis at the time of diagnosis. However, the bone metastatic niche in humans, including the immune and stromal microenvironments, has not been well-defined, hindering progress towards identification of therapeutic targets.

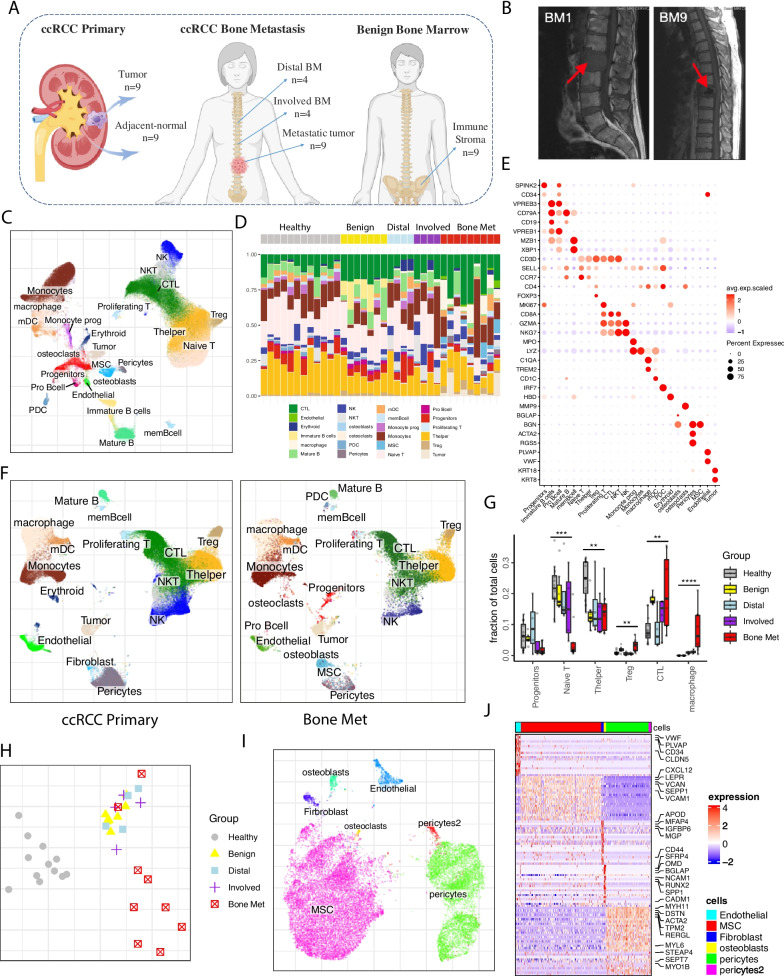
Methods: We collected fresh patient samples and performed single-cell transcriptomic profiling of solid metastatic tissue (Bone Met), liquid bone marrow at the vertebral level of spinal cord compression (Involved), and liquid bone marrow from a different vertebral body distant from the tumor site but within the surgical field (Distal), as well as bone marrow from patients undergoing hip replacement surgery (Benign). In addition, we incorporated single-cell data from primary ccRCC tumors (ccRCC Primary) for comparative analysis.

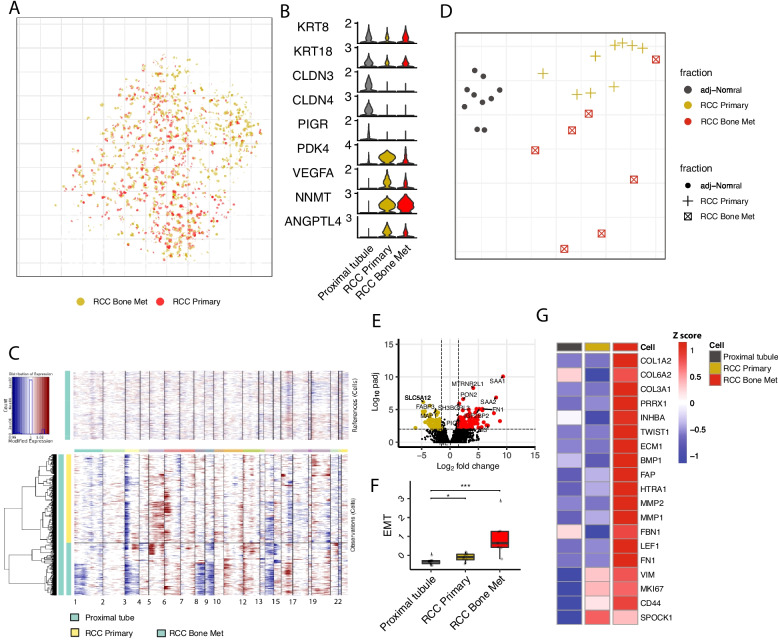
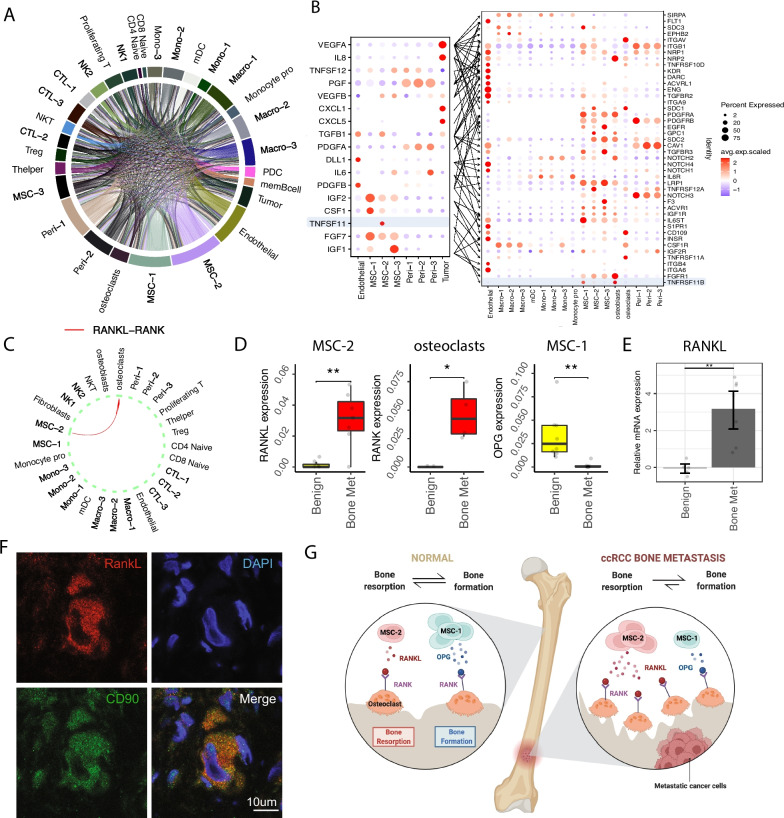
Results: The bone marrow of metastatic patients is immune-suppressive, featuring increased, exhausted CD8 + cytotoxic T cells, T regulatory cells, and tumor-associated macrophages (TAM) with distinct transcriptional states in metastatic lesions. Bone marrow stroma from tumor samples demonstrated a tumor-associated mesenchymal stromal cell population (TA-MSC) that appears to be supportive of epithelial-to mesenchymal transition (EMT), bone remodeling, and a cancer-associated fibroblast (CAFs) phenotype. This stromal subset is associated with poor progression-free and overall survival and also markedly upregulates bone remodeling through the dysregulation of RANK/RANKL/OPG signaling activity in bone cells, ultimately leading to bone resorption.

Conclusions: These results provide a comprehensive analysis of the bone marrow niche in the setting of human metastatic cancer and highlight potential therapeutic targets for both cell populations and communication channels.


Conflict of interest statement

P.V.K serves on the Scientific Advisory Board to Celsius Therapeutics, Inc., and Biomage Inc. D.B.S. is a co-founder and holds equity in Clear Creek Bio and is a consultant and holds equity in SAFI Biosolutions. D.T.S. is a founder, director, and stockholder of Magenta Therapeutics, Clear Creek Bio, and LifeVaultBio. He is a director and stockholder of Agios Pharmaceuticals and Editas Medicines and a founder and stockholder of Fate Therapeutics and Geruda Therapeutics. He is a consultant for FOG Pharma, Inzen Therapeutics, ResoluteBio, and VCanBio and receives sponsored research support on an unrelated project from Sumitomo Dianippon. D.B.S. is a founder, consultant, and shareholder for Clear Creek Bio. The remaining authors declare that they do not have any competing interests.

Figures

Fig. 1
Fig. 1
Overview of immune and stromal cell landscape in ccRCC bone metastasis. A Schematic illustration of experiment design and patient sample processing. B Sagittal T1 MRI imaging of the thoracic spine showing tumor masses with spinal cord compression for BM1 and BM9. C Integrative analysis of scRNA-seq samples of all bone marrow samples (Healthy, Benign, Involved, Distal, and Bone Met), visualized using a common UMAP embedding. D Bar plot representing the fraction of major cell types within each sample (column). E Dot plot representing key-marker gene expression in major cell types. The color represents scaled average expression of marker genes in each cell type, and the size indicates the proportion of cells expressing marker genes. F Integrative analysis of scRNA-seq samples from ccRCC primary and bone metastatic tumors, visualized using a common UMAP embedding for ccRCC primary samples (left), bone metastasis samples (right). G Comparison of relative cell abundance of major cell clusters between Bone Met (n = 9) and different control fractions (Healthy n = 12, Benign n = 7, Involved n = 4, Distal n = 4). Statistics are accessed with two-sided Wilcoxon rank sum test and BH multiple testing correction. (*p < 0.05, ***p < 0.001). H Pairwise expression distances between samples are shown using MDS embeddings. The similarity measures the magnitude of expression change for each subpopulation, using size-weighted average to combine them into an overall expression distance that controls the compositional differences. Each dot is a sample, with colors and point shapes corresponding to the sample condition. I UMAP embedding of joint alignment of the Benign bone marrow stromal cells, color coded by the cell type. J Heatmap of scaled normalized expression for representative marker gene expression in stromal cell populations
Fig. 2
Fig. 2
Distinct tumor-associated macrophage subpopulations in ccRCC bone metastasis. A UMAP joint embedding showing myeloid cell subsets. B Comparison of relative cell abundance of myeloid cell subsets between Bone Met (n = 9) and different control fractions (Healthy n = 12, Benign n = 7, Involved n = 4, Distal n = 4). Statistics are accessed with two-sided Wilcoxon rank sum test and BH multiple testing correction. (*p < 0.05, ***p < 0.001, Additional file 1: Table S3). C Box plot showing the percent of Macrophages (CD68 +) of the CD45 + / CD11b + population in Bone Met (n = 4) and Distal (n = 4) by flow cytometry. Statistical significance determined using two-sided t-test (*p < 0.05). D Scaled average expression of M2 signature genes visualized on UMAP embedding. E Representative M2 marker gene expression shown on violin plot. F UMAP joint embedding showing integrated analysis of myeloid cells from ccRCC primary tumor and bone metastasis tumor. G Violin plot showing representative marker gene expression across three macrophage subpopulations. H Box plot comparing proportion of macrophage populations across bone metastatic ccRCC (n = 9), primary ccRCC (n = 14), and adjacent normal tissue (n = 9). Statistics are accessed with two-sided Wilcoxon rank sum test and BH multiple testing correction. (*p < 0.05, ***p < 0.001). I Dot plots showing cytokine gene expression across different macrophage subsets. The color represents scaled average expression of marker genes in each cell type, and the size indicates the proportion of cells expressing marker genes. J, K Gating strategy for enrichment of TREM2 + SPP1 + macrophages. Labels above the flow plots refer to the parent population in the percentages are of the parent gate (J). Box plot showing the percent of TREM2 + /SPP1 + cells for the CD45 + / CD11b + population in Bone Met (n = 4) and Distal (n = 4). Statistical significance was determined using two-sided t-test (K). L Kaplan–Meier curves showing ccRCC samples with higher Macro-2 signature gene (SPP1, FABP5, CCL18, CXCL5, CCL7) expression have worse overall survival (top; n = 533) and progression-free survival (bottom; n = 435) in TCGA KIRC data. Patients were stratified into two groups based on the average expression (binary: top 25% versus bottom 25%) of Macro-2 signatures. p value was evaluated using Log-rank test. Bootstrap resampling was performed on signature genes and p-value was calculated using the 95% reproducibility power p-value (see the “Methods” section)
Fig. 3
Fig. 3
Dysfunctional T cells correlate with Macro-2. A UMAP embedding demonstrating T cell subpopulations. B Visualization of the average cell density across Bone Met (n = 9) and multiple control conditions (Healthy n = 12, Benign n = 7, Involved n = 4, Distal n = 4), using embedding density estimates. Brighter colors correspond to denser regions (see the “Methods” section). C Expression of representative T cell exhaustion markers on UMAP embedding. D Box plots showing T cell exhaustion score within CTL-3 across Bone Met (n = 9) and control conditions (Healthy n = 12, Benign n = 7, Involved n = 4, Distal n = 4). Statistics are accessed with two-sided Wilcoxon rank sum test and BH multiple testing correction (*p < 0.05). For box plots, center line represents the median and box limits represent upper and lower quartiles, and whiskers depict 1.5 × the interquartile range (IQR). E Comparison of PDCD1 expression (MFI) in Distal (n = 4) and Bone Met (n = 4) samples. Statistical significance determined using two-sided t-test (*p < 0.05). F ICOS, CTLA4, TNFRSF4, and TNFRSF18 expression in Tregs shown as violin plot. G Bar plot showing CTL-3 (top) and Treg abundance (bottom) comparing RCC Bone Met (n = 9) with RCC Primary (n = 14) and adjacent normal (n = 9) fractions. Statistics are accessed with two-sided Wilcoxon rank sum test (*p < 0.05, **p < 0.01). H Violin plot showing representative exhausted T cell signature gene expression in CTL-3 comparing RCC Bone Met with RCC Primary and adjacent normal fractions. I Correlations of the cell abundance between myeloid and T cell subsets shown as heatmap. Significance was assessed using Pearson correlation test and BH multiple testing correction. Color represents correlation coefficient and star presents the significance. (*p < 0.05). J Heatmap showing scaled average expression of CCL18 and CCR8 in major cell populations. K Circle plots showing the inferred CCL18-CCR8 signaling between Macro-2 and Treg. L Box plot showing CCL18 and CCR8 abundance in tumor (n = 72) compared to adjacent normal (n = 533) tissue in TCGA KIRC. Statistics are accessed with two-sided Wilcoxon rank sum test (****p < 0.0001). M Correlation of CCR8 expression in Tregs and CTL-3 exhaustion score in CTL-3 is shown as a scatter plot. Pearson linear correlation estimate, and p-values are shown. The error band indicates 95% confidence interval. N Correlation of CCR8 expression and CTL-3 exhaustion score is shown as a scatter plot for TCGA KIRC data (n = 533). Pearson linear correlation estimate, and p-values are shown
Fig. 4
Fig. 4
A distinct tumor-associated mesenchymal stroma cell (MSC) in ccRCC bone metastasis displaying CAFs phenotype. A UMAP embedding showing stromal cell subpopulations (left) and cell density difference comparing tumor with benign condition (right). Z score evaluates whether the cells are enriched in tumor (high Z score, red) or benign (low Z score, blue) condition. B Dot plot representing key-marker gene expression of stromal cell types. The color represents scaled average expression of marker genes in each cell type, and the size indicates the proportion of cells expressing marker genes. C Visualization of MSC marker gene expression shown as violin plot. D Bar plot illustrates cell abundance differences between Bone Met (n = 9) and Benign (n = 9) conditions for MSC-1 (left) and MSC-2 (right). Significance was assessed using two-sided Wilcoxon rank sum test. E Heatmap showing scaled average gene expression in MSC-2 across Bone Met and Benign conditions for each patient (column). F UMAP visualization of representative EMT and CAFs signature gene expression in stromal cells. G EMT gene signature score in stromal cells, UMAP visualization of EMT score (left). Violin plots of the EMT gene signature score in Bone Met and Benign MSC-2 cells (right). Significance was assessed using two-sided Wilcoxon rank sum test (****p < 0.0001). H Similar to Fig. 4G, showing CAF gene signature score (****p < 0.0001). I Bar plot showing relative mRNA expression (log fold change) of FAP and FN1 in Benign (n = 5) and Bone Met (n = 7) tissue by RT-qPCR. Data are expressed using the 2 − ∆∆Ct method. Gene expression levels were normalized to the benign control. Statistical significance determined using two-sided t-test. J Kaplan–Meier curves showing ccRCC samples with higher MSC-2 signature gene (COL6A2, FN1, TIMP1, COL3A1, COL1A2) expression have worse progression-free and overall survival (n = 533) in TCGA KIRC data. Patients were stratified into two groups based on the average expression (binary: top 25% versus bottom 25%) of MSC-2 signatures. p value was evaluated using Log-rank test. Bootstrap resampling was performed on signature genes and p-value was calculated using the 95% reproducibility power p-value (see the “Methods” section). For box plots, center line represents the median and box limits represent upper and lower quartiles, and whiskers depict 1.5 × the interquartile range (IQR)
Fig. 5
Fig. 5
EMT programs promoting metastatic behavior are highly elevated in metastatic ccRCC. A Joint embedding of tumor cells from ccRCC primary and ccRCC Bone Met samples. B Violin plots of genes expressed in the proximal tubule of the normal adjacent kidney tissue, ccRCC primary, and ccRCC Bone Met tumor cells. C InferCNV analysis showing CNV pattern of metastatic and primary tumor cells taking proximal tube cells as control. D Pairwise expression distances between samples are shown using MDS embeddings. Each dot is a sample, with colors and point shapes corresponding to the sample condition. E Volcano plot illustrate differential expressed genes comparing bone metastatic tumor cells compared with primary ccRCC tumor cells. The vertical dashed lines show the cut-off for gene filtering (log2FoldChange 1.5 and − 1.5), and the horizontal dashed line signifies an adjusted p value of 0.01 (see the “Methods” section). F Box plot comparing the EMT gene signature score across proximal tubule of the normal adjacent kidney tissue, ccRCC primary, and ccRCC Bone Met tumor cells. For box plots, center line represents the median and box limits represent upper and lower quartiles, and whiskers depict 1.5 × the interquartile range (IQR). G Heatmap showing representative EMT signature genes expression in proximal tubule of the normal adjacent kidney tissue, ccRCC primary, and ccRCC Bone Met tumor cells. Color represents scaled average gene expression
Fig. 6
Fig. 6
Tumor-associated MSCs source to bone remodeling of ccRCC bone metastasis. A Overview of number of significant ligand receptor pairs (Additional file 1: Table S6). B Bubble heatmap showing expression of ligand (left: tumor cells and stromal cell subsets) and receptor (right: stromal and myeloid subsets) pairs in different stromal and immune subsets. Dot size indicates expression ratio; colored represents average gene expression. C Circle plots showing the inferred RANKL-RANK signaling between MSC-2 and osteoclasts. D Box plot showing RANKL expression in MSC-2 and OPG expression in MSC-1 (Benign n = 8; Bone Met n = 7). Average gene expression was used, each dot represents a sample. Significance was assessed using two-sided Wilcoxon rank sum test (*p < 0.05, **p < 0.01). E Bar plot showing relative mRNA expression (log fold change) of RANKL in Benign (n = 5) and Bone Met (n = 7) tissue by RT-qPCR. Data are expressed using the 2 − ∆∆Ct method. Gene expression levels were normalized to the benign control. Statistical significance determined using two-sided t-test. F Immunostaining in tissue from bone metastatic ccRCC stained for RANKL, MSC-2 specific marker CD90, and DAPI. G Schematic illustration of MSC cell shift in mediating RANKL/OPG-RANK signaling pathway. For box plots, center line represents the median and box limits represent upper and lower quartiles, and whiskers depict 1.5 × the interquartile range (IQR)

References

    1. Weilbaecher KN, Guise TA, McCauley LK. Cancer to bone: a fatal attraction. Nat Rev Cancer. 2011;11:411–425. doi: 10.1038/nrc3055. - DOI - PMC - PubMed
    1. Macedo F, Ladeira K, Pinho F, Saraiva N, Bonito N, Pinto L, et al. Bone metastases: an overview. Oncol Rev. 2016;11:321. https://www.ncbi.nlm.nih.gov/pmc/articles/PMC5444408/. - PMC - PubMed
    1. Bhatt JR, Finelli A. Landmarks in the diagnosis and treatment of renal cell carcinoma. Nat Rev Urol. 2014;11:517–525. doi: 10.1038/nrurol.2014.194. - DOI - PubMed
    1. Chen S-C, Kuo P-L. Bone metastasis from renal cell carcinoma. Int J Mol Sci. 2016;17:987. doi: 10.3390/ijms17060987. - DOI - PMC - PubMed
    1. Clézardin P, Coleman R, Puppo M, Ottewell P, Bonnelye E, Paycha F, et al. Bone metastasis: mechanisms, therapies, and biomarkers. Physiol Rev. 2021;101:797–855. doi: 10.1152/physrev.00012.2019. - DOI - PubMed

Publication types