. 2024 Jan 29;19(1):13.
doi: 10.1186/s13024-023-00690-9.

NMNAT2 supports vesicular glycolysis via NAD homeostasis to fuel fast axonal transport

Affiliations

NMNAT2 supports vesicular glycolysis via NAD homeostasis to fuel fast axonal transport

Sen Yang et al. Mol Neurodegener. .

Abstract

Background: Bioenergetic maladaptations and axonopathy are often found in the early stages of neurodegeneration. Nicotinamide adenine dinucleotide (NAD), an essential cofactor for energy metabolism, is mainly synthesized by Nicotinamide mononucleotide adenylyl transferase 2 (NMNAT2) in CNS neurons. NMNAT2 mRNA levels are reduced in the brains of Alzheimer's, Parkinson's, and Huntington's disease. Here we addressed whether NMNAT2 is required for axonal health of cortical glutamatergic neurons, whose long-projecting axons are often vulnerable in neurodegenerative conditions. We also tested if NMNAT2 maintains axonal health by ensuring axonal ATP levels for axonal transport, critical for axonal function.

Methods: We generated mouse and cultured neuron models to determine the impact of NMNAT2 loss from cortical glutamatergic neurons on axonal transport, energetic metabolism, and morphological integrity. In addition, we determined if exogenous NAD supplementation or inhibiting a NAD hydrolase, sterile alpha and TIR motif-containing protein 1 (SARM1), prevented axonal deficits caused by NMNAT2 loss. This study used a combination of techniques, including genetics, molecular biology, immunohistochemistry, biochemistry, fluorescent time-lapse imaging, live imaging with optical sensors, and anti-sense oligos.

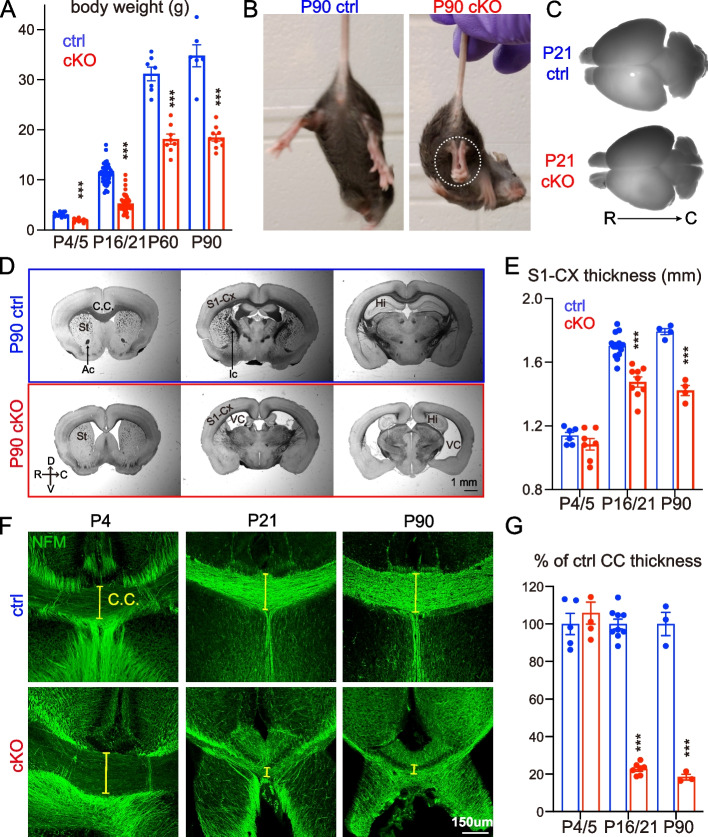
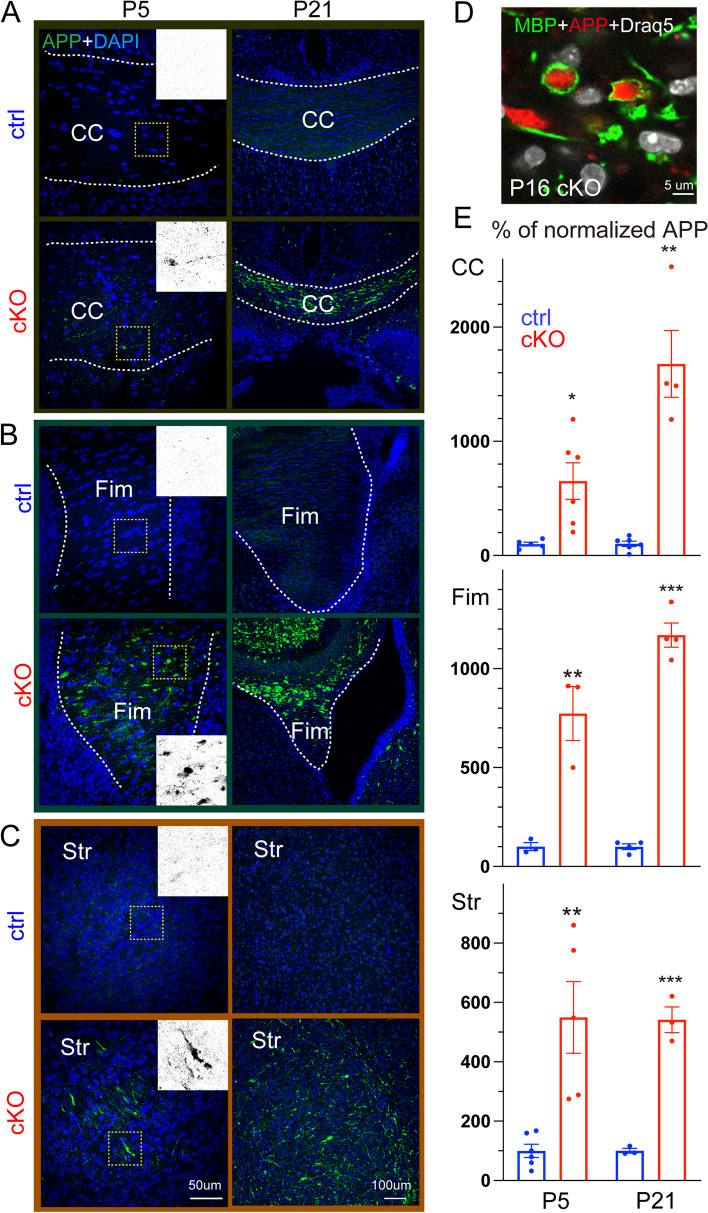
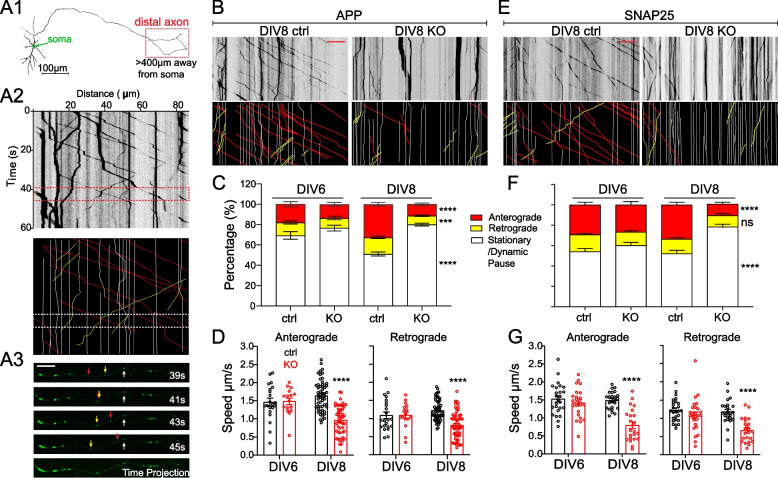
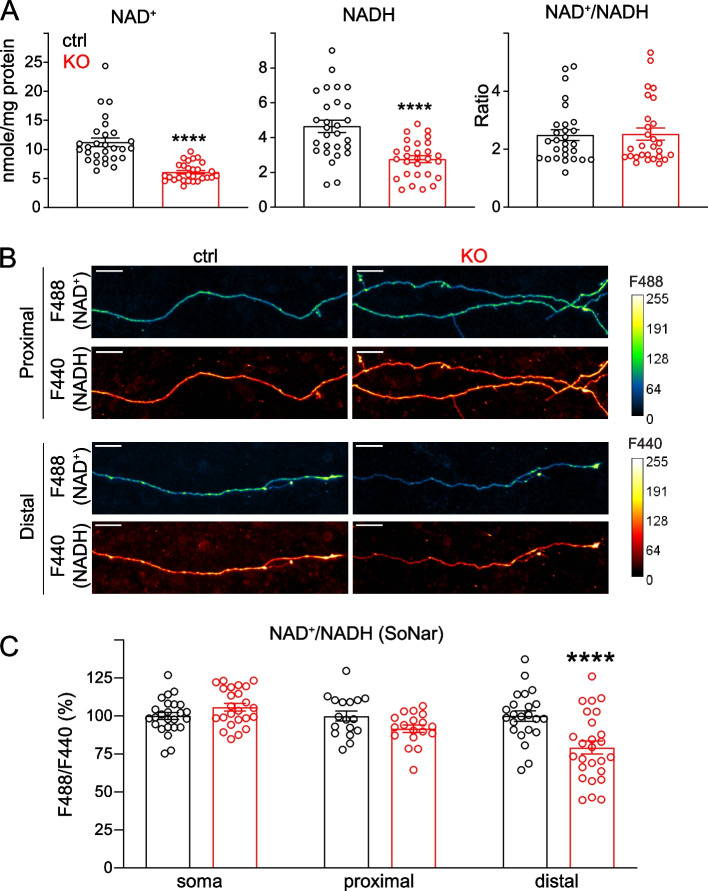
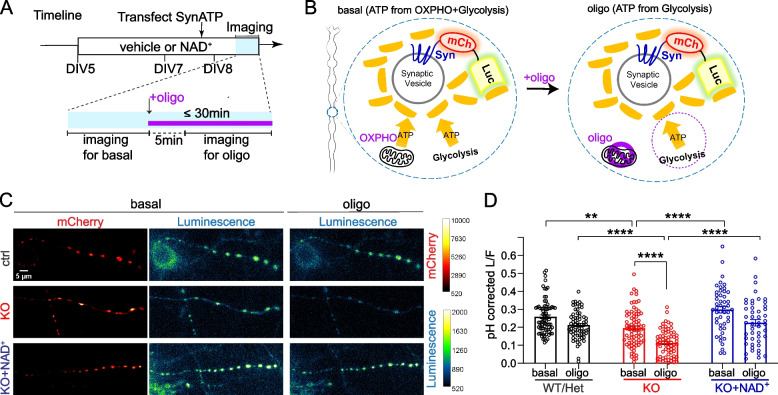
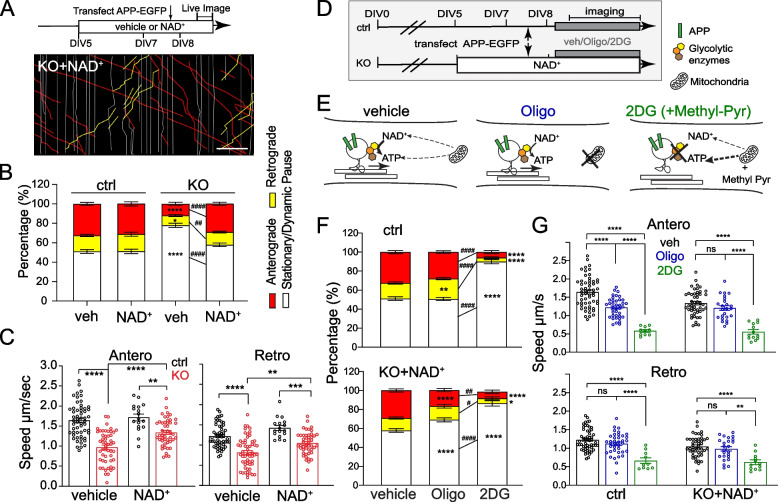
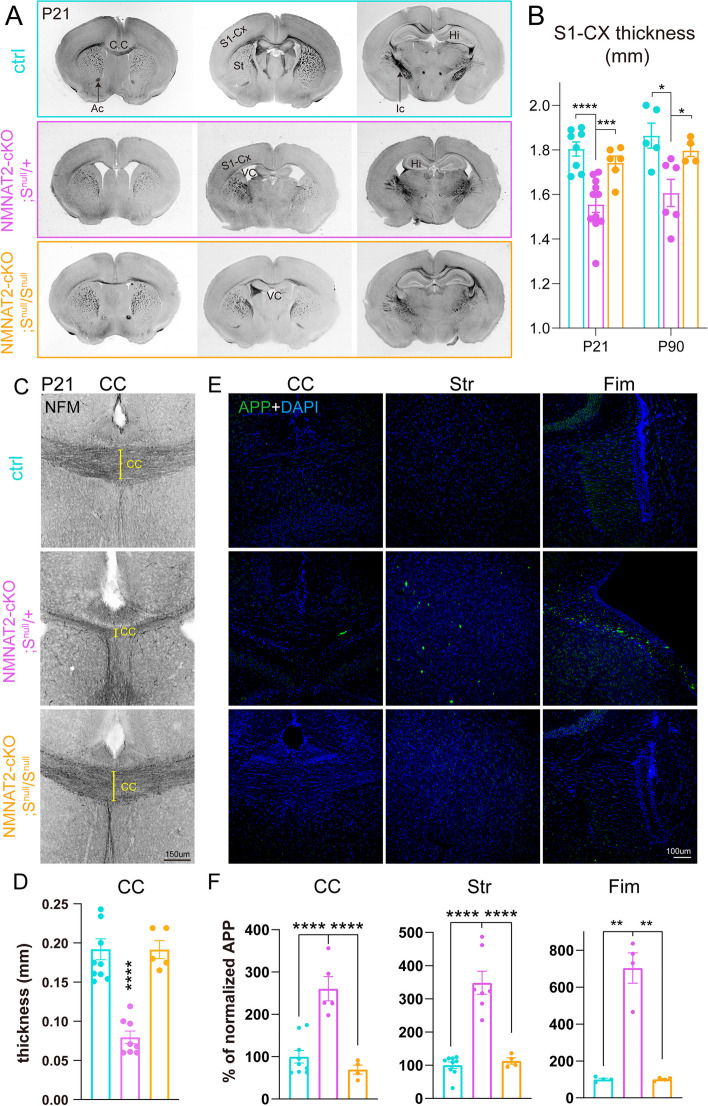
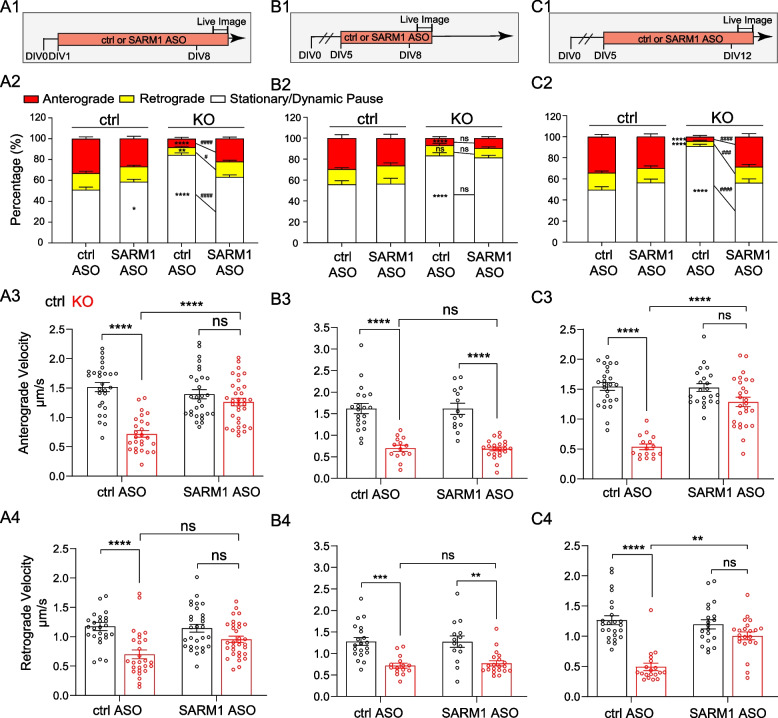
Results: We provide in vivo evidence that NMNAT2 in glutamatergic neurons is required for axonal survival. Using in vivo and in vitro studies, we demonstrate that NMNAT2 maintains the NAD-redox potential to provide "on-board" ATP via glycolysis to vesicular cargos in distal axons. Exogenous NAD+ supplementation to NMNAT2 KO neurons restores glycolysis and resumes fast axonal transport. Finally, we demonstrate both in vitro and in vivo that reducing the activity of SARM1, an NAD degradation enzyme, can reduce axonal transport deficits and suppress axon degeneration in NMNAT2 KO neurons.

Conclusion: NMNAT2 ensures axonal health by maintaining NAD redox potential in distal axons to ensure efficient vesicular glycolysis required for fast axonal transport.


Conflict of interest statement

All authors declare they have no competing interests.

Figures

Fig. 1
Fig. 1
Deleting NMNAT2 in cortical glutamatergic neurons results in age-dependent axonal degeneration. A Body weight of cKO and their littermate control (ctrl) mice at P4/5, P16/21, P60, and P90. Mice numbers: P4/5, 13 ctrl and 9 cKO; P16/P21 43 ctrl and 46 cKO; P60, 7 ctrl and 8 cKO; P90, 6 ctrl and 10 cKO. B Movie screenshots showing that a P90 cKO mouse exhibits hindlimb clasping behaviors (dashed white oval), a classic motor deficit observed in many neurodegenerative models (see Sup. Movies), but not in a ctrl mouse. C, D Bright field images showing whole brains and coronal plane brain sections (rostral to caudal from left to right) from ctrl and cKO mice. In addition to the smaller brain sizes, cKO brains have enlarged ventricles and reduced cortical regions and hippocampal areas. E Quantification of the primary somatosensory (S1) cortex thickness in ctrl and cKO mice at different ages. Mice numbers: P4/5, 6 ctrl and 7 cKO; P16/P21, 14 ctrl and 9 cKO; P90, 4 ctrl and 4 cKO. F Confocal images of immunohistochemical staining of NFM (medium-size neurofilament) showing axonal tracts through the corpus callosum (CC) in ctrl and cKO brains at P4, P21, and P90. Yellow brackets mark the thickness of the CC. G Quantification of the CC thickness, normalized to its value in ctrl mice. Mice numbers: P4/5, 5 ctrl and 5 cKO; P16/P21, 9 ctrl and 7 cKO; P90, 3 ctrl and 3 cKO. Abbreviations: Ac, anterior commissure; Ic, internal capsule; CC, corpus callosum; Cx, cortex; Hi, hippocampus; St, striatum; VC, ventricle. Unpaired t-test and Mann–Whitney test were applied for the statistic result, ***p < 0.001, ****p < 0.0001
Fig. 2
Fig. 2
Deleting NMNAT2 in cortical glutamatergic neurons results in Amyloid Precursor Protein (APP) accumulation (A, B, C) Representative confocal microscopy images showing APP accumulation in multiple brain regions of ctrl and cKO mice at P5 and P21. Scale bars, 50 um for all left panels, 100 um for all right panels. Dashed white lines mark the margins of corpus callosum (A) and fimbria (B). D High magnification image showing that the accumulated APP is encircled by myelin sheath labeled by myelin basic protein (MBP) staining in P16 cKO corpus callosum (observed in 3 out of 3 cKO brains). E Quantification of the APP signal in the corpus callosum, hippocampal fimbria, and striatum area of cKO mice normalized to the average signal in ctrl mice at P5 and P21. Number of mice: P5, 3–6 ctrl, and 3–6 cKO; P16/P21 3–6 ctrl and 3–4 cKO. Unpaired t-test and Mann–Whitney test were applied for the statistic result, *p < 0.05, **p < 0.01, ***p < 0.001
Fig. 3
Fig. 3
Nmnat2 is required for transporting vesicular cargos in the distal axon (A1) Diagram indicating the distal axon region (> 400 µm from the soma) where axonal transport was examined with time-lapse imaging. (A2) Example kymograph (upper) and annotations (lower) with anterograde (red lines), retrograde (yellow lines), and stationary/dynamic pause (white lines) movements indicated. (A3) Four image examples showing APP-EGFP movement along an axon segment during the times indicated in the dashed box in A2. Scale bar, 10 µm. B, E Representative kymographs for APP-EGFP and SNAP25-EGFP from DIV8 ctrl and KO distal axons. Scale bar, 20 µm. C, F Percentages of APP- or SNAP25-EGFP vesicles moving antero/retrogradely or staying stationary/dynamic pause in ctrl and KO neurons. Numbers (neurons imaged) and statistics: C DIV6, 22 ctrl, and 19 KO; DIV8, 56 ctrl, and 62 KO; compared with two-way ANOVA and Šídák's multiple comparisons for anterograde and stationary/dynamic pause categories, compared with multiple Mann–Whitney test and Holm-Šídák multiple comparisons for the retrograde category. F DIV6, 27 ctrl, 26 KO; DIV8, 24 ctrl, 27 KO; two-way ANOVA with Tukey's multiple comparisons. D, G Velocity of antero- and retrograde transport in ctrl and KO neurons from 2–3 independent experiments. Numbers (neurons imaged) and statistics: D Anterograde velocity analysis: DIV6, 21 ctrl and 16 KO; DIV8, 56 ctrl and 51 KO. Retrograde velocity analysis: DIV6: 22 ctrl, 16 KO; DIV8, 56 ctrl, 58 KO. Two-way ANOVA with Šídák's multiple comparisons. G Anterograde velocity analysis: DIV6, 25 ctrl, 24 KO; DIV8, 24 ctrl, 22 KO; two-way ANOVA with Tukey's multiple comparisons. Retrograde velocity analysis: DIV6, 25 ctrl, 26 KO; DIV8, 24 ctrl, 23 KO; multiple Mann–Whitney test with Holm-Šídák multiple comparisons. KO was compared to ctrl of the same DIV in all data sets. Data represent mean ± SEM, ****p < 0.0001. APP and SNAP25 data were collected from 3 and 2 independent experiments, respectively
Fig. 4
Fig. 4
Loss of NMNAT2 reduces NAD+ levels and impairs the NAD redox potential in distal axons. A Levels of NAD+ and NADH and calculated NAD+/NADH ratios in DIV8 ctrl and KO cortical neurons as measured by the NAD+/NADH-Glo assay and normalized to protein amounts. Readings from 28 ctrl and 28 KO culture wells from 4 independent culture experiments; unpaired t-test was used for NADH while Mann–Whitney test was used for both NAD+ and NAD+/NADH ratios due to their distributions. B Representative images showing signals emitted from the SoNar (NAD+/NADH) ratiometric sensor for NAD.+ and NADH in the proximal and distal axons of DIV 8 ctrl or KO cortical neurons. Scale bar, 20 um. C NAD + /NADH ratios in soma, proximal and distal axons of DIV7 and 8 ctrl and KO cortical neurons revealed by F488/F440 ratiometric measurements of the SoNar sensor (Soma: 25 ctrl and 24 KO from 2 independent experiments; proximal axon segments: 19 ctrl and 20 KO from 3 independent experiments; distal axon segments: 26 ctrl and 30 KO from 3 independent experiments; two-way ANOVA with Tukey's multiple comparisons test). All above data represents mean ± SEM, ****p < 0.0001
Fig. 5
Fig. 5
NMNAT2 loss impairs glycolysis in distal axon presynaptic varicosities. A Experimental and live imaging timeline. B Schematic diagram of the Syn-ATP sensor configuration and the treatment. Syn: synaptophysin, mCh: mCherry, Luc: luciferase. C Representative Syn-ATP luminescence and fluorescence images of distal axon varicosities under basal and oligomycin-treatment conditions from DIV8 ctrl, KO, and KO neurons supplemented with NAD+ (KO + NAD+). Scale bar, 5 μm. D pH-corrected L/F (Luminescence/Fluorescence) ratio representing relative presynaptic ATP levels measured by the Syn-ATP sensor in mCherry positive varicosities of distal axons of DIV8 ctrl, KO, and KO + NAD+ neurons. Numbers (neurons imaged) and statistics: 78 ctrl, 77 KO, and 48 KO + NAD+ under basal conditions; 67 ctrl, 68 KO, and 48 KO + NAD+ under oligomycin-treated conditions. Ctrl and KO were from 5 independent experiments, and KO + NAD+ was from 2 independent experiments. Kruskal–Wallis test with Dunn's multiple comparisons test was used. All above data represents mean ± SEM, ** p = 0.004, ****p < 0.0001. In the NAD+ treated KO group, the difference between basal and oligomycin treatment conditions is marginal to significance, p = 0.0537
Fig. 6
Fig. 6
NAD+ supplementation depends on glycolysis to rescue APP transport in NMNAT2 KO neurons. A Representative kymographs from DIV8 ctrl or KO neurons supplemented with Veh (vehicle) or 1 mM NAD+ since DIV5. Scale bar, 20 µm. B Percentages of APP-EGFP vesicles moving anterogradely, retrogradely, or pausing in distal axons of DIV8 ctrl and KO neurons supplemented with Veh or NAD+. Neurons imaged and statistics: 56 ctrl + Veh, 62 KO + Veh, 17 ctrl + NAD+, and 49 KO + NAD+, *p = 0.0232, ##p = 0.0018. Significant comparison to ctrl + Veh and KO + Veh groups was labeled with* and #, respectively. C Velocity of antero- and retrograde transport of APP-EGFP in distal axons of DIV8 ctrl and KO neurons supplemented with Veh or NAD+. Numbers (neurons imaged) and statistics: 56 ctrl + Veh, 51–58 KO + Veh, 17 ctrl + NAD+, and 47–48 KO + NAD+ for anterograde velocity, (anterograde) **p = 0.0041, (retrograde) **p = 0.0013, ***p = 0.0002. E Schematic representation of how glycolysis and mitochondrial respiration are affected by Oligo or 2DG(+ Methyl-Pyr) treatment. F Percentages of APP-EGFP vesicles moving anterogradely, retrogradely, or pausing in distal axons of DIV8 ctrl and KO + NAD+ neurons in the presence of vehicle, Oligo, or 2DG. Numbers (neurons imaged) and statistics: 56 ctrl + Veh, 39 ctrl + oligo, and 20 ctrl + 2DG, **p = 0.0059; 49 KO + NAD+ + Veh, 22–25 KO + NAD+ + Oligo,and 15–18 KO + NAD+ + 2DG, *p = 0.0291, #p = 0.0252. Significant comparisons to Veh-treated and Oligo-treated groups were labeled with * and #, respectively. G Velocity of antero- and retrograde transport of APP-EGFP in distal axons of DIV8 ctrl and KO + NAD+ neurons in the presence of vehicle (black), Oligo (blue), or 2DG (green). Neurons imaged and statistics: 56 ctrl + Veh, 38–39 ctrl + oligo, 10 ctrl + 2DG, 47–48 KO + NAD+, 24 KO + NAD+ + Oligo, and 12–13 KO + NAD+ + 2DG, **p = 0.0011. All above data represent mean ± SEM, two-way ANOVA with Tukey's multiple comparisons test or Kruskal–Wallis test with Dunn's multiple comparisons test were used, see details in supplemented excel, ****p < 0.0001, ####p < 0.0001
Fig. 7
Fig. 7
Deleting SARM1 prevents neurodegenerative phenotypes in NMNAT2 cKO brains. A Bright field images of coronal brain sections (rostral to caudal from left to right) from ctrl, NMNAT2 cKO; Snull/ + , and NMNAT2 cKO; Snull/Snull mice. Enlarged ventricle, greatly reduced corpus callosum, and internal capsule were evident in NMNAT2 cKO; Snull/ + but not in NMNAT2 cKO; Snull/Snull brains. Abbreviations: Ac, anterior commissure; Ic, internal capsule; CC, corpus callosum; S1-Cx, primary somatosensory cortex; Hi, hippocampus; St, striatum; VC, ventricle. B Thickness of the primary somatosensory cortex in P16/21 and P90 mice. Number of mice: P16/21, 8 ctrl, 11 NMNAT2 cKO; Snull/ + , 6 NMNAT2 cKO; Snull/Snull; P90, 5 ctrl, 6 NMNAT2 cKO; Snull/ + , 4 NMNAT2 cKO; Snull/Snull. ***, p = 0.0018, q = 0.0009. (Ctrl vs. NMNAT2 cKO; Snull/ +) *, p = 0.0049, q = 0.0103. (NMNAT2 cKO; Snull/ + vs. NMNAT2 cKO; Snull/Snull) *, p = 0.0341, q = 0.0358. C Representative NF-M (black) immunostaining images showing corpus callosum around the midline area in ctrl, NMNAT2 cKO; Snull/ + , and NMNAT2 cKO; Snull/Snull rostral brain section at P21. D CC thickness quantification. Number of mice: P21, 10 ctrl, 8 NMNAT2 cKO; Snull/ + , 5 NMNAT2 cKO; Snull/Snull. E Immunohistology images showing APP accumulation in the corpus callosum, fimbria, and striatum of P21 NMNAT2 cKO; Snull/ + , but not in ctrl and NMNAT2 cKO; Snull/Snull brains. F Quantification of the APP signal in the brain regions shown in (E) normalized to the value in ctrl mice. Number of mice: 7–9 ctrl, 4–5 NMNAT2 cKO; Snull/ + , 4 NMNAT2 cKO; Snull/Snull. CC, corpus callosum; Str, striatum; Fim, Fimbria. (Fim Ctrl vs. NMNAT2 cKO; Snull/ +) **, p = 0.0186, q = 0.0098; (NMNAT2 cKO; Snull/ + vs. NMNAT2 cKO; Snull/Snull) **, p = 0.0186, q = 0.0098. All above data represent mean ± SEM. One-way ANOVA with a two-stage linear step-up procedure of Benjamini, Krieger, and Yekutieli was used, ****p < 0.0001
Fig. 8
Fig. 8
SARM1 knockdown restores APP axonal transport in NMNAT2 KO neurons (A1, B1, C1) Experimental timeline. (A2, B2, C2) Percentages of APP vesicles moving anterogradely, retrogradely, or staying stationary in distal axons of ctrl and KO neurons following the treatments indicated in A1, B1, and C1, respectively. Numbers of neurons imaged and statistics: (A2) 27 ctrl + ctrl ASO, 31 KO + ctrl ASO, 29 ctrl + SARM1 ASO, and 33 KO + SARM1 ASO, *p = 0.0286, #p = 0.018, **p = 0.0069. (B2) 20 ctrl + ctrl ASO, 22 KO + ctrl ASO, 14 ctrl + SARM1 ASO, and 26 KO + SARM1 ASO. (C2) 25 ctrl + ctrl ASO, 31 KO + ctrl ASO, 22 ctrl + SARM1 ASO, and 26 KO + SARM1 ASO, ###p = 0.0006. Significant comparison to KO + ctrl ASO group was labeled with #. (A3-4, B3-4, C3-4) Velocity of antero- and retrograde transport in distal axons of ctrl and KO neurons following the treatments indicated in (A1, B1, C1), respectively. (A3-4) 26-27 ctrl + ctrl ASO, 26-27 KO + ctrl ASO, 29 ctrl + SARM1 ASO, and 32-33 KO + SARM1 ASO. (B3-4) 20 ctrl + ctrl ASO, 14-16 KO + ctrl ASO, 14 ctrl + SARM1 ASO, and 20-22 KO + SARM1 ASO, (ctrl + SARM1 ASO vs KO + SARM1 ASO) **p = 0.0049, (ctrl + ctrl ASO vs KO + ctrl ASO) **p = 0.0022. (C3-4) 24-25 ctrl + ctrl ASO, 16-19 KO + ctrl ASO, 20-22 ctrl + SARM1 ASO, and 22-26 KO + SARM1 ASO, **p = 0.001. One-way or two-way ANOVA with Tukey's multiple comparisons test and Kruskal-Wallis test with Dunn's multiple comparisons test were used; see details in supplemented Excel. All above data represent mean ± SEM, ****p < 0.0001, ####p < 0.0001. Numbers of independent culture experiments are listed in Sup. Table

Update of

Similar articles

Cited by

References

    1. Harris JJ, Attwell D. The energetics of CNS white matter. J Neurosci. 2012;32:356–371. doi: 10.1523/JNEUROSCI.3430-11.2012. - DOI - PMC - PubMed
    1. Yellen G. Fueling thought: Management of glycolysis and oxidative phosphorylation in neuronal metabolism. J Cell Biol. 2018;217:2235–2246. doi: 10.1083/jcb.201803152. - DOI - PMC - PubMed
    1. Shokhirev MN, Johnson AA. An integrative machine-learning meta-analysis of high-throughput omics data identifies age-specific hallmarks of Alzheimer's disease. Ageing Res Rev. 2022;81:101721. doi: 10.1016/j.arr.2022.101721. - DOI - PubMed
    1. Roy M, Rheault F, Croteau E, Castellano CA, Fortier M, St-Pierre V, Houde JC, Turcotte EE, Bocti C, Fulop T, et al. Fascicle- and Glucose-Specific Deterioration in White Matter Energy Supply in Alzheimer's Disease. J Alzheimers Dis. 2020;76:863–881. doi: 10.3233/JAD-200213. - DOI - PubMed
    1. Wang M, Liu K, Pan J, Li J, Sun P, Zhang Y, Li L, Guo W, Xin Q, Zhao Z, et al. Brain-wide projection reconstruction of single functionally defined neurons. Nat Commun. 2022;13:1531. doi: 10.1038/s41467-022-29229-0. - DOI - PMC - PubMed