Effect of tetrahedral framework nucleic acids on the reconstruction of tendon-to-bone injuries after rotator cuff tears
- PMID: 38282322
- PMCID: PMC11150141
- DOI: 10.1111/cpr.13605
Effect of tetrahedral framework nucleic acids on the reconstruction of tendon-to-bone injuries after rotator cuff tears
Abstract
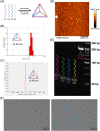
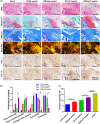
Clinicians and researchers have always faced challenges in performing surgery for rotator cuff tears (RCT) due to the intricate nature of the tendon-bone gradient and the limited long-term effectiveness. At the same time, the occurrence of an inflammatory microenvironment further aggravates tissue damage, which has a negative impact on the regeneration process of mesenchymal stem cells (MSCs) and eventually leads to the production of scar tissue. Tetrahedral framework nucleic acids (tFNAs), novel nanomaterials, have shown great potential in biomedicine due to their strong biocompatibility, excellent cellular internalisation ability, and unparalleled programmability. The objective of this research was to examine if tFNAs have a positive effect on regeneration after RCTs. Experiments conducted in a controlled environment demonstrated that tFNAs hindered the assembly of inflammasomes in macrophages, resulting in a decrease in the release of inflammatory factors. Next, tFNAs were shown to exert a protective effect on the osteogenic and chondrogenic differentiation of bone marrow MSCs under inflammatory conditions. The in vitro results also demonstrated the regulatory effect of tFNAs on tendon-related protein expression levels in tenocytes after inflammatory stimulation. Finally, intra-articular injection of tFNAs into a rat RCT model showed that tFNAs improved tendon-to-bone healing, suggesting that tFNAs may be promising tendon-to-bone protective agents for the treatment of RCTs.
© 2024 The Authors. Cell Proliferation published by Beijing Institute for Stem Cell and Regenerative Medicine and John Wiley & Sons Ltd.
Conflict of interest statement
The authors assert that they possess no conflicting concerns.
Figures


Similar articles
-
3D-Printed PCL Scaffolds Loaded with bFGF and BMSCs Enhance Tendon-Bone Healing in Rat Rotator Cuff Tears by Immunomodulation and Osteogenesis Promotion.ACS Biomater Sci Eng. 2025 Feb 10;11(2):1123-1139. doi: 10.1021/acsbiomaterials.4c02340. Epub 2025 Jan 24. ACS Biomater Sci Eng. 2025. PMID: 39851055
-
The recombinant human fibroblast growth factor-18 (sprifermin) improves tendon-to-bone healing by promoting chondrogenesis in a rat rotator cuff repair model.J Shoulder Elbow Surg. 2022 Aug;31(8):1617-1627. doi: 10.1016/j.jse.2022.01.137. Epub 2022 Feb 20. J Shoulder Elbow Surg. 2022. PMID: 35196571
-
Synergistic enhancement of tendon-to-bone healing via anti-inflammatory and pro-differentiation effects caused by sustained release of Mg2+/curcumin from injectable self-healing hydrogels.Theranostics. 2021 Apr 3;11(12):5911-5925. doi: 10.7150/thno.56266. eCollection 2021. Theranostics. 2021. PMID: 33897889 Free PMC article.
-
Regenerative properties of bone marrow mesenchymal stem cell derived exosomes in rotator cuff tears.J Transl Med. 2025 Jan 12;23(1):47. doi: 10.1186/s12967-024-06029-2. J Transl Med. 2025. PMID: 39800717 Free PMC article. Review.
-
Tetrahedral framework nucleic acids for improving wound healing.J Nanobiotechnology. 2024 Mar 16;22(1):113. doi: 10.1186/s12951-024-02365-z. J Nanobiotechnology. 2024. PMID: 38491372 Free PMC article. Review.
Cited by
-
Exosomes derived from tendon stem/progenitor cells enhance tendon-bone interface healing after rotator cuff repair in a rat model.Bioact Mater. 2024 Jun 28;40:484-502. doi: 10.1016/j.bioactmat.2024.06.014. eCollection 2024 Oct. Bioact Mater. 2024. PMID: 39040569 Free PMC article.
-
Tetrahedral Framework Nucleic Acid-Based Delivery of DJ-1-saRNA Prevent Retinal Ischaemia-Reperfusion Injury via Inhibiting Ferroptosis.Cell Prolif. 2025 Jul;58(7):e13820. doi: 10.1111/cpr.13820. Epub 2025 Feb 20. Cell Prolif. 2025. PMID: 39980149 Free PMC article.
-
Tetrahedral Framework Nucleic Acid Relieves Sepsis-Induced Intestinal Injury by Regulating M2 Macrophages.Cell Prolif. 2025 May;58(5):e13803. doi: 10.1111/cpr.13803. Epub 2025 Jan 22. Cell Prolif. 2025. PMID: 39844345 Free PMC article.
-
Current Understanding and Translational Prospects of Tetrahedral Framework Nucleic Acids.JACS Au. 2025 Feb 10;5(2):486-520. doi: 10.1021/jacsau.4c01170. eCollection 2025 Feb 24. JACS Au. 2025. PMID: 40017737 Free PMC article. Review.
References
-
- Osborne JD, Gowda AL, Wiater B, Wiater JM. Rotator cuff rehabilitation: current theories and practice. Phys Sportsmed. 2016;44(1):85‐92. - PubMed
-
- Gebremariam L, Hay EM, van der Sande R, Rinkel WD, Koes BW, Huisstede BM. Subacromial impingement syndrome—effectiveness of physiotherapy and manual therapy. Br J Sports Med. 2014;48(16):1202‐1208. - PubMed
-
- Liu H, Yang L, Zhang E, et al. Biomimetic tendon extracellular matrix composite gradient scaffold enhances ligament‐to‐bone junction reconstruction. Acta Biomater. 2017;56:129‐140. - PubMed
-
- Calejo I, Costa‐Almeida R, Reis R, Gomes M. Enthesis tissue engineering: biological requirements meet at the Interface. Tissue Eng Part B, Rev. 2019;25(4):330‐356. - PubMed
MeSH terms
Substances
LinkOut - more resources
Full Text Sources
Medical

