. 2024 Jan;14(1):e1548.
doi: 10.1002/ctm2.1548.

Molecular features of luminal breast cancer defined through spatial and single-cell transcriptomics

Affiliations

Molecular features of luminal breast cancer defined through spatial and single-cell transcriptomics

Ryohei Yoshitake et al. Clin Transl Med. 2024 Jan.

Abstract

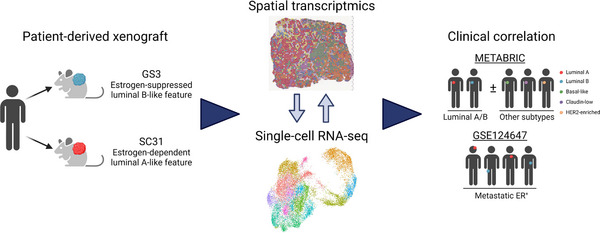
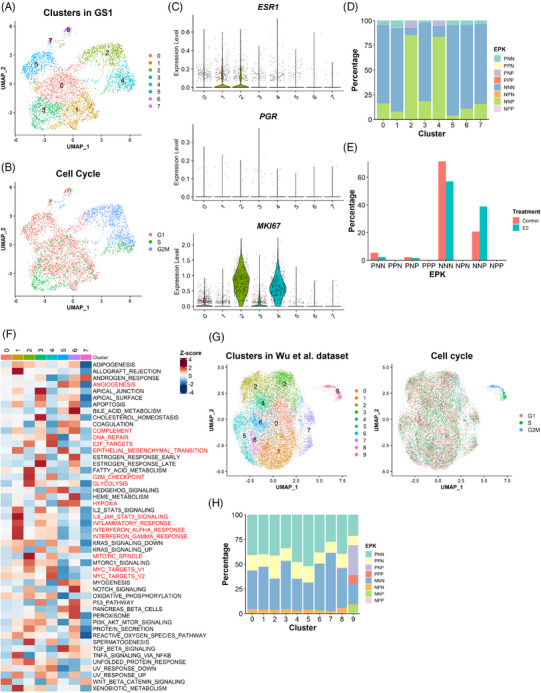
Background: Intratumour heterogeneity is a hallmark of most solid tumours, including breast cancers. We applied spatial transcriptomics and single-cell RNA-sequencing on patient-derived xenografts (PDXs) to profile spatially resolved cell populations within oestrogen receptor-positive (ER+ ) breast cancer and to elucidate their importance in oestrogen-dependent tumour growth.

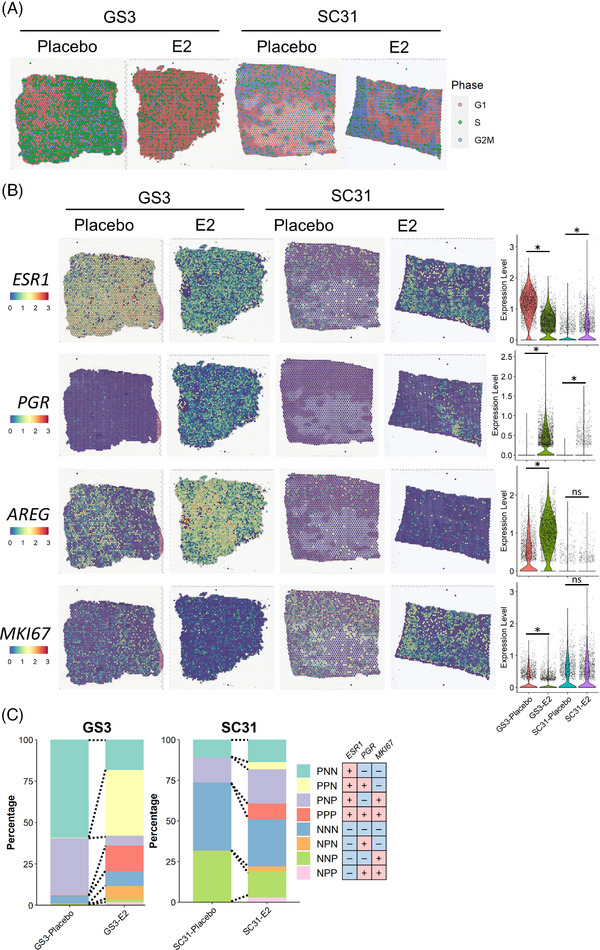
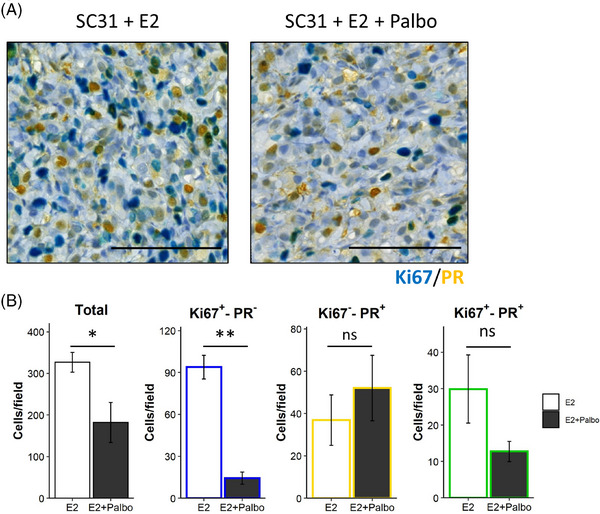
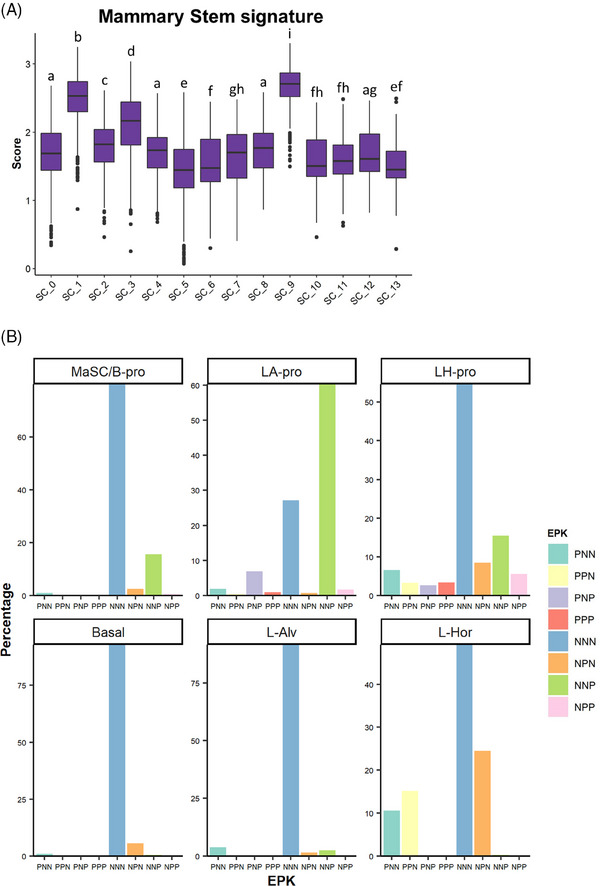
Methods: Two PDXs of 'ER-high' breast cancers with opposite oestrogen-mediated growth responses were investigated: oestrogen-suppressed GS3 (80-100% ER) and oestrogen-dependent SC31 (40-90% ER) models. The observation was validated via single-cell analyses on an 'ER-low' PDX, GS1 (5% ER). The results from our spatial and single-cell analyses were further supported by a public ER+ breast cancer single-cell dataset and protein-based dual immunohistochemistry (IHC) of SC31 examining important luminal cancer markers (i.e., ER, progesterone receptor and Ki67). The translational implication of our findings was assessed by clinical outcome analyses on publicly available cohorts.

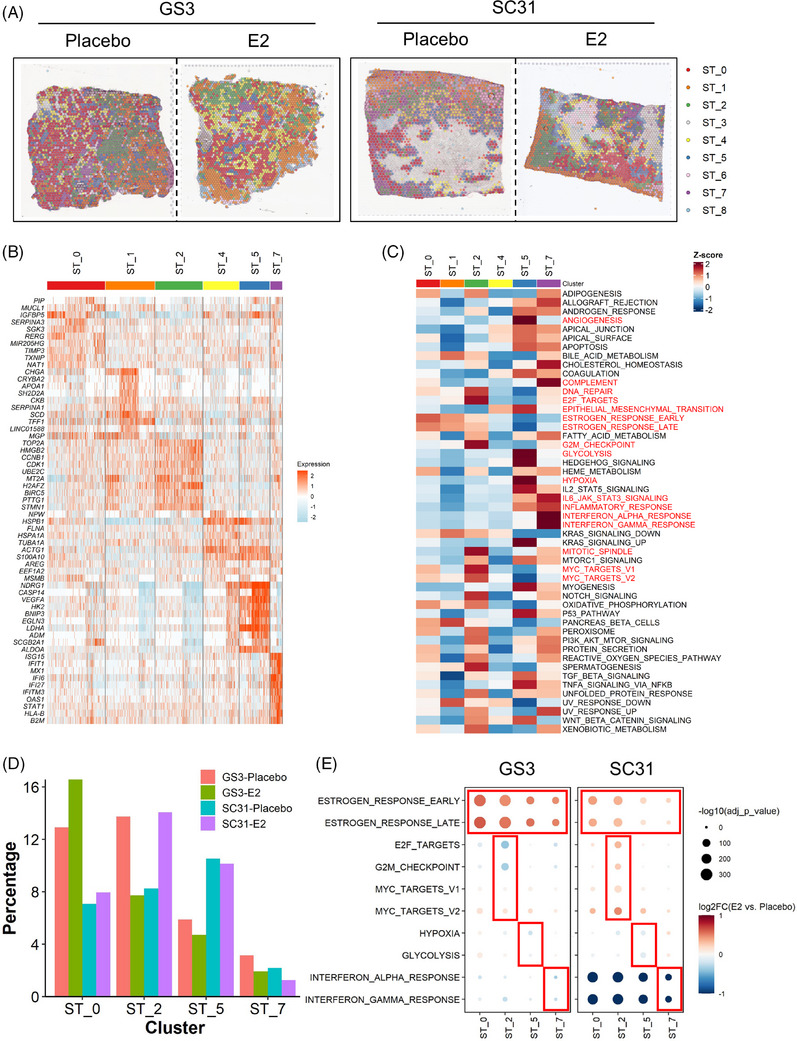
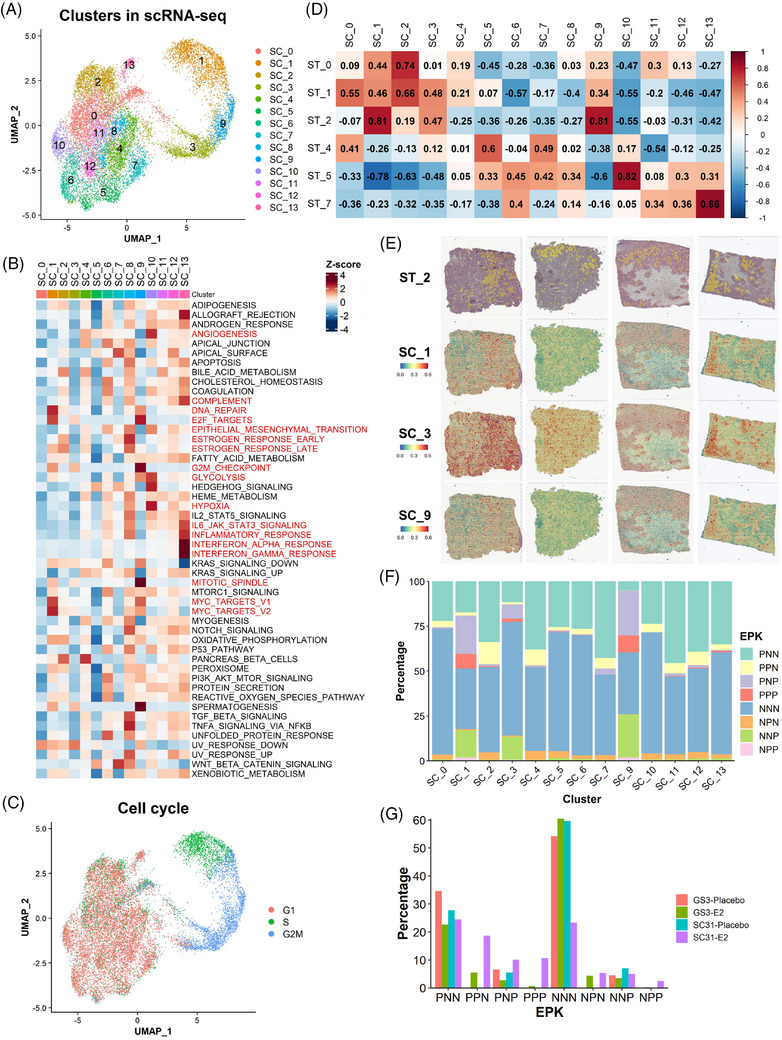
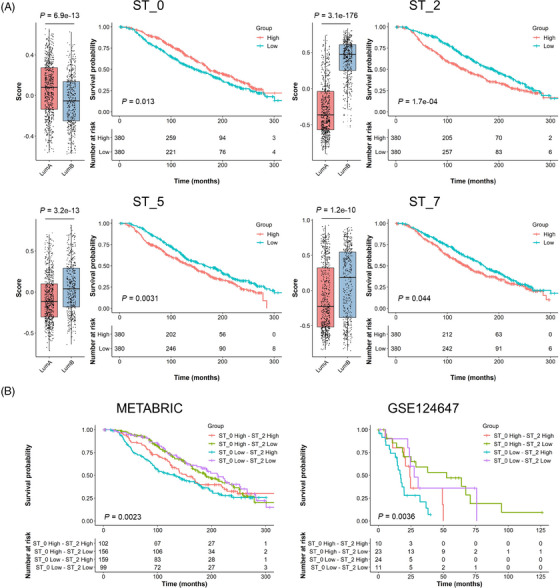
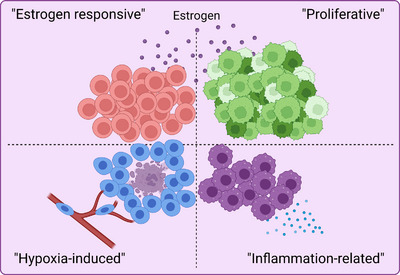
Results: Our space-gene-function study revealed four spatially distinct compartments within ER+ breast cancers. These compartments showed functional diversity (oestrogen-responsive, proliferative, hypoxia-induced and inflammation-related). The 'proliferative' population, rather than the 'oestrogen-responsive' compartment, was crucial for oestrogen-dependent tumour growth, leading to the acquisition of luminal B-like features. The cells expressing typical oestrogen-responsive genes like PGR were not directly linked to oestrogen-dependent proliferation. Dual IHC analyses demonstrated the distinct contribution of the Ki67+ proliferative cells toward oestrogen-mediated growth and their response to a CDK4/6 inhibitor. The gene signatures derived from the proliferative, hypoxia-induced and inflammation-related compartments were significantly correlated with worse clinical outcomes, while patients with the oestrogen-responsive signature showed better prognoses, suggesting that this compartment would not be directly associated with oestrogen-dependent tumour progression.

Conclusions: Our study identified the gene signature in our 'proliferative' compartment as an important determinant of luminal cancer subtypes. This 'proliferative' cell population is a causative feature of luminal B breast cancer, contributing toward its aggressive behaviours.

Keywords: breast cancer; intratumour heterogeneity; oestrogen receptor; single-cell RNA-sequencing; spatial transcriptomics.


Conflict of interest statement

The authors declare that there is no conflict of interest.

Figures

FIGURE 1
FIGURE 1
The schematic diagram of the research design in this study.
FIGURE 2
FIGURE 2
Spatial transcriptomics on two ER+ breast cancer PDX models. (A) Cell cycle analysis on the ST datasets from GS3 and SC31 with and without E2 treatment. The colour of each spot represents the cell cycle phase. (B) Expression of ESR1, PGR, AREG and MKI67 genes in the ST datasets. The spatial plot on the left shows the location and level of the expression on each tissue. The violin plot on the right summarises the gene expressions in each section. *, p < .05; ns, not significant. (C) EPK classification on the ST datasets.
FIGURE 3
FIGURE 3
Identification of functional compartments in the ST dataset and the effect of E2 treatment. (A) Distribution of the ST clusters on tumour sections. Each spot is coloured according to the cluster (ST_0−8) identified by the unbiased clustering. (B) Heatmap of the top 10 genes for the ST clusters. Column represents the spots and row represents the genes. The gene expression levels were scaled by the SCTransform function. (C) Heatmap of the hallmark gene signature scores for the ST clusters. Column represents the ST clusters and row represents the gene sets. (D) Proportion of the four major ST clusters in each sample. The percentage of the ST cluster was calculated by (the number of spots in a ST cluster in a sample)/(the total number of spots in a sample). (E) Gene signature changes by E2 treatment. Size and colour of the dot represent p value and log2 fold change value between E2 and placebo groups in each ST cluster, respectively.
FIGURE 4
FIGURE 4
Single‐cell analysis defined cell subsets responsible for oestrogen‐dependent tumour growth at a higher resolution. (A) UMAP plot of the integrated scRNA‐seq dataset coloured according to the clusters identified by the unbiased clustering. (B) Heatmap of the hallmark gene signature scores for the SC clusters. Column represents the SC clusters and row represents the gene sets. (C) Cell cycle analysis on the integrated scRNA‐seq dataset. (D) Correlation analysis of the gene signature scores between the clusters in the ST and scRNA‐seq datasets. The value and colour of each box indicates Pearson's correlation coefficient. (E) Spatial mapping of the proliferative SC clusters on the ST sections. The spatial plot on the top represents the localisation of ST_2 spots in each tissue. (F) EPK classification on the scRNA‐seq dataset. (G) Proportion of the cells with EPK classification in each scRNA‐seq sample. The percentage of cells was calculated by (the number of cells in an EPK classification in a sample)/(the total number of cells in a sample).
FIGURE 5
FIGURE 5
Validation of the results from SC31 and GS3 through single‐cell analysis on two additional datasets. (A) UMAP plot of the GS1 dataset coloured according to the clusters identified by the unbiased clustering and (B) the cell cycle phases. (C) Expression of ESR1, PGR and MKI67 expression in each cluster identified in the GS1 dataset. (D) EPK classification on the GS1 dataset. (E) Proportion of cells with EPK classification in each sample. The percentage of cells was calculated by (the number of the cells in an EPK classification in a sample)/(the total number of the cells in a sample). (F) Heatmap of the hallmark gene signature scores for the clusters in GS1. Column represents the clusters and row represents the gene sets. (G) UMAP plot of human ER+ breast cancer dataset coloured according to the clusters identified by the unbiased clustering and the cell cycle phases. (H) EPK classification on the human ER+ breast cancer dataset.
FIGURE 6
FIGURE 6
Dual IHC analysis on SC31 following E2 and/or palbociclib treatment. (A) Representative images of the dual IHC of Ki67 (blue) and PR (yellow) in SC31 treated with E2 or E2 + palbociclib (Palbo). The Ki67+PR+ cells were stained in green. Scale bar = 100 μm. (B) Quantification of the total and Ki67+PR, Ki67PR+ and Ki67+PR+ cells per field. Data are shown as mean ± SEM [n = 5 (E2) and 4 (E2 + Palbo)]. *, p < .05; **, p < .01; ns, not significant.
FIGURE 7
FIGURE 7
Clinical data analysis on public cohorts with the ST signatures. Luminal subtype breast cancers in METABRIC cohort (A and B; luminal A, n = 679; luminal B, n = 461) and stage IV ER+/HER2 breast cancers in GSE124647 cohort (B; n = 140) were analysed using A ST_0, ST_2, ST_5 or ST_7 signatures and B the combination of ST_0 and ST_2 signatures. The gene signature scores were calculated in each patient using the GSVA R package. Left panels on A show the scores in luminal A and B patients with p values on the top. Kaplan–Meier plots show the overall survival of patients in each group with p values at the bottom left corner.
FIGURE 8
FIGURE 8
Progenitor‐like features of the MKI67+ proliferative cell subsets. (A) Mammary ‘Stem’ gene signature scoring on the GS3/SC31 scRNA‐seq dataset. The gene list for the mammary stem signature was derived from our previous literature and the score was calculated using the VISION R package. Different letters on the box plots indicate significant difference between the groups (p < .05). (B) EPK classification of normal mammary epithelium dataset. Each panel shows the results on each lineage of cells identified in our previous study.
FIGURE 9
FIGURE 9
Graphical abstract. We identified four spatially separated populations in ER+ breast cancers with distinct gene signatures, leading to overall cancer progression in a function‐specific manner.

References

    1. Perou CM, Sørile T, Eisen MB, et al. Molecular portraits of human breast tumours. Nature. 2000;406(6797):747‐752. - PubMed
    1. Sørlie T, Perou CM, Tibshirani R, et al. Gene expression patterns of breast carcinomas distinguish tumor subclasses with clinical implications. Proc Natl Acad Sci USA. 2001;98(19):10869‐10874. - PMC - PubMed
    1. The Cancer Genome Atlas Network . Comprehensive molecular portraits of human breast tumours. Nature. 2012;490(7418):61‐70. - PMC - PubMed
    1. Gnant M, Harbeck N, Thomssen C. St. Gallen 2011: summary of the consensus discussion. Breast Care. 2011;6(2):136‐141. - PMC - PubMed
    1. Ades F, Zardavas D, Bozovic‐Spasojevic I, et al. Luminal B breast cancer: molecular characterization, clinical management, and future perspectives. J Clin Oncol. 2014;32(25):2794‐2803. - PubMed

Publication types