Transposon sequencing reveals the essential gene set and genes enabling gut symbiosis in the insect symbiont Caballeronia insecticola
- PMID: 38282642
- PMCID: PMC10809759
- DOI: 10.1093/ismeco/ycad001
Transposon sequencing reveals the essential gene set and genes enabling gut symbiosis in the insect symbiont Caballeronia insecticola
Abstract
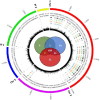
Caballeronia insecticola is a bacterium belonging to the Burkholderia genus sensu lato, which is able to colonize multiple environments like soils and the gut of the bean bug Riptortus pedestris. We constructed a saturated Himar1 mariner transposon library and revealed by transposon-sequencing that 498 protein-coding genes constitute the essential genome of Caballeronia insecticola for growth in free-living conditions. By comparing essential gene sets of Caballeronia insecticola and seven related Burkholderia s.l. strains, only 120 common genes were identified, indicating that a large part of the essential genome is strain-specific. In order to reproduce specific nutritional conditions that are present in the gut of Riptortus pedestris, we grew the mutant library in minimal media supplemented with candidate gut nutrients and identified several condition-dependent fitness-defect genes by transposon-sequencing. To validate the robustness of the approach, insertion mutants in six fitness genes were constructed and their growth deficiency in media supplemented with the corresponding nutrient was confirmed. The mutants were further tested for their efficiency in Riptortus pedestris gut colonization, confirming that gluconeogenic carbon sources, taurine and inositol, are nutrients consumed by the symbiont in the gut. Thus, our study provides insights about specific contributions provided by the insect host to the bacterial symbiont.
Keywords: Burkholderia sensu lato; Caballeronia insecticola; Riptortus pedestris; Tn-seq; essential gene; fitness gene; genome comparison; gut symbiosis.
© The Author(s) 2024. Published by Oxford University Press on behalf of the International Society for Microbial Ecology.
Conflict of interest statement
None declared.
Figures


Similar articles
-
Comparative cytology, physiology and transcriptomics of Burkholderia insecticola in symbiosis with the bean bug Riptortus pedestris and in culture.ISME J. 2019 Jun;13(6):1469-1483. doi: 10.1038/s41396-019-0361-8. Epub 2019 Feb 11. ISME J. 2019. PMID: 30742016 Free PMC article.
-
Symbiont coordinates stem cell proliferation, apoptosis, and morphogenesis of gut symbiotic organ in the stinkbug-Caballeronia symbiosis.Front Physiol. 2023 Jan 4;13:1071987. doi: 10.3389/fphys.2022.1071987. eCollection 2022. Front Physiol. 2023. PMID: 36685208 Free PMC article.
-
PhaR, a Negative Regulator of PhaP, Modulates the Colonization of a Burkholderia Gut Symbiont in the Midgut of the Host Insect, Riptortus pedestris.Appl Environ Microbiol. 2017 May 17;83(11):e00459-17. doi: 10.1128/AEM.00459-17. Print 2017 Jun 1. Appl Environ Microbiol. 2017. PMID: 28341680 Free PMC article.
-
Symbiotic factors in Burkholderia essential for establishing an association with the bean bug, Riptortus pedestris.Arch Insect Biochem Physiol. 2015 Jan;88(1):4-17. doi: 10.1002/arch.21218. Arch Insect Biochem Physiol. 2015. PMID: 25521625 Review.
-
Understanding regulation of the host-mediated gut symbiont population and the symbiont-mediated host immunity in the Riptortus-Burkholderia symbiosis system.Dev Comp Immunol. 2016 Nov;64:75-81. doi: 10.1016/j.dci.2016.01.005. Epub 2016 Jan 13. Dev Comp Immunol. 2016. PMID: 26774501 Review.
Cited by
-
The intestinal microbial community and function of Riptortus pedestris at different developmental stages and its effects on development.Front Microbiol. 2025 Jan 22;16:1517280. doi: 10.3389/fmicb.2025.1517280. eCollection 2025. Front Microbiol. 2025. PMID: 39935633 Free PMC article.
-
Large-Scale Sampling Reveals the Strain-Level Diversity of Burkholderia Symbionts in Riptortus pedestris and R. linearis (Hemiptera: Alydidae).Microorganisms. 2024 Sep 13;12(9):1885. doi: 10.3390/microorganisms12091885. Microorganisms. 2024. PMID: 39338558 Free PMC article.
-
Hundreds of antimicrobial peptides create a selective barrier for insect gut symbionts.Proc Natl Acad Sci U S A. 2024 Jun 18;121(25):e2401802121. doi: 10.1073/pnas.2401802121. Epub 2024 Jun 12. Proc Natl Acad Sci U S A. 2024. PMID: 38865264 Free PMC article.
References
LinkOut - more resources
Full Text Sources

