Huaju Xiaoji Formula Regulates ERS-lncMGC/miRNA to Enhance the Renal Function of Hypertensive Diabetic Mice with Nephropathy
- PMID: 38282657
- PMCID: PMC10821808
- DOI: 10.1155/2024/6942156
Huaju Xiaoji Formula Regulates ERS-lncMGC/miRNA to Enhance the Renal Function of Hypertensive Diabetic Mice with Nephropathy
Abstract
Background: Better therapeutic drugs are required for treating hypertensive diabetic nephropathy. In our previous study, the Huaju Xiaoji (HJXJ) formula promoted the renal function of patients with diabetes and hypertensive nephropathy. In this study, we investigated the therapeutic effect and regulation mechanism of HJXJ in hypertensive diabetic mice with nephropathy.
Methods: We constructed a mouse hypertensive diabetic nephropathy (HDN) model by treating mice with streptozotocin (STZ) and nomega-nitro-L-arginine methyl ester (LNAME). We also constructed a human glomerular mesangial cell (HGMC) model that was induced by high doses of sugar (30 mmol/mL) and TGFβ1 (5 ng/mL). Pathological changes were evaluated by hematoxylin and eosin (H&E) staining, periodic acid Schiff (PAS) staining, and Masson staining. The fibrosis-related molecules (TGFβ1, fibronectin, laminin, COL I, COL IV, α-SMA, and p-smad2/3) were detected by enzyme-linked immunosorbent assay (ELISA). The mRNA levels and protein expression of endoplasmic reticulum stress, fibrosis molecules, and their downstream molecules were assessed using qPCR and Western blotting assays.
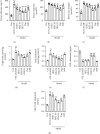
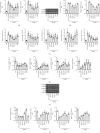
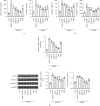
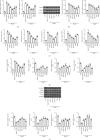
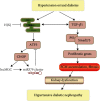
Results: Administering HJXJ promoted the renal function of HDN mice. HJXJ reduced the expression of ER stress makers (CHOP and GRP78) and lncMGC, miR379, miR494, miR495, miR377, CUGBP2, CPEB4, EDEM3, and ATF3 in HDN mice and model HGMCs. The positive control drugs (dapagliflozin and valsartan) also showed similar effects after treatment with HJXJ. Additionally, in model HGMCs, the overexpression of CHOP or lncMGC decreased the effects of HJXJ-M on the level of fibrosis molecules and downstream target molecules.
Conclusion: In this study, we showed that the HJXJ formula may regulate ERS-lncMGC/miRNA to enhance renal function in hypertensive diabetic mice with nephropathy. This study may act as a reference for further investigating whether combining HJXJ with other drugs can enhance its therapeutic effect. The findings of this study might provide new insights into the clinical treatment of hypertensive diabetic nephropathy with HJXJ.
Copyright © 2024 Zeng Zhang et al.
Conflict of interest statement
The authors of this work have nothing to disclose.
Figures




Similar articles
-
Huajuxiaoji Formula Alleviates Phenyl Sulfate-Induced Diabetic Kidney Disease by Inhibiting NLRP3 Inflammasome Activation and Pyroptosis.J Diabetes Res. 2024 Jul 15;2024:8772009. doi: 10.1155/2024/8772009. eCollection 2024. J Diabetes Res. 2024. PMID: 39040854 Free PMC article.
-
Terpene glycoside component from Moutan Cortex ameliorates diabetic nephropathy by regulating endoplasmic reticulum stress-related inflammatory responses.J Ethnopharmacol. 2016 Dec 4;193:433-444. doi: 10.1016/j.jep.2016.09.043. Epub 2016 Sep 21. J Ethnopharmacol. 2016. PMID: 27664441
-
Nepeta angustifolia C. Y. Wu improves renal injury in HFD/STZ-induced diabetic nephropathy and inhibits oxidative stress-induced apoptosis of mesangial cells.J Ethnopharmacol. 2020 Jun 12;255:112771. doi: 10.1016/j.jep.2020.112771. Epub 2020 Mar 19. J Ethnopharmacol. 2020. PMID: 32201300
-
Clinical efficacies, underlying mechanisms and molecular targets of Chinese medicines for diabetic nephropathy treatment and management.Acta Pharm Sin B. 2021 Sep;11(9):2749-2767. doi: 10.1016/j.apsb.2020.12.020. Epub 2021 Feb 2. Acta Pharm Sin B. 2021. PMID: 34589395 Free PMC article. Review.
-
MicroRNAs in kidney function and disease.Transl Res. 2011 Apr;157(4):236-40. doi: 10.1016/j.trsl.2011.01.011. Epub 2011 Feb 3. Transl Res. 2011. PMID: 21420034 Free PMC article. Review.
Cited by
-
Relevant Serum Endoplasmic Reticulum Stress Biomarkers in Type 2 Diabetes and Its Complications: A Systematic Review and Meta-Analysis.Antioxidants (Basel). 2024 Dec 19;13(12):1564. doi: 10.3390/antiox13121564. Antioxidants (Basel). 2024. PMID: 39765892 Free PMC article. Review.
-
WTAP-mediated m6A modification of TRIM22 promotes diabetic nephropathy by inducing mitochondrial dysfunction via ubiquitination of OPA1.Redox Rep. 2024 Dec;29(1):2404794. doi: 10.1080/13510002.2024.2404794. Epub 2024 Sep 23. Redox Rep. 2024. PMID: 39314036 Free PMC article.
-
Alleviating the Effects of Electrolyzed Alkaline Water on Hyperuricemia in Mice.Nutrients. 2025 May 14;17(10):1673. doi: 10.3390/nu17101673. Nutrients. 2025. PMID: 40431413 Free PMC article.
-
Involvement of dysregulated RNA binding protein and alternative splicing regulatory networks in diabetic nephropathy from type 2 albuminuric cohorts.BMC Nephrol. 2025 Jul 1;26(1):326. doi: 10.1186/s12882-025-04237-6. BMC Nephrol. 2025. PMID: 40597902 Free PMC article.
References
-
- Packham D. K., Alves T. P., Dwyer J. P., et al. Relative incidence of ESRD versus cardiovascular mortality in proteinuric type 2 diabetes and nephropathy: results from the DIAMETRIC (diabetes mellitus treatment for renal insufficiency consortium) database. American Journal of Kidney Diseases: the Official Journal of the National Kidney Foundation . 2012;59(1):75–83. doi: 10.1053/j.ajkd.2011.09.017. - DOI - PubMed
MeSH terms
Substances
LinkOut - more resources
Full Text Sources
Medical
Research Materials
Miscellaneous

