

Establishment of a mandible defect model in rabbits infected with multiple bacteria and bioinformatics analysis
- PMID: 38282893
- PMCID: PMC10811100
- DOI: 10.3389/fbioe.2024.1350024
Establishment of a mandible defect model in rabbits infected with multiple bacteria and bioinformatics analysis
Abstract
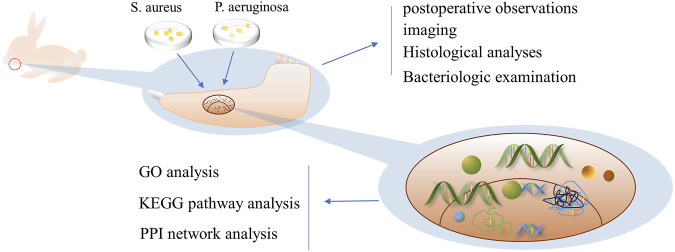
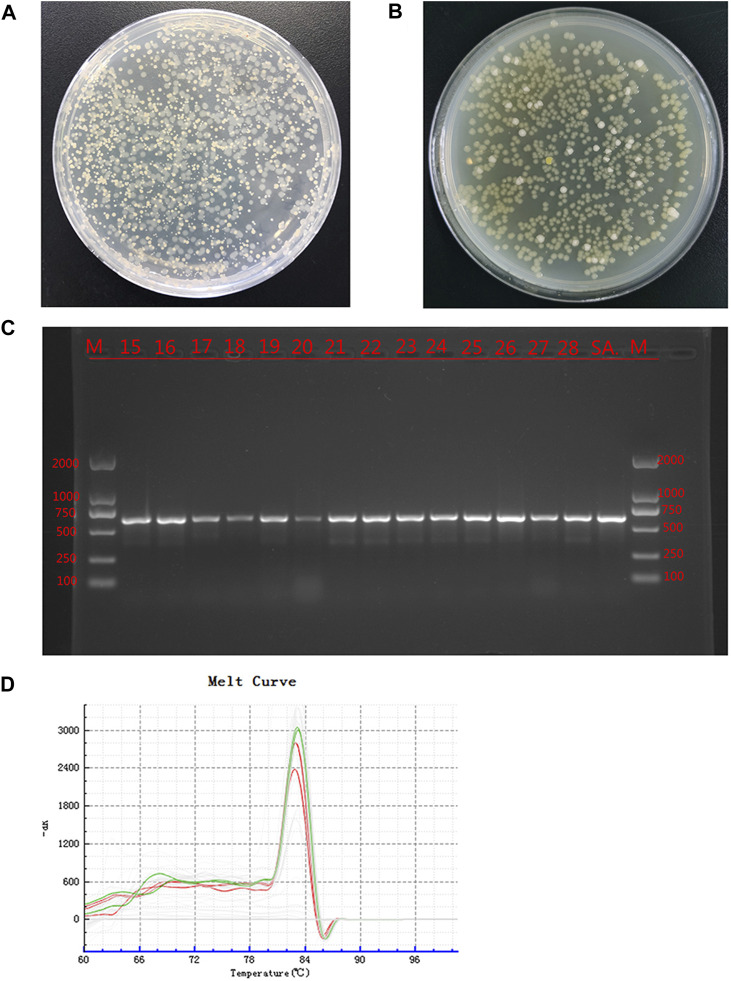
Objective: A model of chronic infectious mandibular defect (IMD) caused by mixed infection with Staphylococcus aureus and Pseudomonas aeruginosa was established to explore the occurrence and development of IMD and identify key genes by transcriptome sequencing and bioinformatics analysis. Methods: S. aureus and P. aeruginosa were diluted to 3 × 10⁸ CFU/mL, and 6 × 3 × 3 mm defects lateral to the Mandibular Symphysis were induced in 28 New Zealand rabbits. Sodium Morrhuate (0.5%) and 50 μL bacterial solution were injected in turn. The modeling was completed after the bone wax closed; the effects were evaluated through postoperative observations, imaging and histological analyses. Gene Ontology (GO), Kyoto Encyclopedia of Genes and Genomes (KEGG) pathway, and protein‒protein interaction (PPI) network analyses were performed to investigate the function of the differentially expressed genes (DEGs). Results: All rabbits showed characteristics of infection. The bacterial cultures were positive, and polymerase chain reaction (PCR) was used to identify S. aureus and P. aeruginosa. Cone beam CT and histological analyses showed inflammatory cell infiltration, pus formation in the medullary cavity, increased osteoclast activity in the defect area, and blurring at the edge of the bone defect. Bioinformatics analysis showed 1,804 DEGs, 743 were upregulated and 1,061 were downregulated. GO and KEGG analyses showed that the DEGs were enriched in immunity and osteogenesis inhibition, and the core genes identified by the PPI network were enriched in the Hedgehog pathway, which plays a role in inflammation and tissue repair; the MEF2 transcription factor family was predicted by IRegulon. Conclusion: By direct injection of bacterial solution into the rabbit mandible defect area, the rabbit chronic IMD model was successfully established. Based on the bioinformatics analysis, we speculate that the Hedgehog pathway and the MEF2 transcription factor family may be potential intervention targets for repairing IMD.
Keywords: animal model; bioinformatics analysis; infectious mandible defects; mixed bacterial solution; the hedgehog pathway.
Copyright © 2024 Zhao, Su, Xu, Li, Hu, Li, Yang, Zhao and Zhang.
Conflict of interest statement
The authors declare that the research was conducted in the absence of any commercial or financial relationships that could be construed as a potential conflict of interest.
Figures


Similar articles
-
Bioinformatics analyses of significant genes, related pathways and candidate prognostic biomarkers in glioblastoma.Mol Med Rep. 2018 Nov;18(5):4185-4196. doi: 10.3892/mmr.2018.9411. Epub 2018 Aug 21. Mol Med Rep. 2018. PMID: 30132538 Free PMC article.
-
Identification of differentially expressed genes, associated functional terms pathways, and candidate diagnostic biomarkers in inflammatory bowel diseases by bioinformatics analysis.Exp Ther Med. 2019 Jul;18(1):278-288. doi: 10.3892/etm.2019.7541. Epub 2019 May 3. Exp Ther Med. 2019. PMID: 31258663 Free PMC article.
-
Bioinformatics analyses of gene expression profile identify key genes and functional pathways involved in cutaneous lupus erythematosus.Clin Rheumatol. 2022 Feb;41(2):437-452. doi: 10.1007/s10067-021-05913-2. Epub 2021 Sep 23. Clin Rheumatol. 2022. PMID: 34553293
-
Bioinformatics analysis of fibroblasts exposed to TGF‑β at the early proliferation phase of wound repair.Mol Med Rep. 2017 Dec;16(6):8146-8154. doi: 10.3892/mmr.2017.7619. Epub 2017 Sep 26. Mol Med Rep. 2017. PMID: 28983581 Free PMC article.
-
Identification of key pathways and genes in nasopharyngeal carcinoma using bioinformatics analysis.Oncol Lett. 2019 May;17(5):4683-4694. doi: 10.3892/ol.2019.10133. Epub 2019 Mar 8. Oncol Lett. 2019. PMID: 30988824 Free PMC article.
References
LinkOut - more resources
Full Text Sources
Molecular Biology Databases