

Picosecond resolution of tyrosine fluorescence and anisotropy decays by 2-GHz frequency-domain fluorometry
- PMID: 3828310
- PMCID: PMC6910823
- DOI: 10.1021/bi00375a012
Picosecond resolution of tyrosine fluorescence and anisotropy decays by 2-GHz frequency-domain fluorometry
Abstract
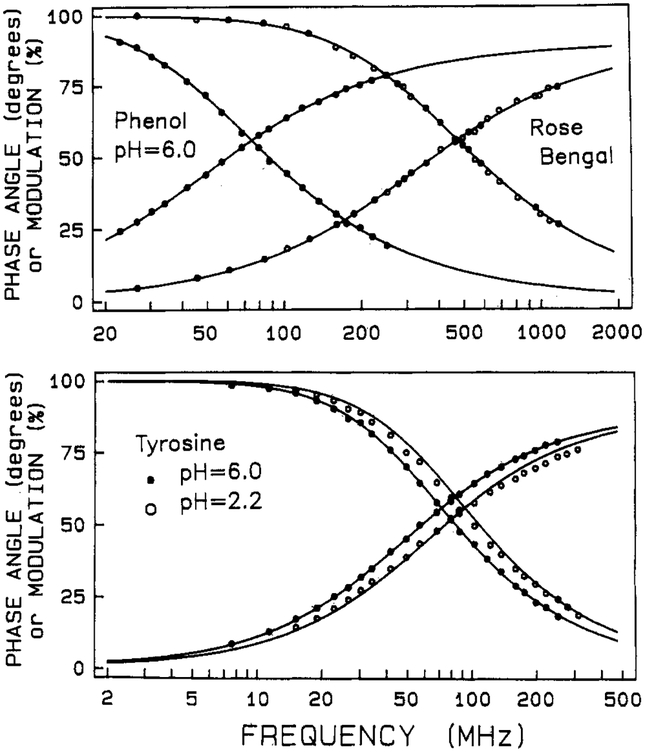
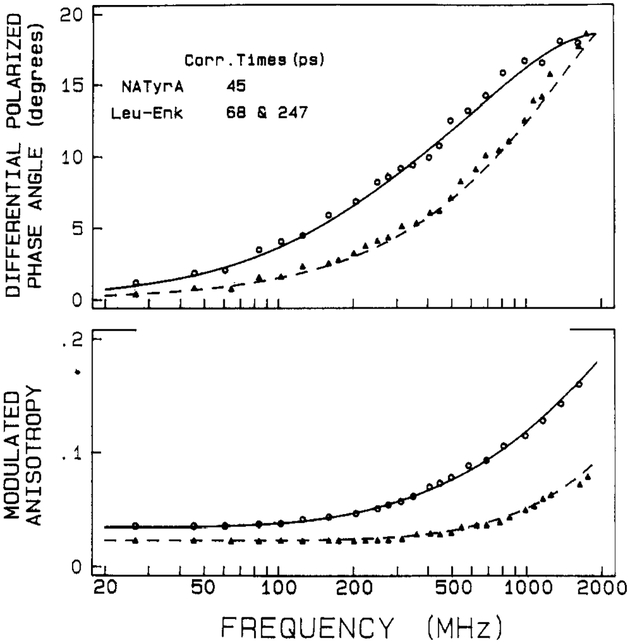
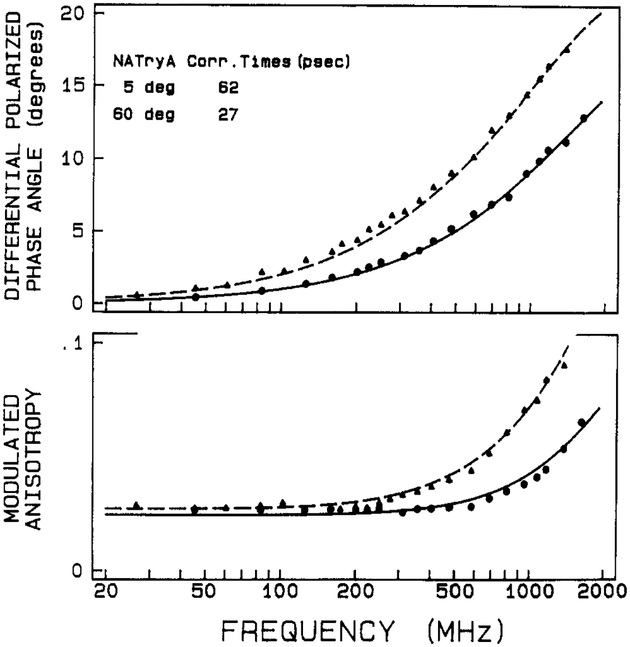
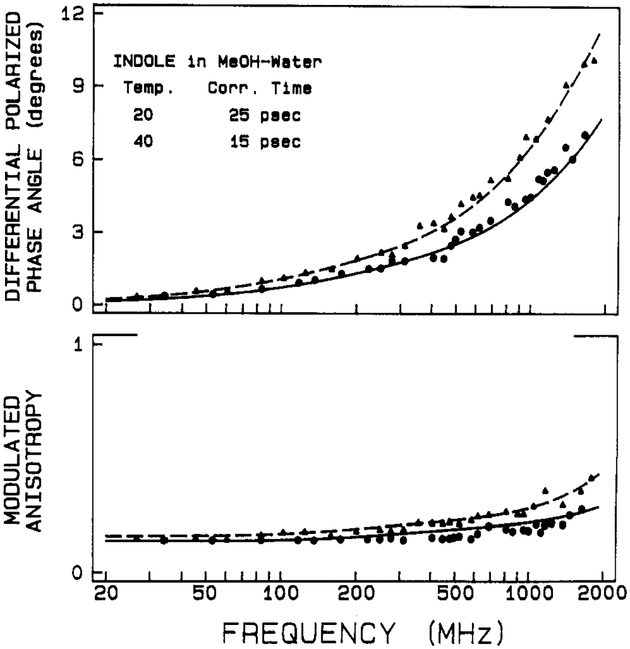
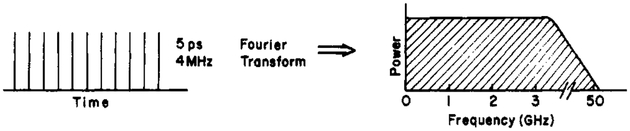
We extended the technique of frequency-domain fluorometry to an upper frequency limit of 2000 MHz. This was accomplished by using the harmonic content of a laser pulse train (3.76 MHz, 5 ps) from a synchronously pumped and cavity-dumped dye laser. We used a microchannel plate photomultiplier as the detector to obtain the 2-GHz bandwidth. This new instrument was used to examine tyrosine intensity and anisotropy decays from peptides and proteins. These initial data sets demonstrate that triply exponential tyrosine intensity decays are easily recoverable, even if the mean decay time is less than 1 ns. Importantly, the extended frequency range provides good resolution of rapid and/or multiexponential tyrosine anisotropy decays. Correlation times as short as 15 ps have been recovered for indole, with an uncertainty of +/- 3 ps. We recovered a doubly exponential anisotropy decay of oxytoxin (29 and 454 ps), which probably reflects torsional motions of the phenol ring and overall rotational diffusion, respectively. Also, a 40-ps component was found in the anisotropy decay of bovine pancreatic trypsin inhibitor, which may be due to rapid torsional motions of the tyrosine residues and/or energy transfer among these residues. The rapid component has an amplitude of 0.05, which is about 16% of the total anisotropy. The availability of 2-GHz frequency-domain data extends the measurable time scale for fluorescence to overlap with that of molecular dynamics calculations.
Figures


Similar articles
-
Picosecond resolution of oxytocin tyrosyl fluorescence by 2 GHz frequency-domain fluorometry.Biophys Chem. 1986 Jul;24(2):97-100. doi: 10.1016/0301-4622(86)80002-3. Biophys Chem. 1986. PMID: 3756310
-
Intensity and anisotropy decays of [Leu5] enkephalin tyrosyl fluorescence by 10 GHz frequency-domain fluorometry.Biophys Chem. 1993 Jul;47(1):33-40. doi: 10.1016/0301-4622(93)80030-m. Biophys Chem. 1993. PMID: 8364147
-
Frequency-domain measurements of the rotational dynamics of the tyrosine groups of calmodulin.Biophys Chem. 1988 May;30(1):49-59. doi: 10.1016/0301-4622(88)85003-8. Biophys Chem. 1988. PMID: 3416036
-
Gigahertz frequency-domain fluorometry: resolution of complex decays, picosecond processes and future developments.J Photochem Photobiol B. 1988 Nov;2(3):295-311. doi: 10.1016/1011-1344(88)85050-4. J Photochem Photobiol B. 1988. PMID: 3148695 Review.
-
Frequency domain fluorometry with pulsed light-emitting diodes.Ann N Y Acad Sci. 2008;1130:56-61. doi: 10.1196/annals.1430.026. Ann N Y Acad Sci. 2008. PMID: 18596332 Review.
Cited by
-
Distance distributions in proteins recovered by using frequency-domain fluorometry. Applications to troponin I and its complex with troponin C.Biochemistry. 1988 Dec 27;27(26):9149-60. doi: 10.1021/bi00426a012. Biochemistry. 1988. PMID: 3242618 Free PMC article.
-
Transient Effects in Fluorescence Quenching Measured by 2-GHz Frequency-Domain Fluorometry.J Phys Chem. 1987 Jun;91(12):3277-3285. doi: 10.1021/j100296a035. J Phys Chem. 1987. PMID: 31908358 Free PMC article.
-
RESOLUTION OF A DISTRIBUTION OF DISTANCES BY FLUORESCENCE ENERGY TRANSFER AND FREQUENCY-DOMAIN FLUOROMETRY.Chem Phys Lett. 1987 Aug 7;138(6):587-593. doi: 10.1016/0009-2614(87)80130-6. Epub 2001 Dec 6. Chem Phys Lett. 1987. PMID: 31839681 Free PMC article.
-
Conformational differences of oxytocin and vasopressin as observed by fluorescence anisotropy decays and transient effects in collisional quenching of tyrosine fluorescence.J Fluoresc. 1991 Sep;1(3):163-76. doi: 10.1007/BF00865363. J Fluoresc. 1991. PMID: 24242994
-
Review of fluorescence anisotropy decay analysis by frequency-domain fluorescence spectroscopy.J Fluoresc. 1993 Jun;3(2):103-16. doi: 10.1007/BF00865324. J Fluoresc. 1993. PMID: 24234774
References
-
- Albani J, Alpert B, Krajcarski DT, & Szabo AG (1985) FEBS Lett. 182, 302–304. - PubMed
-
- Bevington PR (1969) Data Reduction and Error Analysis for the Physical Sciences, McGraw-Hill, New York.
-
- Brand L, Knutson JR, Davenport L, Beechem JM, Dale RE, Walbridge DG, & Kowalczyk AA (1985) in Spectroscopy and the Dynamics of Molecular Biological Systems (Bayley P. Ma, & Dale RE, Eds.) Academic Press, New York.
-
- Cundall RB, & Dale RE (1980) Time-Resolved Fluorescence Spectroscopy in Biochemistry and Biology, Plenum Press, New York.
-
- Gauduchon P, & Wahl Ph. (1978) Biophys. Chem 8, 87–104. - PubMed
Publication types
MeSH terms
Substances
Grants and funding
LinkOut - more resources
Full Text Sources
Miscellaneous