

pNaKtide Inhibits Na/K-ATPase Signaling and Attenuates Obesity
- PMID: 38283397
- PMCID: PMC10812088
pNaKtide Inhibits Na/K-ATPase Signaling and Attenuates Obesity
Abstract
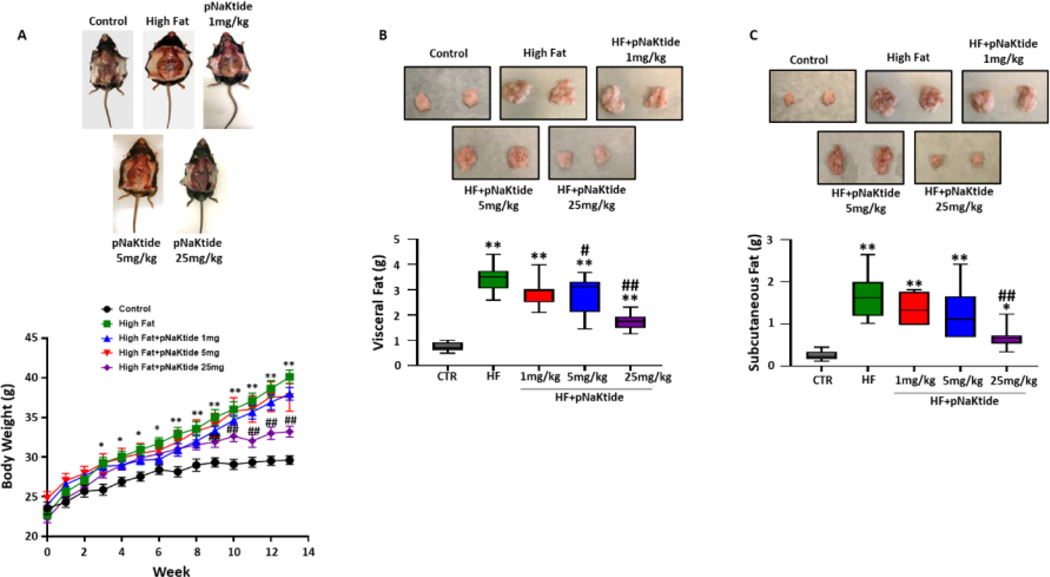
Obesity is a growing public health crisis across the world and has been recognized as an underlying risk factor for metabolic syndrome. Growing evidence demonstrates the critical role of oxidative stress in the pathophysiological mechanisms of obesity and related metabolic dysfunction. As we have established previously that Na/K-ATPase can amplify oxidative stress signaling, we aimed to explore the effect of inhibition of this pathway on obesity phenotype using the peptide antagonist, pNaKtide. The experiments performed in murine preadipocytes showed the dose-dependent effect of pNaKtide in attenuating oxidant stress and lipid accumulation. Furthermore, these in vitro findings were confirmed in C57Bl6 mice fed a high-fat diet. Interestingly, pNaKtide could significantly reduce body weight, ameliorate systemic oxidative and inflammatory milieu and improve insulin sensitivity in obese mice. Hence the study demonstrates the therapeutic utility of pNaKtide as an inhibitor of Na/K-ATPase oxidant amplification signaling to alleviate obesity and associated comorbidities.
Keywords: Adipose tissue; Na/K-ATPase; Obesity; Oxidative stress.
Conflict of interest statement
COMPETING INTERESTS All the authors declare that there are no competing interests.
Figures


Similar articles
-
RETRACTED: pNaKtide inhibits Na/K-ATPase reactive oxygen species amplification and attenuates adipogenesis.Sci Adv. 2015 Oct 16;1(9):e1500781. doi: 10.1126/sciadv.1500781. eCollection 2015 Oct. Sci Adv. 2015. Retraction in: Sci Adv. 2022 Oct 21;8(42):eadf3052. doi: 10.1126/sciadv.adf3052. PMID: 26601314 Free PMC article. Retracted.
-
Uremic Toxins Activates Na/K-ATPase Oxidant Amplification Loop Causing Phenotypic Changes in Adipocytes in In Vitro Models.Int J Mol Sci. 2018 Sep 10;19(9):2685. doi: 10.3390/ijms19092685. Int J Mol Sci. 2018. PMID: 30201874 Free PMC article.
-
pNaKtide Attenuates Steatohepatitis and Atherosclerosis by Blocking Na/K-ATPase/ROS Amplification in C57Bl6 and ApoE Knockout Mice Fed a Western Diet.Sci Rep. 2017 Mar 15;7(1):193. doi: 10.1038/s41598-017-00306-5. Sci Rep. 2017. Retraction in: Sci Rep. 2022 May 30;12(1):9006. doi: 10.1038/s41598-022-13458-w. PMID: 28298638 Free PMC article. Retracted.
-
The Role of Na/K-ATPase Signaling in Oxidative Stress Related to Obesity and Cardiovascular Disease.Molecules. 2016 Sep 3;21(9):1172. doi: 10.3390/molecules21091172. Molecules. 2016. PMID: 27598118 Free PMC article. Review.
-
Mechanistic Insight of Na/K-ATPase Signaling and HO-1 into Models of Obesity and Nonalcoholic Steatohepatitis.Int J Mol Sci. 2019 Dec 21;21(1):87. doi: 10.3390/ijms21010087. Int J Mol Sci. 2019. PMID: 31877680 Free PMC article. Review.
Cited by
-
Gamma-Benzylidene Digoxin Derivative Attenuates Neurotoxicity Response in a Murine Stroke Model.Transl Stroke Res. 2025 Jul 12. doi: 10.1007/s12975-025-01365-x. Online ahead of print. Transl Stroke Res. 2025. PMID: 40650840
-
Na+/K+-ATPase: More than an Electrogenic Pump.Int J Mol Sci. 2024 Jun 1;25(11):6122. doi: 10.3390/ijms25116122. Int J Mol Sci. 2024. PMID: 38892309 Free PMC article. Review.
-
The pump, the exchanger, and the Holy Spirit: tracing the 40-year evolution of the Ouabain-Na+ pump endocrine system concept.Ann Med Surg (Lond). 2025 May 30;87(7):4281-4302. doi: 10.1097/MS9.0000000000003438. eCollection 2025 Jul. Ann Med Surg (Lond). 2025. PMID: 40851957 Free PMC article. Review.
-
Rostafuroxin, the inhibitor of endogenous ouabain, ameliorates chronic undernutrition-induced hypertension, stroke volume, cardiac output, left-ventricular fibrosis and alterations in Na+-transporting ATPases in rats.J Mol Cell Cardiol Plus. 2024 Dec 28;11:100281. doi: 10.1016/j.jmccpl.2024.100281. eCollection 2025 Mar. J Mol Cell Cardiol Plus. 2024. PMID: 40182150 Free PMC article.
References
-
- Lafontan M Adipose tissue and adipocyte dysregulation. Diabetes Metab. 2014;40(1):16–28. - PubMed
-
- Crujeiras AB, Diaz-Lagares A, Carreira MC, Amil M, Casanueva FF. Oxidative stress associated to dysfunctional adipose tissue: A potential link between obesity, type 2 diabetes mellitus and breast cancer. Free Radic Res. 2013;47(4):243–256. - PubMed
-
- Galinier A, Carriere A, Fernandez Y, Carpene C, Andre M, Caspar-Bauguil S, et al. Adipose tissue proadipogenic redox changes in obesity. J Biol Chem. 2006;281(18):12682–12687. - PubMed
Grants and funding
LinkOut - more resources
Full Text Sources
Research Materials